Since the revolutionization of the concept by Docker in 2013, containers have become a mainstay in application development. Their speed and resource efficiency make them ideal for a DevOps environment as they allow developers to run software faster and more reliably, no matter where it is deployed. With containerization, it’s possible to move and scale several applications across clouds and data centers.
However, this scalability can eventually become an operational challenge. In a scenario where an enterprise is tasked with efficiently running several containers carrying multiple applications, container orchestration becomes not just an option but a necessity.
What is container orchestration?
Container orchestration is the automated process of managing, scaling, and maintaining containerized applications. Containers are executable units of software containing application code, libraries, and dependencies so that the application can be run anywhere. Container orchestration tools automate the management of several tasks that software teams encounter in a container’s lifecycle, including the following:
- Deployment
- Scaling and load balancing/traffic routing
- Networking
- Insights
- Provisioning
- Configuration and scheduling
- Allocation of resources
- Moving to physical hosts
- Service discovery
- Health monitoring
- Cluster management
How does container orchestration work?
There are different methodologies that can be applied in container orchestration, depending on the tool of choice. Container orchestration tools typically communicate with YAML or JSON files that describe the configuration of the application. Configuration files guide the container orchestration tool on how and where to retrieve container images, create networking between containers, store log data, and mount storage volumes.
The container orchestration tool also schedules the deployment of containers into clusters and automatically determines the most appropriate host for the container. After a host has been determined, the container orchestration tool manages the container’s lifecycle using predefined specifications provided in the container’s definition file.
Container orchestration tools can be used in any environment that runs containers. Several platforms offer container orchestration support, including Kubernetes, Docker Swarm, Amazon Elastic Container Service (ECS), and Apache Mesos.
Challenges and best practices in container orchestration
While container orchestration offers transformative benefits, it’s not without its challenges. Understanding these potential pitfalls and adopting best practices can help organizations maximize the value of their orchestration efforts.
Common challenges
- Complexity in setup and operation
Setting up container orchestration can be daunting, especially for teams new to the technology. Configuring clusters, managing dependencies, and defining orchestration policies often require significant expertise. The steep learning curve, particularly with tools like Kubernetes, can slow adoption and hinder productivity. - Security risks with containerized environments
Containerized applications introduce unique security challenges, including vulnerabilities in container images, misconfigurations in orchestration platforms, and potential network exposure. Orchestrators need robust security measures to safeguard data and applications. - Vendor lock-in with proprietary solutions
Organizations relying on proprietary orchestration tools or cloud-specific platforms may find it difficult to migrate workloads or integrate with other environments. This can limit flexibility and increase long-term costs. - Performance bottlenecks
Resource contention, inefficient scaling policies, and poorly optimized configurations can lead to performance issues, impacting application reliability and user experience.
Best practices for successful container orchestration
- Simplify and automate with CI/CD pipelines
Automating workflows using Continuous Integration and Continuous Deployment (CI/CD) pipelines reduces manual intervention and ensures consistency in deployments. Tools like Jenkins or GitLab can integrate seamlessly with container orchestration platforms to streamline operations. - Proactively monitor and manage clusters
Monitoring tools like LogicMonitor can be used to track container performance, resource usage, and application health. Proactive alerts and dashboards help identify and resolve issues before they impact users, ensuring reliability and uptime. - Prioritize security from the start
Implement security best practices such as:- Regularly scanning container images for vulnerabilities.
- Enforcing Role-Based Access Control (RBAC) to restrict permissions.
- Configuring network policies to isolate containers and protect sensitive data. By building security into the orchestration process, organizations can mitigate risks and maintain compliance.
- Start small and scale gradually
Begin with a minimal setup to gain familiarity with orchestration tools. Focus on automating a few processes, then gradually expand the deployment to handle more complex workloads as the team’s expertise grows. - Optimize resource allocation
Regularly review resource usage and scaling policies to ensure efficient operation. Use orchestration features like auto-scaling to adjust resources based on demand dynamically. - Choose flexible, open solutions
To avoid vendor lock-in, prioritize tools like Kubernetes that support multi-cloud or hybrid deployments and integrate with a wide range of environments and services.
How does Kubernetes orchestration work?
Kubernetes is an open-source container orchestration platform that is considered the industry standard. The Google-backed solution allows developers and operators to deliver cloud services, either as Platform-as-a-Service (PaaS) or Infrastructure-as-a-Service (IaaS). It’s a highly declarative solution, allowing developers to declare the desired state of their container environment through YAML files. Kubernetes then establishes and maintains that desired state.
The following are the main architecture components of Kubernetes:
Nodes
A node is a worker machine in Kubernetes. It may be virtual or physical, depending on the cluster. Nodes receive and perform tasks assigned from the Master Node. They also contain the necessary services to run pods. Each node comprises a kubelet, a container runtime, and a kube-proxy.
Master Node
This node controls all the worker nodes and originates all assigned tasks. It does this through the control pane, which is the orchestration layer that exposes the API and interfaces to define, deploy, and manage the lifecycles of containers.
Cluster
A cluster represents the master node and multiple worker nodes. Clusters combine these machines into a single unit to which containerized applications are deployed. The workload is then distributed to various nodes, making adjustments as nodes are added or removed.
Pods
Pods are the smallest deployable computing units that can be created and managed in Kubernetes. Each Pod represents a collection of containers packaged together and deployed to a node.
Deployments
A deployment provides declarative updates for Pods and ReplicaSets. It enables users to designate how many replicas of a Pod they want running simultaneously.
How does Docker orchestration work?
Docker, also an open-source platform, provides a fully integrated container orchestration tool known as Docker Swarm. It can package and run applications as containers, locate container images from other hosts, and deploy containers. It is simpler and less extensile than Kubernetes, but Docker provides the option of integration with Kubernetes for organizations that want access to Kubernetes’ more extensive features.
The following are the main architectural components of Docker Swarm:
Swarm
A swarm is a cluster of Docker hosts that run in swarm mode and manage membership and delegation while also running swarm services.
Node
A node is the docker engine instance included in a swarm. It can be either a manager node or a worker node. The manager node dispatches units of work called tasks to worker nodes. It’s also responsible for all orchestration and container management tasks like maintaining cluster state and service scheduling. Worker nodes receive and execute tasks.
Services and Tasks
A service is the definition of a task that needs to be executed on the nodes. It defines which container images to use and which commands to execute inside running containers.
A task carries a container alongside the commands to run inside the container. Once a task is assigned to a node, it cannot move to another node.
How does container orchestration work with other Platforms?
Although Docker and Kubernetes are leading the pack when it comes to container orchestration, other platforms are capitalizing on their open-source software to provide competition.
Red Hat OpenShift is an open-source enterprise-grade hybrid platform that provides Kubernetes functionalities to companies that need managed container orchestration. Its framework is built on a Linux OS that allows users to automate the lifecycles of their containers.
Google Kubernetes Engine is powered by Kubernetes and enables users to easily deploy, manage, and scale Docker containers on Google Cloud.
Other platforms like Apache Mesos and Amazon ECS have developed their own container tools that allow users to run containers while ensuring security and high scalability.
Tool comparisons: Finding the right fit for your needs
When choosing the best container orchestration tool for an organization, several factors have to be taken into consideration. These factors vary across different tools. With a tool like Mesos, for instance, the software team’s technical experience must be considered as it is more complex than simple tools like Swarm. Organizations also have to consider the number of containers to be deployed, as well as application development speed and scaling requirements.
With the right tools and proper resource management, container orchestration can be a valuable approach for organizations looking to achieve improved productivity and scalability.
Below is a comparison of the most popular tools in the container orchestration space, highlighting their key features and ideal use cases.
| Tool | Scalability | Learning Curve | Supported Environments | Key Integrations | Best For |
| Kubernetes | Excellent for large, complex setups | Steep, requires expertise | On-premises, cloud (AWS, GCP, Azure) | CI/CD pipelines, monitoring tools, Istio | Enterprises requiring robust orchestration for multi-cloud or hybrid environments. |
| Docker Swarm | Moderate, ideal for small clusters | Low, easy for Docker users | On-premises, cloud | Docker ecosystem, Kubernetes (optional integration) | Small to medium teams seeking straightforward orchestration within the Docker platform. |
| Amazon ECS | Highly scalable within AWS ecosystem | Moderate, AWS-specific knowledge | AWS (native service) | AWS services (EKS, CloudWatch, IAM) | Businesses already leveraging AWS services for containerized applications. |
| Red Hat OpenShift | Enterprise-grade, highly scalable | Moderate, depends on Kubernetes base | Hybrid environments, Linux-based on-premise/cloud | OpenShift tools, Kubernetes integrations | Enterprises needing managed Kubernetes with robust security and enterprise-grade features. |
| Apache Mesos | Extremely scalable for large systems | High, requires advanced expertise | On-premises, private cloud | Marathon, custom integrations | Advanced users managing diverse workloads beyond containers, such as big data and microservices. |
Examples of container orchestration
Container orchestration provides a number of benefits for organizations, but what do those benefits look like in real-world work situations? We included a couple of common orchestration examples below:
First, consider a large e-commerce platform that experiences heavy traffic during the holiday season. In the past, that platform would have to manually provision additional servers to handle the increased holiday load, which is a time-consuming and error-prone process. With container orchestration, the platform can use an auto-scaling feature that automatically provisions additional containers as traffic increases and scales back down when traffic decreases. That way, increased traffic for the holiday rush can die down in January once everyone buys, returns, and exchanges their items.
Second, consider a company that has a website, a mobile app, and a back-end processing system that all runs on different servers in different environments. In the past, managing these different applications and environments would require much manual effort and coordination. With container orchestration, the company can use a single platform to manage all of its containers and environments, allowing it to easily deploy, manage, and scale its applications across different environments. This allows the company to adopt new technologies more easily and streamline its development process.
Monitor your containers with LogicMonitor today
Container orchestration is a critical component of modern application development, enabling teams to efficiently manage, scale, and secure containerized environments. By addressing the challenges of complexity, security, and resource management, and leveraging best practices like CI/CD pipelines and proactive monitoring, organizations can maximize the benefits of container orchestration while minimizing operational overhead.
To fully realize the potential of container orchestration, having a reliable monitoring solution is essential. LogicMonitor offers scalable, dynamic monitoring for ephemeral containerized resources alongside your hybrid cloud infrastructure. With LogicMonitor, you gain visibility into your Kubernetes and Docker applications through a single, unified platform that automatically adapts to your container resource changes.
What is NoSQL?
NoSQL is a non-tabular database that has a different data structure than relational tables. It is sometimes referred to as Non-SQL. NoSQL typically avoids relational data storage; however, while it can handle relationships in data storage, those relationships are built for specialized purposes.
There is much debate regarding SQL vs. NoSQL, with each data management system geared toward specific uses. Unlike SQL, which was developed in the 1970s to limit data duplication, NoSQL is a relatively new type of database. NoSQL came about in response to increasing amounts of data, and it uses a distributed system to help organize large amounts of structured and unstructured data. NoSQL is popular in business tech and other industries, with large organizations such as Amazon, Google, and LinkedIn using NoSQL databases.
Today, large companies are increasingly using NoSQL for data management. For example, a business that needs to store large amounts of unstructured and structured data or manage real-time streaming will want to consider NoSQL.
How NoSQL databases work
NoSQL databases function differently from traditional relational databases, offering a more flexible and scalable approach to data management. Their unique operational mechanisms make them well-suited for handling large-scale, distributed data environments.
NoSQL databases use flexible schemas, allowing dynamic and adaptable data models. Unlike SQL databases with predefined schemas, NoSQL supports various data types, including structured, semi-structured, and unstructured formats. Developers can update schemas without disrupting existing records, enabling rapid application development.
These databases also operate on distributed architectures, spreading data across multiple servers or nodes to ensure high availability, fault tolerance, and seamless scaling. Data replication guarantees durability, while partitioning efficiently distributes workloads to maintain performance under heavy demand.
Additionally, NoSQL terminology differs from SQL’s traditional structure. Collections in NoSQL function similarly to tables, grouping related data. Documents replace rows, allowing more flexible records. Some NoSQL models use key-value pairs or column families instead of columns to organize data.
Types of NoSQL databases
The structure and layout of different NoSQL database types depend on the data model. The four main structures are document, graph, key-value, and wide-column.
Document Databases – These databases store data similar to JavaScript Object Notation (JSON). Every document will contain pairs of values and fields, but it does not need foreign keys because specific relationships between documents don’t exist. Other essential features include fast creation, easy maintenance, flexible schema, and open formats.
Graph Databases – This format is primarily for data represented in a graph, such as road maps and public transportation information. The graphs store data in edges and nodes. Nodes generally contain information about people, places, and things, while edges store relational information between the nodes. Using a graph database enables quick identification of data relationships.
Wide-Column Databases – A wide-column database stores information in columns instead of rows. The columns form subgroups, and columns in the same family or cluster can contain different data types. Databases with columns read data more efficiently, and each column has a dynamic schema and isn’t fixed in a table. If you want to store large data, you’ll likely want to consider using wide-column databases.
Key-Value Databases – With the simplest format, key-value databases only have two columns containing keys and values. More extensive data models are sometimes extensions of the key-value database, which uses the associative array as the basic data model. Data also comes in a collection of key-value pairs, and each key never appears more than once in each collection. Important features of this type of database include simplicity, speed, and scalability.
You’ll also see several specific types of NoSQL databases. Examples include:
- BigTable
- Cassandra
- CouchDB
- FaunaDB
- HBase
- MongoDB
- Redis
NoSQL use cases
NoSQL databases excel in handling diverse and complex data environments, making them indispensable for a wide range of modern applications. Their scalability, flexibility, and high performance allow businesses to tackle demanding workloads effectively.
Real-time data management is one of the most compelling use cases for NoSQL. These databases handle large streams of incoming data with minimal latency, making them ideal for real-time analytics, fraud detection, and live social media feeds. Their ability to process data at lightning speed ensures a seamless user experience even during peak demand.
NoSQL databases play an important role in cloud security by supporting dynamic data models and secure storage. Their distributed nature ensures data integrity, availability, and disaster recovery, making them valuable for enterprises managing sensitive information across multiple cloud environments.
High-availability apps benefit greatly from NoSQL’s fault-tolerant and distributed design. Industries like finance, healthcare, and telecommunications rely on NoSQL databases to maintain uptime and continuous service delivery, even during infrastructure failures or spikes in user traffic.
Diverse workloads such as IoT and e-commerce also thrive with NoSQL. In IoT applications, vast amounts of sensor data require scalable storage solutions that can handle real-time processing and analysis. Similarly, e-commerce platforms depend on NoSQL databases for personalized product recommendations, dynamic pricing, and efficient inventory management.
Benefits
NoSQL offers several benefits:
- Easy for developers to use – One of the first advantages of NoSQL is that some systems only require a few lines of code. The databases also require less general maintenance.
- Flexible schemas – NoSQL is non-rigid, making testing and implementing updates easier. This is necessary for most modern applications because fields are different, and you will often need to make changes quickly and easily.
- Horizontal scaling – Expanding NoSQL is relatively easy and inexpensive, providing horizontal scaling because of its lack of structure. This means every element is independent and doesn’t need links. On the other hand, SQL will require upgrades such as more RAM or CPUs for vertical expansion.
- High performance – NoSQL often has higher performance levels than SQL because it doesn’t need to query data through various tables. Since things move much quicker with all the information in one database, doing 10,000 queries each second with some NoSQL databases is possible.
- Large data storage – NoSQL databases have the potential to store massive amounts of data sets, and they can do so at high rates of speed. For example, Cloud BigTable is a NoSQL database that lets you store structured data while allowing addition and deletion without disturbance.
Drawbacks
The potential drawbacks include the following:
- Requires multiple databases – Since the databases are specialized for particular use cases, you’ll need to use various data models and databases. You might still need to use SQL to help streamline the overall process.
- Requires more support – NoSQL is much newer than SQL. SQL is, therefore, more mature and has a lot of online instructional support. With NoSQL, you’ll likely have more difficulty finding expert support when you need assistance.
- Lack of consistency – NoSQL databases lack standardization, and the programming language and design of these databases vary extensively. This variation among NoSQL products is more extensive than with SQL databases.
- Lack of compatibility – NoSQL is not always entirely compatible with SQL instructions.
- Limited ACID applications – Most NoSQL systems don’t support ACID (atomicity, consistency, isolation, durability) transactions. MongoDB is an exception to this situation.
Choosing a NoSQL database
Selecting the right NoSQL database depends on several factors that align with your organization’s data management needs and business goals. NoSQL databases come in various models, each suited to specific use cases, making it essential to evaluate your options carefully. Key considerations include:
1. Data model selection
- Document databases: Ideal for applications requiring flexible schemas, such as content management systems.
- Key-value stores: Best for caching and real-time session management.
- Wide-column stores: Useful for high-volume analytical applications.
- Graph databases: Perfect for applications emphasizing relationships, like social networks.
2. Consistency trade-offs
- Consider your application’s tolerance for data inconsistency. NoSQL databases often sacrifice strict consistency for availability and scalability, following the CAP theorem.
- Use databases with configurable consistency settings if data accuracy is critical.
3. Cloud compatibility
- Choose a NoSQL database that integrates seamlessly with your cloud provider’s ecosystem.
- Consider managed services to reduce operational overhead and focus on development.
4. Migration strategies
- Plan for data migration if switching from a relational database to NoSQL.
- Ensure your team has the skills and tools necessary for a smooth migration process.
Assessing these factors can help you identify the NoSQL database that best meets your business needs, ensuring optimal performance, scalability, and reliability.
What is MongoDB?
MongoDB is a type of NoSQL database that is document-oriented and uses various documents and collections. It is primarily for high-volume data storage. Key-value pairs are the basic unit for MongoDB.
The following are a few of the essential features of MongoDB:
- MongoDB is very scalable. This system allows developers to write code in whatever language they choose.
- It doesn’t need a schema before starting. You can create the fields as you go.
- Every database will contain collections, with each collection housing documents. Each document can have fields with varying sizes and different content.
- It provides quicker query responses.
- MongoDB provides advanced searching.
- The database features indexing to improve search query performance.
- MongoDB provides data replication to send it to multiple nodes. Both primary and secondary nodes can replicate data.
- It supports advanced features for searching any field, range of queries, or regular expression.
- MongoDB provides the oplog (operations log) feature. This is a system that collects and stores all database changes. It keeps the changes chronologically and can help with deeper analysis since the oplog is entirely granular.
Many of these features point to a common theme, which is flexibility. When using SQL best practices, you must work within the database structure. There’s usually only one best way to do things. When using MongoDB, you’ll have several options for optimizing code throughout the process.
Is MongoDB NoSQL?
Yes, MongoDB is a type of NoSQL. MongoDB is a database management system that stores data using binary storage in flat files. This structure is helpful for large amounts of data since data storage is efficient and compact. It is document-based and open-sourced.
When using MongoDB, consider the following tips:
- The _id field must appear in every MongoDB document.
- Sharding is a way to distribute data through several partitions.
- There are size limits to keep in mind. When using MongoDB, you cannot exceed 16 MB for documents.
- There are limits on nested data. However, storing too many arbitrary objects when using MongoDB is usually not a good idea.
- Note that MongoDB restricts certain characters, including the $ sign and a period (.).
Like NoSQL, you’ll need to monitor MongoDB effectively. Several specific areas need monitoring:
- Instance Status
- Instance Hardware Metrics
- Replication Metrics
- Connections Metrics and Cluster Operations
What is the difference between SQL and NoSQL?
SQL is the acronym for Structured Query Language. As the most basic type of database management, SQL is a relational model that searches and retrieves information through different data, fields, and structures. Some of the most fundamental differences between SQL and NoSQL include:
- NoSQL uses dynamic schema for its unstructured data, while SQL uses queried language with a predefined schema.
- NoSQL databases are scalable horizontally, while SQL is scalable vertically.
- NoSQL has document, graph, key-value, or wide-column store databases, while SQL has table-based databases.
- NoSQL is better suited for unstructured data, while SQL will likely use multi-row transactions.
The bottom line
Each database has its merits, but when considering SQL vs. NoSQL, it’s important to remember a few key points. These include SQL being relational while NoSQL is non-relational, SQL databases generally scaling vertically, and NoSQL falling into four types of structures. When selecting from the NoSQL options, consider MongoDB an advanced database capable of handling dynamic schema and big data.
When evaluating NoSQL databases, consider factors such as scalability, consistency, and use case compatibility. Databases like MongoDB, Cassandra, and Redis provide powerful features designed to handle massive workloads and dynamic data models, making them essential for modern cloud-native applications.
Looking to optimize your data management strategy? Explore how LogicMonitor can help you monitor and manage your database infrastructure. Our comprehensive platform ensures visibility, performance, and reliability across all your IT environments.
The art of monitoring the influence of an application’s performance on business outcomes is constantly evolving. It used to be directing IT teams to act on insights from an Application Performance Monitoring (APM) solution was enough to drive business outcomes. Now we know the user experience has a heavy hand in determining whether a digital platform survives or dies. An APM solution keeps tabs on the performance of application components such as servers, databases, and services. When it comes to monitoring user experience, Digital Experience Monitoring (DEM) is the key component organizations need to go a step further and really understand how users (human, machine, or digital) are interacting with their digital platforms.
So what is DEM exactly?
DEM is a practice within application performance management that focuses on monitoring and optimizing the overall user experience of digital apps and services. A DEM-enabled monitoring solution combines various techniques to gain insights into user behaviors, experience metrics (page load times, transaction responses, and error rates), application performance, network performance, and infrastructure performance. This allows organizations to proactively identify and address issues driving user satisfaction, improve the overall user experience, and positively drive business outcomes.
While DEM shares a connection with APM, it focuses more on the user’s perspective by tying performance metrics directly to user behaviors and experiences. DEM also complements observability practices by integrating telemetry data into user-centric insights, bridging the gap between technical performance and real-world user interactions.
Over time, DEM has evolved from basic performance monitoring to a sophisticated practice that combines real user monitoring, synthetic testing, and advanced analytics. This progression reflects the growing importance of delivering seamless digital experiences in increasingly complex environments.
Why does DEM matter?
As a monitoring capability, DEM is what mines and presents critical user patterns and trends to IT teams so they can collaboratively elevate their organization’s digital user experience from good to great. In many organizations, APM data gets splintered and analyzed through the lens of the team looking at it. Where DevOps teams are more likely to look at APM insights to keep tabs on application components and code-level performance, ITOps teams are more likely to pay attention to the data regarding broader infrastructure performance (servers, network devices, and databases). DEM provides unified insights from a variety of sources so both DevOps and ITOps get a unified look at the intertwined influences of user behavior, application performance, network metrics, and infrastructure data. This singular data set, coming directly from the users, gets IT teams out of their silos and at the whiteboard to collaborate on solutions.
Consider one scenario organizations will likely experience: a surge in CPU spikes on the servers. In the absence of DEM, DevOps and ITOps teams likely have separate insights into different application components and services, which limits their ability to troubleshoot the problem collaboratively. DEM bridges the gap between DevOps and ITOps, fostering a unified and cohesive approach to monitoring and optimizing the digital experience. It facilitates cross-functional collaboration, breaking down barriers that traditionally impede effective troubleshooting. By eliminating silos and promoting shared visibility, organizations can streamline incident response, reduce mean time to resolution (MTTR), and enhance the overall user experience.
How digital experience monitoring works
DEM works by leveraging a combination of monitoring techniques and technologies to capture, analyze, and interpret data related to user interactions with digital systems. The primary goal is to provide IT teams with actionable insights into how applications, networks, and infrastructure components impact the end-user experience. Here’s how it operates:
- Data collection: DEM solutions collect data from multiple sources, including real user monitoring (RUM), synthetic monitoring, application logs, and network performance metrics. This data spans application transactions, network latencies, server performance, and user interactions.
- Data correlation: Once collected, DEM correlates data points from these sources to build a cohesive picture of the end-to-end digital experience. For example, it links slow page load times with network bandwidth issues or high CPU usage on backend servers.
- Performance analysis: The solution uses advanced analytics and machine learning to identify patterns and anomalies. This enables IT teams to understand the root causes of performance bottlenecks, such as broken application dependencies or network congestion.
- Visualization of insights: DEM provides intuitive dashboards and reports that showcase user experience metrics, performance trends, and incident details. These visualizations are tailored to different teams, allowing DevOps to focus on application-level details while ITOps can monitor broader infrastructure health.
- Proactive alerting: By leveraging synthetic monitoring and threshold-based alerts, DEM identifies potential issues before they impact users. Simulated user journeys test critical workflows like logins or transactions, offering early warning signs of degradation.
- Collaboration enablement: DEM fosters cross-team collaboration by providing unified insights into user experience. Teams can access the same datasets, identify shared goals, and work cohesively to optimize performance and reduce mean time to resolution (MTTR).
By combining these operational mechanisms, DEM ensures organizations can maintain high-quality digital experiences for their users while proactively addressing performance challenges.
Components of digital experience monitoring
DEM is built on several key components that deliver a comprehensive view of the user experience. These components provide the data and insights necessary to monitor and optimize the performance of applications, networks, and infrastructure. Here are the essential building blocks of DEM:
- Real user monitoring (RUM):
RUM captures data from actual user interactions with an application or website in real time. It measures page load times, transaction durations, and error rates, offering insights into how users experience the platform. This component is invaluable for identifying pain points in the user journey and uncovering opportunities to enhance engagement. - Synthetic transaction monitoring:
Synthetic monitoring uses simulated user interactions to test critical workflows, such as logging into an account, completing a purchase, or searching for a product. By automating these tests, synthetic monitoring helps IT teams proactively detect issues like slow load times, failed transactions, or outages before they affect real users. - Endpoint monitoring:
Endpoint monitoring tracks the performance of devices and applications used by end users, such as desktops, laptops, and mobile devices. By analyzing factors like application responsiveness, network connectivity, and device health, this component ensures that user-side issues are addressed promptly, minimizing frustration and downtime. - Application performance monitoring (APM):
APM focuses on the performance of the application’s backend components, such as databases, APIs, and servers. It helps IT teams detect code-level issues, optimize application performance, and ensure smooth integration with other systems. - Network monitoring:
Since network performance directly affects the digital experience, DEM includes monitoring network metrics such as latency, bandwidth, and packet loss. This ensures that connectivity issues are identified and resolved to maintain seamless user interactions. - Session replay:
This component records and replays user sessions, allowing IT teams to see how users navigate and interact with digital platforms. Session replay is especially useful for diagnosing complex issues that require context beyond raw data points.
Why customer experience matters
Users don’t know which digital offerings use DEM to improve their experiences.
But they will ditch the ones that don’t.
Consider users in the e-commerce and digital retail space. DEM lets those platforms and websites monitor website performance, transaction times, and user interactions. If any of those experiences are suffering from downtime, disrupted transactions, or delayed user interactions, IT teams can use DEM analysis to identify the cause. They can then implement a solution and prevent a spike in cart abandonment rates while improving conversion rates and customer satisfaction ratings.
Let’s explore a second use case for Software-as-a-Service (SaaS) providers. DEM allows them to track user interactions, application response times, and errors to identify opportunities to enhance the customer experience and retain users (who hopefully tell their networks about the positive experience).
In both scenarios, integrating a DEM-enabled application monitoring solution would speed up the process of pinpointing the users’ pain points, diagnosing the root cause, and enabling IT teams to collaboratively solve the problem faster than they could without DEM insights.
Benefits of DEM
DEM-driven insights provide a variety of benefits to organizations looking for data-based strategies to help optimize their resources (both human and financial).
Enhanced user satisfaction
Organizations that monitor user experience metrics, such as page load times, transaction response times, and user interactions, can use this information to prioritize addressing the issues that have the most sway in user satisfaction. Proactively identifying and fixing those high-impact problems will result in higher engagement rates and increased customer loyalty.
Improved performance optimization
The holistic presentation of the end-to-end experience (application, network, and infrastructure performance) enables organizations to identify performance bottlenecks, diagnose issues, and prioritize areas for improvement faster than the competition ruled by an APM solution alone. Leveraging these insights lets IT teams optimize their applications and websites, resulting in faster load times, smoother interactions, and better overall performance.
Data-driven decision making
IT teams can know the solutions they are working on are backed by data that came from the users they are trying to impress. DEM helps developers uncover trends, patterns, and areas of improvement so those teams can prioritize resources to deliver an improved user experience effectively.
Drawbacks of DEM
Before investing, organizations need to consider some of the complexities they are signing up for when they deploy DEM capabilities in their monitoring solution.
Implementation complexity
For large or complex digital environments, integrating various monitoring techniques, tools, and systems may require upskilling or hiring the expertise needed for a successful implementation. In addition to configuring and fine-tuning the monitoring setup, ongoing maintenance and management of DEM can be a long-term investment.
Data volume challenges
DEM generates vast amounts of monitoring data, which can be overwhelming to process and analyze effectively. Organizations need to have robust data management and analysis capabilities already in place to sort through the onslaught of data, as well as a process in place for converting it into actionable insights for IT teams.
Resource considerations
Integrating and maintaining a DEM solution may require financial and resource investments ranging from procuring monitoring tools to hiring skilled personnel. Ongoing data analysis efforts may require long-term resource allocation.
Despite these drawbacks, many organizations will want to harness the benefits of DEM, as they outweigh the challenges.
Developing a digital experience monitoring strategy
Establishing an effective DEM strategy is essential for enhancing user satisfaction and business outcomes. A well-defined approach ensures that DEM integrates seamlessly with existing processes while delivering actionable insights. Here are the key steps to building a robust DEM strategy:
- Start with user-centric goals:
Define objectives that focus on improving the user experience. This includes reducing page load times, minimizing transaction errors, and ensuring seamless navigation. A user-centric approach aligns IT teams with what matters most—satisfaction and retention. - Leverage real-time analytics:
Enable real-time data collection and analysis to identify and resolve issues as they occur. This proactive monitoring approach minimizes downtime and ensures that problems are addressed before they impact users. - Integrate across tools and teams:
Ensure your DEM solution integrates with other monitoring tools, such as application performance monitoring (APM), network monitoring, and log management systems. This creates a unified view of the digital ecosystem, fostering cross-team collaboration between DevOps, ITOps, and other stakeholders. - Prioritize key metrics:
Identify and track metrics directly influencing the digital experience, such as transaction response times, error rates, and network latency. Tailor these metrics to your industry and use case to ensure relevance and accuracy. - Adopt synthetic monitoring:
Incorporate synthetic transaction monitoring to test critical workflows and identify issues before they reach end users. This proactive testing complements real user monitoring and strengthens overall system reliability. - Establish a feedback loop:
Create a process for continuously evaluating the effectiveness of your DEM strategy. Use insights from monitoring data to make iterative improvements, such as optimizing application code, upgrading network infrastructure, or refining user interfaces. - Communicate insights effectively:
Provide tailored dashboards and reports for different teams. For instance, technical teams may need granular data, while business teams benefit from high-level KPIs. Ensuring clarity in communication helps align efforts across the organization.
Not all DEM-enabled solutions are the same
Selecting the right APM is about more than the list of capabilities. The first consideration should be how a new DEM-enabled APM solution will complement any existing monitoring solutions.
Integration and compatibility
It is essential to evaluate how well the DEM-enabled APM solution integrates with your existing monitoring ecosystem. Consider whether it can seamlessly integrate with other monitoring tools and systems you rely on, such as application performance monitoring (APM) tools, log management, network monitoring, network performance diagnostics, or cloud monitoring platforms. Compatibility between the DEM-enabled APM solution and your existing infrastructure ensures smooth data aggregation, correlation, and analysis.
Scalability and flexibility
Consider whether the DEM-enabled APM solution can scale as your digital infrastructure grows and evolves. It should be able to handle increasing data volumes, monitor diverse applications and services, and adapt to changing technology stacks. Additionally, assess the flexibility of the solution in terms of customization and configuration to align with your specific monitoring requirements.
Context and correlation
An APM solution should provide DevOps and ITOps with context and correlation within observability platforms to manage application performance and gain digital experience insight across hybrid and multi-cloud environments to allow for cross-team collaboration. By proactively sharing those insights into the digital experience, both teams can own the solutions that enhance user satisfaction, increase productivity, and drive better business outcomes.
How LogicMonitor can help
If DEM is a measure of how much an organization values its users’ experiences, then LogicMonitor’s Application Performance Monitoring solution is how organizations show they’re serious about improving the processes and technologies that ensure their operations don’t just meet – but they exceed – users’ expectations.
OpenTelemetry integration monitors end-to-end application requests through distributed services in your existing environment.
Performance metrics capabilities can graph everything from high-level KPIs to granular technical metrics, visualizing business outcomes for the teams that need to deliver them.
Synthetic monitoring brings solution theories to life before users can test them in real time. This capability simulates end-user traffic through automated browser tests of user interactions or transactions, giving early insights into the quality of the end-user experience.
The collaboration challenges of remote work
A key conversation topic that repeatedly comes up with our customers is the challenge of collaboration in a remote work environment. Too many channels of communication or documentation are ineffective, and IT professionals are starting to feel fatigued by never feeling quite “in the know” about business decisions that are happening in real-time. Collaboration platforms such as MS Teams and Slack are intended to be solutions for these challenges, yet finding the right fit requires careful consideration. When separated from colleagues, teams can feel distant and unmotivated or find it hard to stay focused. Below, we have outlined Zoom vs. Slack vs. Teams, and some of the most common team collaboration tools teams use to communicate effectively and, ultimately, find balance in a work-from-home lifestyle.
Best online collaboration tools for IT teams
IT professionals have favorite collaboration tools, and recent data highlights their preferences. Each company tracks its statistics differently. While Microsoft hasn’t yet publicly disclosed the exact number of daily meetings conducted, Teams reports up to 5 billion meeting minutes in a single day. It remains a go-to platform for organizations already immersed in the Microsoft ecosystem. With its user-friendly interface and top-notch video quality, Zoom reports 300 million daily active users as of 2024, making it a favorite for virtual meetings. With its robust messaging capabilities and extensive integrations, Slack enjoys a more modest market share, with 32.3 million active users on average each day, catering to teams that prioritize real-time communication.
Unsurprisingly, many organizations mix and match these tools to fit their specific needs, using each where it works best to keep everything running smoothly and strengthen IT business continuity.
Microsoft Teams
Microsoft Teams was the most common response, but what is MS Teams? MS Teams is a chat-based collaboration tool that allows organizations to work together and share information in a common space. It’s part of Microsoft’s robust 365 product suite and offers a range of features that make it stand out for many users.
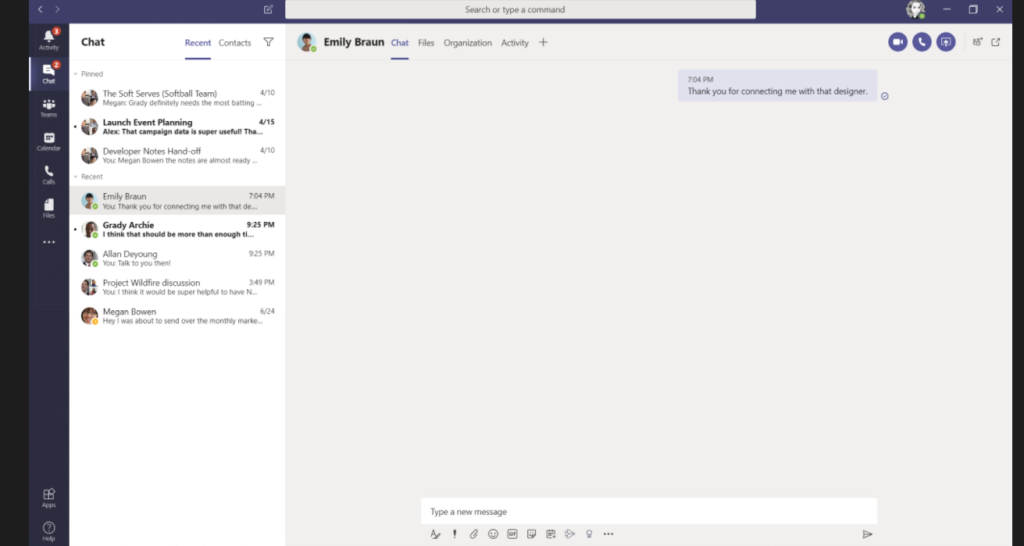
Public and private chat is a core feature, and with the absorption of Skype for Business, Teams offers integrated video capabilities, including popular social features like emojis and custom memes.
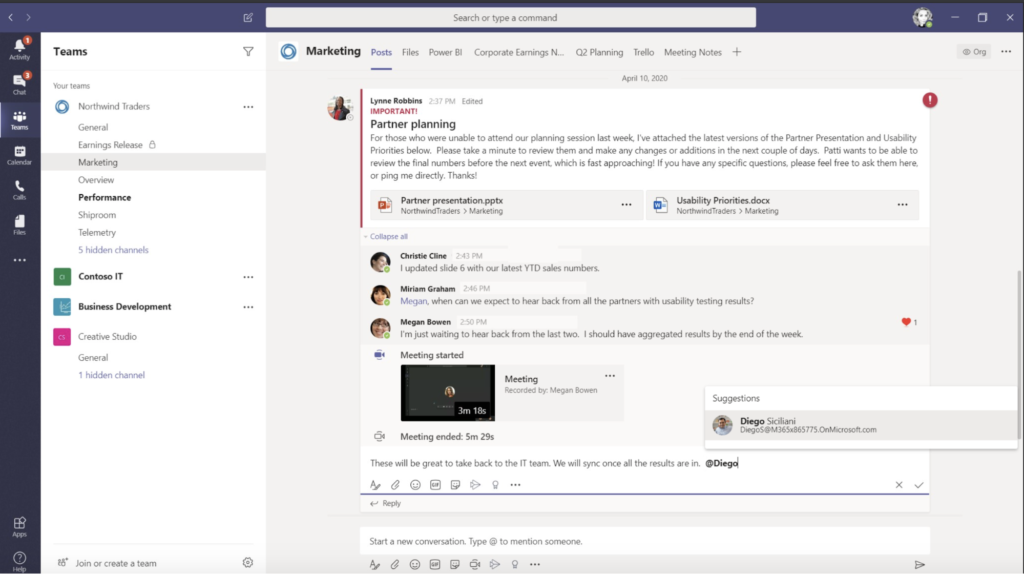
‘Hub’ is another important capability that offers a shared workspace for various Microsoft Office applications such as PowerPoint, Word, Excel, Planner, OneNote, SharePoint, and Power BI. Delve was once an integrated tool, but most of its features have been absorbed into Microsoft 365’s broader capabilities. Teams can remotely work together in one space without toggling between applications.
The users of Microsoft Teams that we polled recognized the ability to share documents across multiple locations and chat across multiple offices as the tool’s most widely used application. They also acknowledged the options for screen sharing or whiteboards.
Video conferencing and online meetings can include anyone outside or inside a business and are also important features of the tool. However, many offices use online video calling and screen sharing internally, as well as other tools, such as Zoom, for externally facing meetings.
As IT organizations implement a collaboration tool like MS Teams, the ability to deliver monitoring alerts directly into the MS Teams chat is a common need (LogicMonitor can utilize the Microsoft Teams API to deliver alerts via a custom HTTP integration). Monitoring user activity, quality of calls, private messages, team messages, and types of devices is also important.
Looking ahead, LogicMonitor will take a more cloud-based approach to monitoring MS Teams to pull important data, such as call quality metrics. Stay up to date by subscribing to our release notes.
At the end of the day, if a company uses Microsoft 365, MS Teams is probably a good collaboration solution. It is included for free with Office 365 and can be easily accessed through 365’s centralized management console.
Microsoft Teams vs. Zoom
Zoom remains one of the most commonly used video conferencing tools, valued for its ease of use, reliable video quality, and popularity in externally facing communication. While both Zoom and Microsoft Teams enable video conferencing, private and public chat, virtual meeting spaces, screen sharing, and file sharing, Microsoft Teams stands out as part of the Microsoft 365 suite and continues to expand its capabilities with AI-powered tools like Microsoft Copilot. This makes Teams a one-stop shop for organizations already using Microsoft’s tools, though it may be less accessible to participants outside the organization than Zoom’s simpler setup process.
Both platforms have made significant advancements in security. Microsoft Teams provides end-to-end encryption for data in transit and at rest, along with multi-factor authentication and Rights Management Services to safeguard sensitive information. Zoom has introduced robust security measures, including end-to-end encryption for meetings, enhanced data privacy controls, and user-friendly security dashboards. Its refined two-factor authentication (2FA) provides flexibility, allowing users to verify identities through authentication apps or SMS codes while ensuring alternative available methods if needed.
Both Microsoft Teams and Zoom offer free versions with optional paid upgrades at competitive per-user rates. The choice between the two ultimately depends on your organization’s specific needs. Many businesses find value in using both tools—leveraging MS Teams internally for collaboration and Zoom externally for virtual meetings. Their integration capabilities further enhance workflow efficiencies, ensuring teams can use the right tool for every scenario.
LogicMonitor offers out-of-the-box monitoring for Zoom to further optimize your collaboration tools, compatible with any Zoom account. Learn more about our Zoom monitoring.
Microsoft Teams vs. Slack
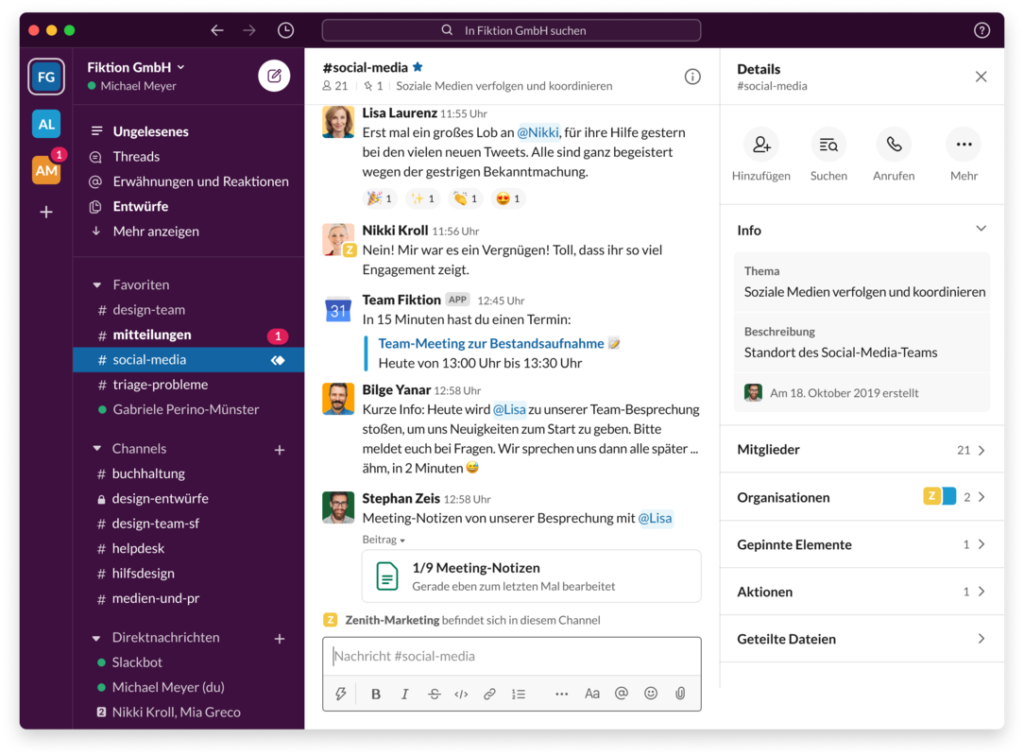
Slack is a fun and easy-to-use chat and channel-based messaging platform developed by Salesforce. Slack shines with its bot and app integrations, improving the user’s workplace experience. Onboarding is easy, and there are shortcuts and productivity hacks for just about anything. In terms of features, both MS Teams and Slack are fairly evenly matched. Both offer private and public chat, searchable message history, screen sharing, file sharing, and fun integrations to generate gifs and memes. Both offer free versions of their platform, with upgraded features and integrations on paid plans.
MS Teams beats Slack when it comes to online audio and video sharing and also wins out where security and compliance are of concern. Not only does Microsoft’s data encryption and compliance come into play, but the admin controls are more extensive than any other platform.
We recently updated our Slack integration, and it’s now bidirectional.
Zoom vs. Slack
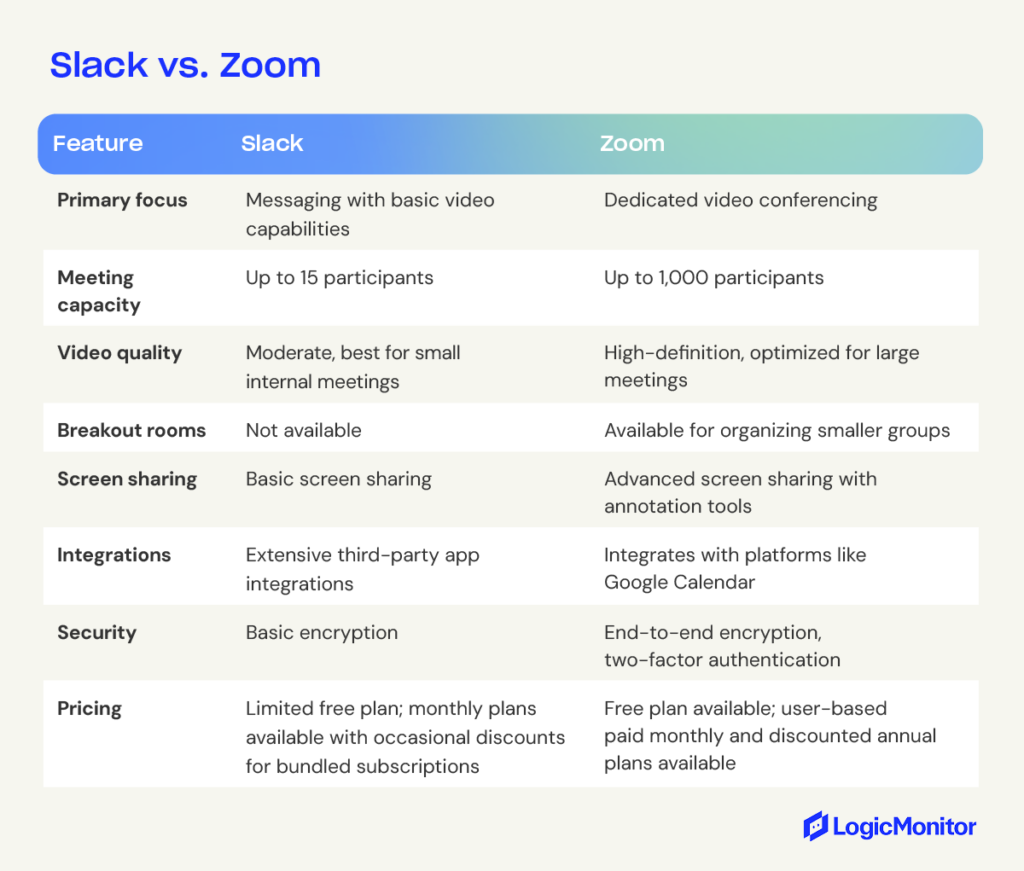
Slack and Zoom are both cloud-based collaboration tools. Slack excels at team messaging and integrations, while Zoom specializes in high-quality video conferencing. Each platform caters to distinct communication needs, making them suited for different teams and projects.
Slack is a powerhouse for team messaging and integrations, offering robust real-time communication. It organizes conversations into channels, simplifying collaboration on specific projects. While its video calls are limited in functionality and best suited for smaller team discussions, Slack excels in messaging-based capabilities. It also supports integrations with third-party tools like Google Drive. Features such as pinned messages, customizable notifications, and emoji reactions enhance its usability for day-to-day collaboration.
Zoom specializes in high-quality video conferencing, offering a smooth, reliable experience for any size group. Its key features include HD video and audio, breakout rooms, virtual backgrounds, and whiteboard functionality. These capabilities make Zoom a go-to for presentations, team meetings, and webinars. While Zoom has a functional chat feature, Slack’s is more robust.
For many organizations, Zoom complements messaging platforms like Slack to create a complete collaboration suite. Teams might use Slack for daily messaging and collaboration while relying on Zoom for high-quality virtual meetings. Both platforms offer free versions, making evaluating their fit for your team’s needs easy.
Other collaboration tools to consider
Google Workspace has its own collaboration tool, Google Meet. In the same way that MS Teams is available right from 365, Google Meet is available to any business or individual with Gmail or a Workspace account. However, some features, such as recording meetings or exceeding the 60-minute mark, are reserved for paid plans. If your business already has Google Workspace, Google Meet is a great solution; some find it slightly easier to use than MS Teams.
Cisco Webex is also a leader in online meetings and video conferencing solutions. It has features similar to MS Teams, Google Meet, and Zoom, such as one-to-one or group conferencing, file sharing, and a vast library of integrations. The security features are robust, and there are a variety of protection tools to keep data safe. Learn more about LogicMonitor’s Webex monitoring capabilities.
Trello, Asana, and Monday are all popular project management applications most commonly used in marketing, customer support, sales, and HR. They allow teams to create, track, and manage complex workflows in a centralized hub and are often used in tandem with some of the video, chat, and file-sharing tools discussed above.
Using more than one collaboration tool
Work environments have changed dramatically in recent years. As organizations rely more on remote and hybrid work environments, it makes sense for them to take advantage of multiple collaboration tools to meet diverse needs.
Different platforms excel in specific areas, offering distinct advantages that make them ideal for certain workflows. For example, many teams use Slack for internal messaging and quick collaboration paired with Zoom for virtual meetings, then turn to Google Workspace for email, calendar management, and file sharing. This multi-tool approach provides teams with IT resources to tackle various aspects of their work seamlessly. Discover how LogicMonitor supports remote monitoring to enhance IT workflows.
LogicMonitor embraces this strategy by utilizing Slack for internal chat. We rely on Google Workspace for scheduling and document sharing, while preferring Zoom for internal and external video calls. This combination lets teams leverage the strengths of each platform, staying productive and maintaining a collaborative culture without compromise.
Choosing the right combination depends on your organization’s size, budget, and specific requirements. By exploring different tools and identifying the best fit for your workflows, you can empower your teams to stay connected and productive. Explore integrations with LogicMonitor to enhance your collaboration stack and support your business needs.
How to maximize value with Jira and AWS Lambda integration
One of our engineers on the TechOps team coined the term “Value++.” It references the shorthand operator for “increment” in various coding languages. It is also a motto for what we should be doing as a team—always adding value.
Here are a few things in our day-to-day operations that have been a serious “value –”
- Answering JIRA tickets that have no description
- “Customer has issue B,” but both the customer name and issue details are omitted from that sentence
- Doing things manually, over and over again
At LogicMonitor, most of the tasks requested of the TechOps team come in the form of JIRA tickets. A new application may be ready for deployment, or a customer account may require a rename. We also have to deal with operational tasks like moving new customer accounts from demo to production environments.
Because LogicMonitor is rapidly growing, we always try to be more efficient by automating ourselves out of work. We decided to automate parts of our DevOps tasks through AWS Lambda functions, API calls, and JIRA tickets. This allows the team to keep track of existing tasks that show up in our queue and spend their time doing more important things.
It’s “Value ++.”
Understanding projects and issue types for automation
We first had to lock down specific JIRA projects and issue types to differentiate tasks from other items, creating a separate issue type for every task we wanted to automate. This makes things easy to organize and allows us to lock down who can or cannot make specific tickets.
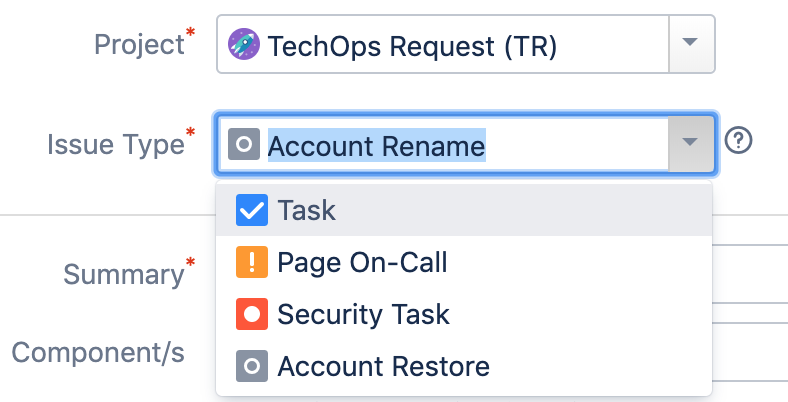
In this blog, we’ll go over one of our simpler use cases: automatically performing an account rename.
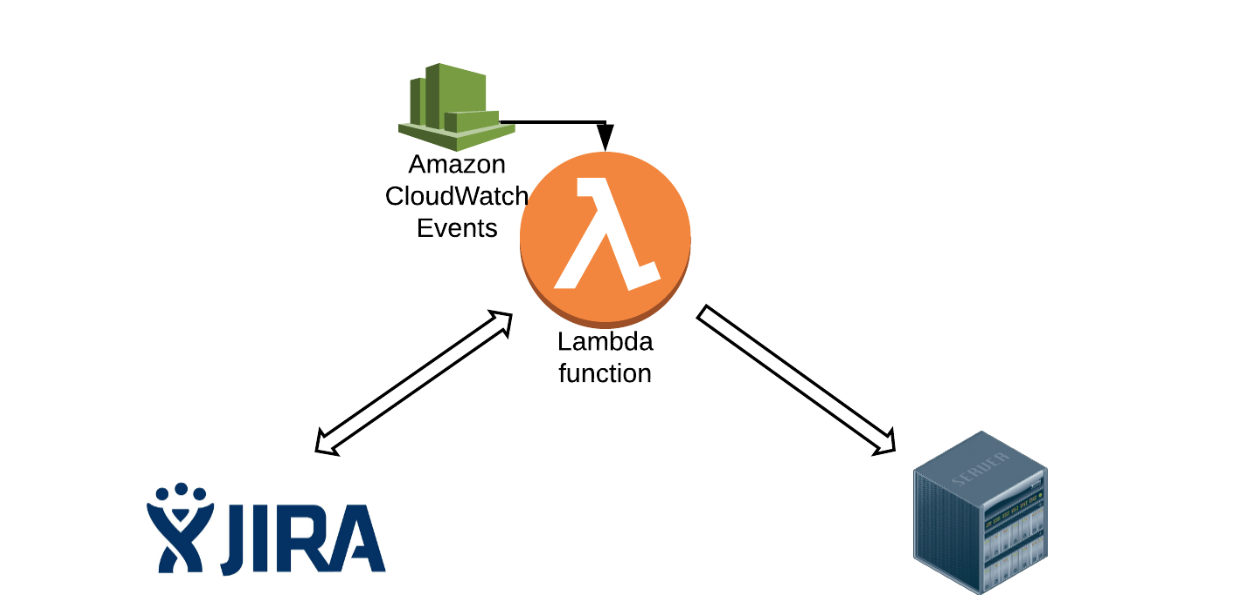
Streamlining workflows with straightforward solutions: The simple stupid
This crude Lucidchart (below) shows the basics of what we did. Every 5 minutes, a CloudWatch Event rule triggers a Lambda function. The function will make a JIRA API call to retrieve a list of tickets. Using those tickets, we will grab the necessary information and make subsequent API calls to backend services within LogicMonitor to perform specific actions, such as renames. Lambda will also actively update and close the tickets upon task completion. The first thing we need to do is know what tickets to look for.
Executing JQL queries directly from AWS Lambda
JIRA Query Language (JQL) is one of the most flexible ways to search for issues in JIRA. We use a JQL query with the JIRA REST API to find specific open tickets with issue types of “account rename.” This should return a list of associated tickets.
    endpoint      = "https://jira_url/rest/api"
    jql_issuetype = "issuetype='Account Rename'"
    jql_project   = "project='TechOps Request'"
    status        = "status=Open"
    jql           = ("jql="  + jql_project +
                     "+AND+" + jql_issuetype +
                     "+AND+" + status
                     )
    r = session.get(endpoint + "/2/search?" + jql % locals(), headers=headers_jira)
    response = json.loads(r.text)
    for issues in response["issues"]:
      customer    = issues["fields"]["customfield_10001"]
      target_name = issues["fields"]["customfield_14673"]
Taking the list of open tickets, we need to be able to glean important information out of them, some of them in the form of custom fields.
Customizing workflows with Jira’s custom fields
Users create custom fields, which are not by default available in JIRA. For our specific use case, we created a few fields, such as customer name, target name, and rename date. From the code example above, you can see that within the JIRA API, you can not specify just the field’s name; you’ll need to add a customfield_id.
Pro tip:
If you don’t want to look at a page of ugly JSON, you can also use the advanced JIRA search bar and type in the field’s name.

Embracing event-driven automation with AWS Lambda… most of the time
Usually, when we build apps on Lambda, we have components like Lambda functions and event sources. An event source is an AWS service that publishes events for processing by code within a Lambda function. In this case, performing a rename upon JIRA ticket creation could have been handled with a post function and an API Gateway. However, customers have their own maintenance windows and preferred times for an account rename to happen. Sometimes, customers may want their account renamed on Saturday at 4 a.m. during my personal maintenance (sleep) window. As a workaround, we decided to use a CloudWatch event as a lambda scheduler.

today = datetime.datetime.today() - datetime.timedelta(hours=7)
     desired_date = datetime.datetime.strptime(issues["fields"]["customfield_16105"].replace("-0700",""), "%Y-%m-%dT%H:%M:%S.%f")
     if today > desired_date:
      create_rename(customer, target_name)
Our CloudWatch event would run every 5 minutes, triggering our Lambda function. The function will first check if the current time exceeds the value we parsed from the custom field rename date (see code above), and then we will allow the function to continue.
Combining tools to create seamless automation
At this point, we have collected the information we need. We can perform the rename by making API calls to the backend LogicMonitor services, but we won’t show that code in this blog. However, we also want to treat the JIRA ticket as a state file. We don’t want to keep grabbing the same open tickets repeatedly. This is where we want to use another JIRA API call to move the ticket to a different workflow step (e.g., from “Open” to “In Progress”). However, just like custom fields, we need a specific transition id, which you can find by editing your existing project workflow. We can now update the status of our JIRA ticket programmatically:
def changeStatus(key, id):
    jira_request = {"transition":{"id": id }, "fields": {"resolution": {"name": "Done"}}}
    endpoint = "https://jira_url.com/rest/api"
    r = session.post(endpoint + "/2/issue/%(key)s/transitions?expand=transitions.fields" % locals(), data=json.dumps(jira_request), headers=headers_jira)
    return r.text
Reducing human errors through intelligent automation: Saving people from people
Customer renames for the team used to be an extremely arduous task. Looking back at the Confluence revision history for our account rename runbook is akin to cleaning out your basement after 20 years. Besides being extremely time-consuming, the process involved halting puppets and, for unknown reasons, executing both a Ruby and a Bash script simultaneously. Sometimes, an application restart was required, but it was not always. As we grow, the only scalable solution is to automate repetitive, manual, and often mind-boggling tasks. It allows us to provide better service for customers and allows us to bypass the mundane to embrace the innovative.
One last tip—and this is the most important part—when we want to automate anything that requires manual input from other people, we have to take human stupidity… uh… error into consideration. Make sure to create validators and conditionals to combat this.
Plus, witty warning messages are a “value++.”

IT automation uses software and technology to handle repetitive IT tasks automatically, reducing the need for manual work and accelerating processes like infrastructure management and application deployment. This transformation is essential for IT teams needing to scale efficiently, as seen in the case of Sogeti, a Managed Service Provider (MSP) that provides tech and engineering resources worldwide.
Sogeti had a crucial IT challenge to solve. The MSP operates in more than 100 locations globally and uses six different monitoring tools to monitor its customers’ environments. It was a classic example of tool sprawl and needing to scale where multiple teams of engineers relied on too many disparate tools to manage their customers’ environments. It soon became too arduous for the service provider to collect, integrate, and analyze the data from those tools.
Sogeti had teams of technicians managing different technologies, and they all existed in silos. But what if there was a way to combine those resources?
IT automation provided a solution.
After working with LogicMonitor, Sogeti replaced the bulk of its repeatable internal processes with automated systems and sequences. The result? Now, they could continue to scale their business with a view of those processes from a single pane of glass.
Conundrum cracked.
That’s just one example of how IT automation tools completely revolutionizes how an IT services company like an MSP or DevOps vendor can better execute its day-to-day responsibilities.
By automating repeatable, manual processes, IT enterprises streamline even the most complicated workflows, tasks, and batch processes. No human intervention is required. All it takes is the right tech to do it so IT teams can focus on more strategic, high-priority efforts.
But what exactly is IT automation? How does it work? What are the different types? Why should IT companies even care?
IT automation, explained
IT automation is the creation of repeated software processes to reduce or eliminate manual or human-initiated IT tasks. It allows IT companies with MSPs, DevOps teams, and ITOps teams to automate jobs, save time, and free up resources.
IT automation takes many forms but almost always involves software that triggers a repeated sequence of events to solve common business problems—for example, automating a file transfer. It moves from one system to another without human intervention or autogenerates network performance reports.
Almost all medium and large-sized IT-focused organizations use some automation to facilitate system and software processes, and smaller companies benefit from this tech, too. The most successful ones invest heavily in the latest tools and tech to automate an incredible range of tasks and processes to scale their business.
The production, agricultural, and manufacturing sectors were the first industries to adopt IT automation. However, this technology has since extended to niches such as healthcare, finance, retail, marketing, services, and more. Now, IT-orientated companies like MSPs and enterprise vendors can incorporate automation into their workflows and grow their businesses exponentially.
How does IT automation work?
The software does all the hard work. Clever programs automate tasks that humans lack the time or resources to complete themselves.
Developers code these programs to execute a sequence of instructions that trigger specific events from specific operating systems at specific times. For example, programming software so customer data from a customer relationship management system (CRM) generates a report every morning at 9 a.m. Users of those programs can then customize instructions based on their business requirements.
With so many benefits of IT automation, it’s no wonder that two-thirds of CFOs plan to accelerate the automation of repetitive tasks within their companies.
Why do businesses use IT automation?
IT-focused businesses use automation for various reasons:
- It makes life easier for tech teams. For example, engineers and technicians at MSP companies no longer have to execute tasks like network performance analysis, data security management, or reporting manually. The software takes care of everything for them so they can better focus their efforts on other tasks.
- It makes life easier for non-tech teams. Employees across all departments within an IT-focused organization benefit from automation because they can carry out responsibilities on software and systems with less manual work. For example, administrative employees in a DevOps consulting firm can generate payroll reports without manually entering information into a computer by hand.
- It helps CIOs and executives scale their businesses because other employees, such as engineers and MSP professionals, can complete jobs with minimum effort. Automation frees up tech resources and removes as much manual IT work as possible, allowing IT-centered organizations to improve their margins and grow.
- It helps CIOs and executives fulfill client-orientated objectives by improving service delivery. Automation can also advance productivity across an organization, which results in better service level agreement (SLA) outcomes. Again, the right automation software reduces as much manual work for tech teams so businesses can grow and carry out responsibilities more efficiently.
- It allows MSPs and other IT companies, especially smaller ones, to survive in ever-competitive environments. By automating IT processes, these enterprises can stay competitive with more tech resources and reduced manual labor.
- It allows for improved profitability in IT companies. For example, MSPs can onboard more clients without hiring new engineers. That’s because automated systems delegate tasks and resources seamlessly.
- It reduces costs for IT companies by saving time and improving operational efficiencies. For example, by freeing up human resources, enterprises can focus on generating more sales and revenue. As a result, CIOs and executives have more money to spend on labor and can add highly skilled IT professionals to their tech teams.
Key benefits of IT automation
IT automation delivers many advantages that extend beyond simple task delegation. Let’s look at a few benefits your organization will see.
Enhanced organizational efficiency
With the complexity of modern IT infrastructure, modern environments may handle thousands of requests daily—everything from password resets to system failures. Automation can help reduce the time it takes to handle many of those requests. For example, look at an IT telecommunications company with a lot of infrastructure. They can automate their network configuration process, cutting the deployment time from a few weeks to less than a day.
Reduce errors
Human error in IT environments can be costly. Errors can lead to unexpected system downtime, security breaches, and data entry errors—all of which you can avoid by standardizing consistency and standards through automation. Automation helps your team eliminate routine data entry and other tasks and greatly reduces the chance of human error. For example, your team may decide to create backup scripts for more complicated setups to ensure you always have reliable backups.
Faster service delivery
Automation helps speed up responses to common IT requests. If your IT team is stuck needing to perform every task manually, it increases incident response time and the length of time your customer waits on the other end of the line for a fix. Automation speeds up common tasks—setting up VPN access, account resets, report creation, and security scans—allowing your team to focus on finding the root cause of problems, deploying resources, and bringing systems back online.
Streamlined resource allocation
Your organization’s IT needs may fluctuate depending on how many users you have and their activities. A strict guide for resource usage may result in some users being unable to work efficiently because of slow systems. Automation can help by automating resource allocation. For cloud services, you can scale your servers based on demand, and for network traffic, you can dynamically adjust traffic routes based on usage.
Enhanced compliance and security
Automated systems can help your team maintain detailed audit trails and enforce consistent security policies. They can also help with continuous monitoring, allowing your team to get alerts immediately when your solution detects suspicious activity. Additionally, your IT systems can automatically generate compliance reports, such as SOC 2, for review, helping your team find potential problems and comply with audit requests.
Different IT automation types
IT companies benefit from various types of IT automation.
Artificial intelligence
A branch of computer science concerned with developing machines that automate repeatable processes across industries. In an IT-specific context, artificial intelligence (AI) automates repetitive jobs for engineers and IT staff, reduces the human error associated with manual labor, and allows companies to carry out tasks 24 hours a day.
Machine learning
Machine learning (ML) is a type of AI that uses algorithms and statistics to find real-time trends in data. This intelligence proves valuable for MSPs, DevOps, and ITOps companies. Employees can stay agile and discover context-specific patterns over a wide range of IT environments while significantly reducing the need for case-by-case investigations.
Robot process automation
Robot Process Automation (RPA) is a technology that instructs ‘robots’ (machines) to emulate various human actions. Although less common in IT environments than in AI and ML, RPA still provides value for MSPs and other professionals. For example, enterprises can use RPA to manage servers, data centers, and other physical infrastructure.
Infrastructure automation
IT infrastructure automation involves using tools and scripts to manage computing resource provisioning with manual intervention. This includes tasks like server provisioning, bandwidth management, and storage allocation. This allows for dynamic resource usage, with the most resources going to the users and applications with the most need.
How can businesses use IT automation?
A proper automation strategy is critical for IT companies. CIOs and executives should decide how to achieve automation within their organizations and then choose the right tools and technologies that facilitate these objectives.
Doing so will benefit your business in many ways.
- Improve your company’s operation by removing redundant tasks and freeing up time to work on more mission-critical jobs
- Enhance customer satisfaction by more quickly responding and resolving problems
- Improve employee satisfaction by making sure business systems stay online, helping meet their expectations and improving their ability to do their jobs
Here are some examples of how IT companies use automation:
Templating/blueprints
Companies can automate templates and blueprints, promoting the successful rollout of services such as network security and data center administration.
Workflow/technology integration
Automation allows companies to integrate technology with workflows. As a result, CIOs and executives complete day-to-day tasks more effectively with the latest hardware and software. For example, automating server management to improve service level management workflows proves useful if clients expect a particular amount of uptime from an MSP.
AI/ML integration
AI and ML might be hard for some companies to grasp at first. However, teams can learn these technologies over time and eventually combine them for even more effective automation within their organizations.
Auto-discovery
Automated applications like the LogicMonitor Collector, which runs on Linux or Windows servers within an organization’s infrastructure, use monitoring protocols to track processes without manual configuration. Users discover network changes and network asset changes automatically.
Auto-scaling
IT companies can monitor components like device clusters or a VM in a public cloud and scale resources up or down as necessary.
Automated remediation/problem resolution
Hardware and software can provide companies like MSPs with all kinds of problems (downtime, system errors, security vulnerabilities, alert storms, etc.). Automation, however, identifies and resolves infrastructure and system issues with little or no human effort.
Performance monitoring and reporting
Automation can automatically generate regular performance reports, SLA reports, compliance reports, and capacity planning forecasts. It can also generate automated alerting systems in case of problems and report trends to help your business with capacity planning.
Best practices for automation success
Successfully automating IT in business requires careful planning and thoughtful execution. Follow these best practices to avoid the common mistakes and maximize efficiency:
- Align automation and business goals: Don’t just start automating everything possible without a plan. Begin by identifying what you want to achieve with automation. Look for areas to reduce operational costs, improve service, and enhance customer satisfaction, and start with the areas that have the most impact and help you reach your goals. Consider asking stakeholders and employees about their biggest friction points and the ability to automate them.
- Start small: Investing in IT automation is an ongoing task, and you may not do things right the first time. Start small with quick wins. Learn what works for your business and pilot your initial automation tasks to test how they work. Eventually, begin scaling as you gain insights from smaller projects to inform larger, more impactful ones.
- Focus on security: Although your team may not be working with data manually as much, security is still a must with IT automation. Integrate secure protocols at every layer of your systems and processes. Look at your regulatory requirements to determine your needs, and regularly audit your systems to identify potential weaknesses.
- Document everything: If things go wrong, you need detailed records about your automation process. Create documents that detail every system, automation tools and scripts that belong to those systems, and common troubleshooting tips for quickly dealing with problems. Make documentation available to team members so all your team members can look up how things work and manage their designated automation systems.
- Monitor performance: Establish metrics that indicate the success of your automation efforts. Look for improvements in uptime, response time, and other performance data. Regularly look for areas that don’t meet your performance metrics and investigate areas of improvement.
IT Automation Pros and Cons
Here are some pros and cons of automation for those working in IT:
Pros
- Enhanced productivity (improved workflows, higher production rates, better use of technologies and human resources, freeing up IT resources, etc.).
- Better customer/client outcomes (improved SLAs, faster and more consistent services, higher-quality outputs, enhanced business relationships, etc.).
- Reduced total cost of ownership (auto-discovery tools prevent expensive errors, freeing up labor resources, automatic discovery of cost-cutting technologies, etc.).
Cons
- Automation requires an initial cost investment and engineers’ time to set up. That’s why IT-focused companies should choose a cost-effective automation platform that generates an ongoing return on investment.
- Some team members may find it difficult to adopt automation technologies. The best course of action is to select a simplified automation tool.
- Automation may amplify security issues. Software and configuration vulnerabilities can quickly spread in your organization before being detected, which means security considerations and testing must be done before introducing automation.
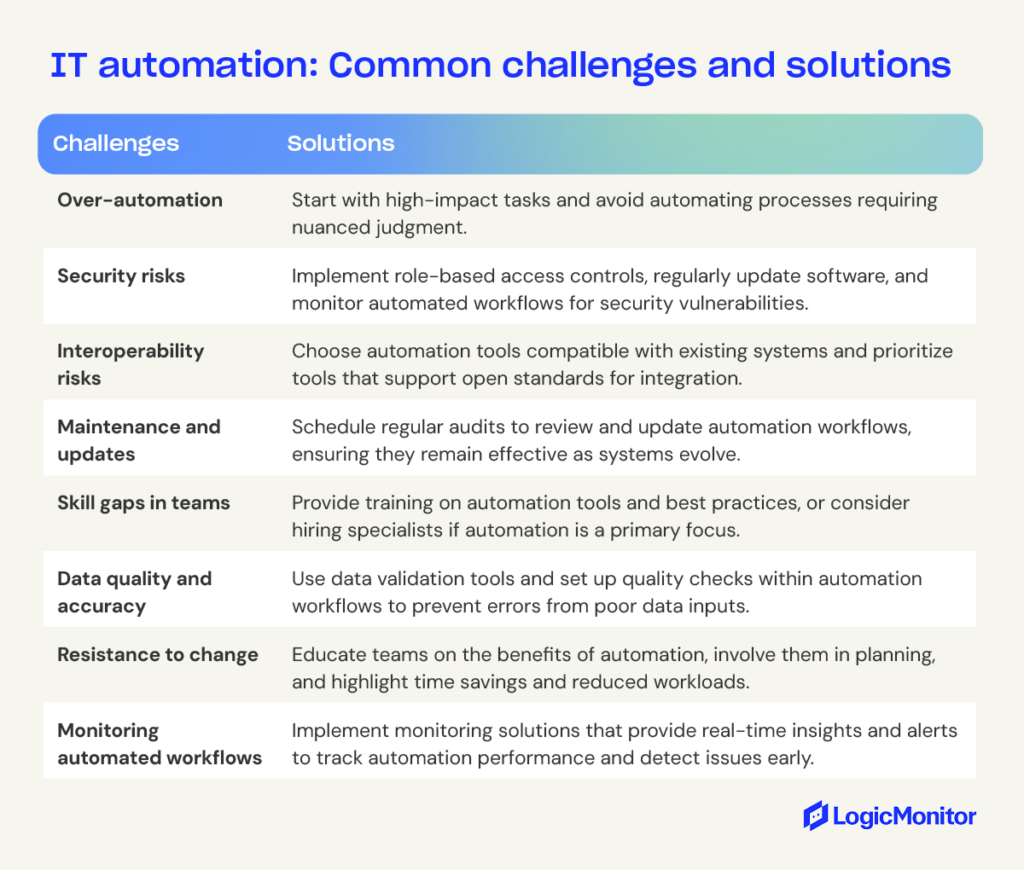
Read more: The Leading Hybrid Observability Powered by AI Platform for MSPs
Will IT automation replace jobs?
There’s a misconception that IT automation will cause job losses. While this might prove true for some sectors, such as manufacturing, IT-focused companies have little to worry about. That’s because automation tools don’t work in silos. Skilled IT professionals need to customize automation tools based on organizational requirements and client demands. MSPs that use ML, for example, need to define and determine the algorithms that identify real-time trends in data. ML models might generate data trends automatically, but MSPs still need to select the data sets that feed those models.
Even if automation takes over the responsibilities of a specific team member within an IT organization, executives can upskill or reskill that employee instead of replacing them. According to LogicMonitor’s Future of the MSP Industry Research Report, 95% of MSP leaders agree that automation is the key to helping businesses achieve strategic goals and innovation. By training employees who currently carry out manual tasks, executives can develop a stronger, higher-skilled workforce that still benefits from IT automation.
Future of IT automation
AI, machine learning, and cloud computing advancements are significantly altering how businesses manage their IT infrastructure. As these technologies continue to evolve, how you manage your business will change along with them.
Here’s what to expect in the future of IT automation:
Intelligent automation
Traditional automation tools use a rules-based approach: a certain event (e.g., time of day, hardware failure, log events) triggers an action through the automation systems.
Advanced AI operations tools are changing that with their ability to predict future events based on data. That leads to more intelligent automation that doesn’t require a rules-based system. These systems understand natural language, recognize patterns, and make decisions based on real-time data. They allow for more responsive IT systems that anticipate and fix problems.
Hybrid cloud automation
The growing adoption of cloud environments—which include private, public, and on-prem resources—requires your business to adopt new strategies to manage infrastructure and automate tasks. You need tools that seamlessly integrate with all environments to ensure performance and compliance where the data resides.
Hybrid environments also allow for more flexibility and scalability for IT infrastructure. Instead of being limited by physical constraints, your business can use the cloud to scale computing resources as much as needed. Automated provisioning and deployment means you can do this at scale with minimal IT resources.
Edge computing automation
As workforces and companies become more distributed, your business needs a way to provide resources to customers and employees in different regions. This may mean a web service for customers or a way for employees to access business services.
Edge devices can help supply resources. Automation will help your business manage edge devices, process data on the edge, and ensure you offer performant applications to customers and employees who need them.
Choosing the right IT automation platform
Successful data-driven IT teams require technology that scales as their business does, providing CIOs and executives with ongoing value. LogicMonitor is the world’s only cloud-based hybrid infrastructure monitoring platform that automates tasks for IT service companies like MSPs.
LogicMonitor features include:
- An all-in-one monitoring platform that revolutionizes digital transformation for MSPs and DevOps/ITOps teams worldwide.
- Complete 360-degree visibility of utilization, network performance, resource consumption, cloud instances, and much more.
- Full observability of technologies and resources such as servers, data centers, and cloud-based environments.
- The ability to identify problems with legacy tools before they happen.
- Real-time reports and forecasts that reduce internal costs, improve SLA outcomes, and power engineers and other IT professionals.
- No additional hardware maintenance or technical resources. LogicMonitor is ready out of the box.
Final Word
IT automation has revolutionized the IT sector, reducing the manual responsibilities that, for years, have plagued this industry. MSPs no longer need to enter network performance data into multiple systems, physically inspect servers, manage and provision networks manually, analyze performance reports, or perform other redundant tasks manually. Automation does a lot of the hard work so that these IT professionals can focus on far more critical tasks. By incorporating cloud-based infrastructure monitoring, AI, machine learning, and other new technologies, your IT executives improve productivity, enhance workflows, reduce IT resources, promote better client outcomes, and reduce costs over time.
Application Performance Monitoring (APM) and Application Performance Management (APM) play critical roles in not only identifying and resolving performance bottlenecks but also in driving broader IT goals such as scalability, user satisfaction, and operational efficiency. By providing granular insights and a strategic approach, these practices empower teams to maintain high-performing applications and deliver exceptional digital experiences.
What is application performance management?
Application performance management refers to the broader view into how an application is using resources and how that allotment influences the user experience. (We discussed why it’s important to have a Digital Experience Monitoring (DEM)-enabled APM in this article).
By focusing on end-user satisfaction, APM empowers ITOps teams to prioritize performance enhancements that align with business objectives, such as reducing latency, improving scalability, and delivering a seamless digital experience.
What is application performance monitoring?
Imagine an athlete preparing for a baseball game. The athlete’s training routine and performance data (ex: batting average) can be likened to application performance monitoring. The athlete’s overall approach to managing their performance to achieving optimal results (ex: attending every team practice, analyzing then buying better equipment) can be likened to application performance management.
Application performance monitoring refers to the granular understanding of the products providing a detailed analysis of the performance, optimization, and reliability of an application’s infrastructure and components. Closely monitoring the functionality of each step and transaction of the application stack makes it easier for organizations to debug and improve the application. In the event of an application crash or failure, data provided by application performance monitoring allows ITOps teams to quickly pinpoint the source and resolve the issue.
Three Key Differences Between APM v APM
| Functionality/Feature | Application Performance Monitoring | Application Performance Management |
| Scope of Problem Analysis | Code-level: Focus on code-level problems within a specific application. Focuses on monitoring individual steps. May lack scalability for enterprise-wide application monitoring. | Broad: Focuses on individual steps from an end-user perspective. Offers insights into which applications require optimization then helps with those efforts. May be less effective for managing performance across a large number of applications simultaneously. |
| Data Collection | Collects time-oriented data, analyzing each step in a sequential manner. Beneficial for debugging code-level errors and identifying application-specific issues. | Collects a broad range of data with emphasis on user interaction with the system. Beneficial insights (ex: memory usage and CPU consumption) help identify root causes impacting end-users. |
| Performance Criteria Considerations | More focused on the performance of individual applications. Example: criteria such as time thresholds to determine if the application meets end goal requirements. | More focused on real-user monitoring, directly correlating with the end-user experience. Example: Analyzes overall user experience and resource utilization for specific applications to enhance the end-user experience. |
Application performance management use cases
Organizations use APM to know what is going on with resource consumption at the hardware, network, and software levels. This data helps ITOps teams improve resource allocation which helps reduce costs, improve scalability, and enhance overall performance.
Here are some other use cases for application performance management:
Business transaction analysis organizations use APM to monitor and analyze the end-to-end journey of a business transaction within the application. APM gives insight into the different transactions’ interactions with components and systems to help ITOps teams identify any sources of performance bottlenecks.
Root cause analysis of performance issues or failures within an application environment is correlated through data from different monitoring sources, such as logs, metrics, and traces. When the exact source of the performance problem is found, troubleshooting and resolution happens faster, and downtime is reduced or avoided.
Compliance and regulatory requirements for software application performance are more easily met when APM is monitoring and documenting them. Organizations can rely on APM to fill the critical role of providing an audit trail and documentation of their adherence to industry standards and regulations.
SLA management with APM allows organizations to monitor, measure and report on agreed-upon key performance metrics and levels against predefined SLA targets. This data is then used for SLA reporting and compliance.
Application Performance Monitoring use cases
Organizations can leverage APM to gain data-based visibility into the sources of bottlenecks, latency issues, and resource constraints within the infrastructure. APM’s data on response time, CPU usage, memory consumption, and network latency help pinpoint the root causes of application performance degradation.
Here are some other use cases for application performance monitoring:
Proactive issue detection uses APM to set up thresholds and alerts for key performance indicators such as slowing response times, spiking error rates, and other anomalies which can produce a negative digital user experience.
Capacity planning uses APM to focus on CPU usage, memory use, and disk I/O of applications. This data shows where infrastructure resources need to scale or be redistributed to prevent performance issues.
User experience monitoring tracks user interactions, session durations, and conversion rates to identify areas where improvements to the infrastructure can enhance the user experience.
Code-level performance analysis uses APM to profile code execution. This data empowers developers with the information needed to identify and diagnose performance bottlenecks (i.e. slower response times or high resource usage) within the application code.
Service level agreements (SLA) compliance and reporting tracks and alerts anomalies in uptime, response time, and error rates. This level of monitoring helps teams stay in compliance with identified SLA targets. APM is also used to produce compliance reports for stakeholders.
When organizations leverage APM, they gain deep visibility into their application infrastructure, enabling proactive monitoring, real-time diagnostics, and ultimately drive business success.
Application performance management and monitoring in cloud-native environments
Cloud-native and hybrid IT setups bring a new level of complexity to application performance. These environments often rely on microservices architectures and containerized applications, which introduce unique challenges for both monitoring and management.
Application architecture discovery and modeling
Before you can effectively use APM tools, it is crucial to have a clear understanding of your application’s architecture. This includes identifying all application components, such as microservices, containers, virtual machines, and infrastructure components like databases and data centers.
Once all components are identified, creating a dependency map can help visualize the interactions and dependencies between them.
Application performance management in cloud-native setups
Application performance management takes a broader approach by optimizing resource allocation and ensuring seamless interactions between microservices. In serverless environments, APM tools help teams allocate resources efficiently and monitor functions’ performance at scale. This holistic perspective allows IT teams to anticipate and resolve issues that could degrade the end-user experience across complex, distributed systems.
Application performance monitoring in cloud-native setups
Application performance monitoring focuses on tracking the health and performance of individual containers and microservices. Tools designed for cloud-native environments, such as those compatible with Kubernetes, provide detailed insights into metrics like container uptime, resource consumption, and service response times. By closely monitoring these components, IT teams can quickly identify and address issues that could impact the overall application.
Cloud-native environments demand a unified strategy where monitoring tools offer granular insights, and management practices align these insights with broader operational goals. This synergy ensures consistent application performance, even in the most dynamic IT ecosystems.
Application monitoring vs infrastructure monitoring
While application monitoring and infrastructure monitoring share the common goal of maintaining optimal IT performance, they differ significantly in focus and scope. Application monitoring is primarily concerned with tracking the performance, reliability, and user experience of individual applications. It involves analyzing metrics such as response times, error rates, and transaction durations to ensure that applications meet performance expectations and provide a seamless user experience.
Infrastructure monitoring, on the other hand, takes a broader approach by focusing on the health and performance of the underlying systems, including servers, networks, and storage. Metrics like CPU usage, memory consumption, disk I/O, and network throughput are key indicators in infrastructure monitoring, providing insights into the stability and efficiency of the environment that supports applications.
Both types of monitoring are essential for maintaining a robust IT ecosystem. Application monitoring ensures that end-users can interact with applications smoothly, while infrastructure monitoring ensures that the foundational systems remain stable and capable of supporting those applications. By combining both approaches, IT teams gain comprehensive visibility into their environments, enabling them to proactively address issues, optimize resources, and deliver consistent performance.
This cohesive strategy empowers organizations to align application and infrastructure health with business objectives, ultimately driving better user satisfaction and operational efficiency.
Best practices for implementing application performance management and monitoring
To get the most out of application performance monitoring (APM) and application performance management (APM), it’s crucial to adopt effective practices that align with your organization’s goals and infrastructure. Here are some best practices to ensure successful implementation:
- Set realistic thresholds and alerts
- Establish performance benchmarks tailored to your application’s typical behavior.
- Use monitoring tools to set dynamic alerts for critical metrics like response times, error rates, and resource utilization, avoiding alert fatigue.
- Focus on end-user experience
- Prioritize metrics that directly impact user satisfaction, such as page load times or session stability.
- Use management tools to allocate resources where they will enhance end-user interactions.
- Align management goals with business objectives
- Collaborate with business stakeholders to identify key performance indicators (KPIs) that matter most to your organization.
- Ensure monitoring and management efforts support broader goals like reducing downtime, optimizing costs, or meeting SLA commitments.
- Leverage data for continuous improvement
- Regularly analyze performance data to identify trends, recurring issues, and areas for optimization.
- Integrate findings into your development and operational workflows for ongoing enhancement.
- Incorporate AIOps and automation
- Use artificial intelligence for IT operations (AIOps) to detect patterns, predict anomalies, and automate incident responses.
- Streamline routine management tasks to focus on higher-value activities.
- Plan for cloud-native complexity
- Adopt tools that support microservices and containerized environments, ensuring visibility across dynamic infrastructures.
- Monitor both individual service components and their interactions within the broader application ecosystem.
- Document and share insights
- Maintain clear documentation of performance monitoring solution thresholds, resource allocation strategies, and incident resolutions.
- Share these insights with cross-functional teams to promote collaboration and alignment.
Drive application performance with LogicMonitor
While use cases vary between application performance monitoring and application performance management, they share a common goal: ensuring applications run efficiently and effectively. Application performance monitoring excels at providing detailed data feedback to proactively identify and resolve performance issues, while application performance management emphasizes broader strategies to align processes and people for sustained application success.
Together, these approaches form a comprehensive performance strategy that enhances both the user and developer experience. By leveraging both techniques, organizations can optimize their applications to meet business objectives and exceed user expectations.
Ready to elevate your application performance strategy? LogicMonitor’s APM solutions provide powerful insights by unifying metrics, traces, and logs into a single platform. With features like distributed tracing, push metrics API, and synthetics testing, LM APM enables faster troubleshooting, enhanced visibility, and superior end-user experiences.
Amazon Web Services (AWS) Kinesis is a cloud-based service that can fully manage large distributed data streams in real-time. This serverless data service captures, processes, and stores large amounts of data. It is a functional and secure global cloud platform with millions of customers from nearly every industry. Companies from Comcast to the Hearst Corporation are using AWS Kinesis.
What is AWS Kinesis?
AWS Kinesis is a real-time data streaming platform that enables businesses to collect, process, and analyze vast amounts of data from multiple sources. As a fully managed, serverless service, Kinesis allows organizations to build scalable and secure data pipelines for a variety of use cases, from video streaming to advanced analytics.
The platform comprises four key components, each tailored to specific needs: Kinesis Data Streams, for real-time ingestion and custom processing; Kinesis Data Firehose, for automated data delivery and transformation; Kinesis Video Streams, for secure video data streaming; and Kinesis Data Analytics, for real-time data analysis and actionable insights. Together, these services empower users to handle complex data workflows with efficiency and precision.
To help you quickly understand the core functionality and applications of each component, the following table provides a side-by-side comparison of AWS Kinesis services:
| Feature | Video streams | Data firehose | Data streams | Data analytics |
| What it does | Streams video securely for storage, playback, and analytics | Automates data delivery, transformation, and compression | Ingests and processes real-time data with low latency and scalability | Provides real-time data transformation and actionable insights |
| How it works | Uses AWS Management Console for setup; streams video securely with WebRTC and APIs | Connects to AWS and external destinations; transforms data into formats like Parquet and JSON | Utilizes shards for data partitioning and storage; integrates with AWS services like Lambda and EMR | Uses open-source tools like Apache Flink for real-time data streaming and advanced processing |
| Key use cases | Smart homes, surveillance, real-time video analytics for AI/ML | Log archiving, IoT data ingestion, analytics pipelines | Application log monitoring, gaming analytics, web clickstreams | Fraud detection, anomaly detection, real-time dashboards, and streaming ETL workflows |
How AWS Kinesis works
AWS Kinesis operates as a real-time data streaming platform designed to handle massive amounts of data from various sources. The process begins with data producers—applications, IoT devices, or servers—sending data to Kinesis. Depending on the chosen service, Kinesis captures, processes, and routes the data in real time.
For example, Kinesis Data Streams breaks data into smaller units called shards, which ensure scalability and low-latency ingestion. Kinesis Firehose, on the other hand, automatically processes and delivers data to destinations like Amazon S3 or Redshift, transforming and compressing it along the way.
Users can access Kinesis through the AWS Management Console, SDKs, or APIs, enabling them to configure pipelines, monitor performance, and integrate with other AWS services. Kinesis supports seamless integration with AWS Glue, Lambda, and CloudWatch, making it a powerful tool for building end-to-end data workflows. Its serverless architecture eliminates the need to manage infrastructure, allowing businesses to focus on extracting insights and building data-driven applications.
Security
Security is a top priority for AWS, and Kinesis strengthens this by providing encryption both at rest and in transit, along with role-based access control to ensure data privacy. Furthermore, users can enhance security by enabling VPC endpoints when accessing Kinesis from within their virtual private cloud.
Kinesis offers robust features, including automatic scaling, which dynamically adjusts resources based on data volume to minimize costs and ensure high availability. Furthermore, it supports enhanced fan-out for real-time streaming applications, providing low latency and high throughput.
Video Streams
What it is:
Amazon Video Streams offers users an easy method to stream video from various connected devices to AWS. Whether it’s machine learning, playback, or analytics, Video Streams will automatically scale the infrastructure from streaming data and then encrypt, store, and index the video data. This enables live, on-demand viewing. The process allows integrations with libraries such as OpenCV, TensorFlow, and Apache MxNet.
How it works:
The Amazon Video Streams starts with the use of the AWS Management Console. After installing Kinesis Video Streams on a device, users can stream media to AWS for analytics, playback, and storage. The Video Streams features a specific platform for streaming video from devices with cameras to Amazon Web Services. This includes internet video streaming or storing security footage. This platform also offers WebRTC support and connecting devices that use the Application Programming Interface.
Data consumers:
MxNet, HLS-based media playback, Amazon SageMaker, Amazon Rekognition
Benefits:
- There are no minimum fees or upfront commitments.
- Users only pay for what they use.
- Users can stream video from literally millions of different devices.
- Users can build video-enabled apps with real-time computer-assisted vision capabilities.
- Users can playback recorded and live video streams.
- Users can extract images for machine learning applications.
- Users can enjoy searchable and durable storage.
- There is no infrastructure to manage.
Use cases:
- Users can engage in peer-to-peer media streaming.
- Users can engage in video chat, video processing, and video-related AI/ML.
- Smart homes can use Video Streams to stream live audio and video from devices such as baby monitors, doorbells, and various home surveillance systems.
- Users can enjoy real-time interaction when talking with a person at the door.
- Users can control, from their mobile phones, a robot vacuum.
- Secure Video Streams provides access to streams using Access Management (IAM) and AWS Identity.
- City governments can use Video Streams to securely store and analyze large amounts of video data from cameras at traffic lights and other public venues.
- An Amber Alert system is a specific example of using Video Streams.
- Industrial uses include using Video Streams to collect time-coded data such as LIDAR and RADAR signals.
- Video Streams are also helpful for extracting and analyzing data from various industrial equipment and using it for predictive maintenance and even predicting the lifetime of a particular part.
Data firehose
What it is:
Data Firehose is a service that can extract, capture, transform, and deliver streaming data to analytic services and data lakes. Data Firehose can take raw streaming data and convert it into various formats, including Apache Parquet. Users can select a destination, create a delivery stream, and start streaming in real-time in only a few steps.
How it works:
Data Firehose allows users to connect with potentially dozens of fully integrated AWS services and streaming destinations. The Firehose is basically a steady stream of all of a user’s available data and can deliver data constantly as updated data comes in. The amount of data coming through may increase substantially or just trickle through. All data continues to make its way through, crunching until it’s ready for visualizing, graphing, or publishing. Data Firehose loads data onto Amazon Web Services while transforming the data into Cloud services that are basically in use for analytical purposes.
Data consumers:
Consumers include Splunk, MongoDB, Amazon Redshift, Amazon Elasticsearch, Amazon S3, and generic HTTP endpoints.
Benefits:
- Users can pay as they go and only pay for the data they transmit.
- Data Firehose offers easy launch and configurations.
- Users can convert data into specific formats for analysis without processing pipelines.
- The user can specify the size of a batch and control the speed for uploading data.
- After launching, the delivery streams provide elastic scaling.
- Firehose can support data formats like Apache ORC and Apache Parquet.
- Before storing, Firehose can convert data formats from JSON to ORC formats or Parquet. This saves on analytics and storage costs.
- Users can deliver their partitioned data to S3 using dynamically defined or static keys. Data Firehose will group data by different keys.
- Data Firehose automatically applies various functions to all input data records and loads transformed data to each destination.
- Data Firehose gives users the option to encrypt data automatically after uploading. Users can specifically appoint an AWS Key Management encryption key.
- Data Firehose features a variety of metrics that are found through the console and Amazon CloudWatch. Users can implement these metrics to monitor their delivery streams and modify destinations.
Use cases:
- Users can build machine learning streaming applications. This can help users predict inference endpoints and analyze data.
- Data Firehose provides support for a variety of data destinations. A few it currently supports include Amazon Redshift, Amazon S3, MongoDB, Splunk, Amazon OpenSearch Service, and HTTP endpoints.
- Users can monitor network security with Event Management (SIEM) tools and supported Security Information.
- Firehose supports compression algorithms such as Zip, Snappy, GZip, and Hadoop-Compatible Snappy.
- Users can monitor in real-time IoT analytics.
- Users can create Clickstream sessions and create log analytics solutions.
- Firehose provides several security features.
Data streams
What it is:
Data Streams is a real-time streaming service that provides durability and scalability and can continuously capture gigabytes from hundreds of thousands of different sources. Users can collect log events from their servers and various mobile deployments. This particular platform puts a strong emphasis on security. Data streams allow users to encrypt sensitive data with AWS KMS master keys and a server-side encryption system. With the Kinesis Producer Library, users can easily create Data Streams.
How it works:
Users can create Kinesis Data Streams applications and other types of data processing applications with Data Streams. Users can also send their processed records to dashboards and then use them when generating alerts, changing advertising strategies, and changing pricing.
Data consumers:
Amazon EC2, Amazon EMR, AWS Lambda, and Kinesis Data Analytics
Benefits:
- Data Streams provide real-time data aggregation after loading the aggregate data into a map-reduce cluster or data warehouse.
- Kinesis Data Streams feature a delay time between when records are put in the stream and when users can retrieve them, which is approximately less than a second.
- Data Streams applications can consume data from the stream almost instantly after adding the data.
- Data Streams allow users to scale up or down, so users never lose any data before expiration.
- The Client Library supports fault-tolerant data consumption and offers support for scaling support Data Streams applications.
Use cases:
- Data Streams can work with IT infrastructure log data, market data feeds, web clickstream data, application logs, and social media.
- Data Streams provides application logs and a push system that features processing in only seconds. This also prevents losing log data even if the application or front-end server fails.
- Users don’t batch data on servers before submitting it for intake. This accelerates the data intake.
- Users don’t have to wait to receive batches of data but can work on metrics and application logs as the data is streaming in.
- Users can analyze site usability engagement while multiple Data Streams applications run parallel.
- Gaming companies can feed data into their gaming platform.
Data analytics
What it is:
Data Analytics provides open-source libraries such as AWS service integrations, AWS SDK, Apache Beam, Apache Zeppelin, and Apache Flink. It’s for transforming and analyzing streaming data in real time.
How it works:
Its primary function is to serve as a tracking and analytics platform. It can specifically set up goals, run fast analyses, add tracking codes to various sites, and track events. It’s important to distinguish Data Analytics from Data Studio. Data Studio can access a lot of the same data as Data Analytics but displays site traffic in different ways. Data Studio can help users share their data with others who are perhaps less technical and don’t understand analytics well.
Data consumers:
Results are sent to a Lambda function, Kinesis Data Firehose delivery stream, or another Kinesis stream.
Benefits:
- Users can deliver their streaming data in a matter of seconds. They can develop applications that deliver the data to a variety of services.
- Users can enjoy advanced integration capabilities that include over 10 Apache Flink connectors and even the ability to put together custom integrations.
- With just a few lines of code, users can modify integration abilities and provide advanced functionality.
- With Apache Flink primitives, users can build integrations that enable reading and writing from sockets, directories, files, or various other sources from the internet.
Use cases:
- Data Analytics is compatible with the AWS Glue Schema Registry. It’s serverless and lets users control and validate streaming data while using Apache Avro schemes. This is at no additional charge.
- Data Analytics features APIs in Python, SQL, Scala, and Java. These offer specialization for various use cases, such as streaming ETL, stateful event processing, and real-time analytics.
- Users can deliver data to the following and implement Data Analytics libraries for Amazon Simple Storage Service, Amazon OpenSearch Service, Amazon DynamoDB, AWS Glue Schema Registry, Amazon CloudWatch, and Amazon Managed Streaming for Apache Kafka.
- Users can enjoy “Exactly Once Processing.” This involves using Apache Flink to build applications in which processed records affect results. Even if there are disruptions, such as internal service maintenance, the data will still process without any duplicate data.
- Users can also integrate with the AWS Glue Data Catalog store. This allows users to search multiple AWS datasets
- Data Analytics provides the schema editor to find and edit input data structure. The system will recognize standard data formats like CSV and JSON automatically. The editor is easy to use, infers the data structure, and aids users in further refinement.
- Data Analytics can integrate with both Amazon Kinesis Data Firehose and Data Streams. Pointing data analytics at the input stream will cause it to automatically read, parse, and make the data available for processing.
- Data Analytics allows for advanced processing functions that include top-K analysis and anomaly detection on the streaming data.
AWS Kinesis vs. Apache Kafka
In data streaming solutions, AWS Kinesis and Apache Kafka are top contenders, valued for their strong real-time data processing capabilities. Choosing the right solution can be challenging, especially for newcomers. In this section, we will dive deep into the features and functionalities of both AWS Kinesis and Apache Kafka to help you make an informed decision.
Operation
AWS Kinesis, a fully managed service by Amazon Web Services, lets users collect, process, and analyze real-time streaming data at scale. It includes Kinesis Data Streams, Kinesis Data Firehose, and Kinesis Data Analytics. Conversely, Apache Kafka, an open-source distributed streaming platform, is built for real-time data pipelines and streaming applications, offering a highly available and scalable messaging infrastructure for efficiently handling large real-time data volumes.
Architecture
AWS Kinesis and Apache Kafka differ in architecture. Kinesis is a managed service with AWS handling the infrastructure, while Kafka requires users to set up and maintain their own clusters.
Kinesis Data Streams segments data into multiple streams via sharding, allowing each shard to process data independently. This supports horizontal scaling by adding shards to handle more data. Kinesis Data Firehose efficiently delivers streaming data to destinations like Amazon S3 or Redshift. Meanwhile, Kinesis Data Analytics offers real-time data analysis using SQL queries.
Kafka functions on a publish-subscribe model, whereby producers send records to topics, and consumers retrieve them. It utilizes a partitioning strategy, similar to sharding in Kinesis, to distribute data across multiple brokers, thereby enhancing scalability and fault tolerance.
What are the main differences between data firehose and data streams?
One of the primary differences is in each building’s architecture. For example, data enters through Kinesis Data Streams, which is, at the most basic level, a group of shards. Each shard has its own sequence of data records. Firehose delivery stream assists in IT automation, by sending data to specific destinations such as S3, Redshift, or Splunk.
The primary objectives between the two are also different. Data Streams is basically a low latency service and ingesting at scale. Firehose is generally a data transfer and loading service. Data Firehose is constantly loading data to the destinations users choose, while Streams generally ingests and stores the data for processing. Firehose will store data for analytics while Streams builds customized, real-time applications.
Detailed comparisons: Data Streams vs. Firehose
AWS Kinesis Data Streams and Kinesis Data Firehose are designed for different data streaming needs, with key architectural differences. Data Streams uses shards to ingest, store, and process data in real time, providing fine-grained control over scaling and latency. This makes it ideal for low-latency use cases, such as application log processing or real-time analytics. In contrast, Firehose automates data delivery to destinations like Amazon S3, Redshift, or Elasticsearch, handling data transformation and compression without requiring the user to manage shards or infrastructure.
While Data Streams is suited for scenarios that demand custom processing logic and real-time data applications, Firehose is best for bulk data delivery and analytics workflows. For example, Firehose is often used for IoT data ingestion or log file archiving, where data needs to be transformed and loaded into a storage or analytics service. Data Streams, on the other hand, supports applications that need immediate data access, such as monitoring dashboards or gaming platform analytics. Together, these services offer flexibility depending on your real-time streaming and processing needs.
Why choose LogicMonitor?
LogicMonitor provides advanced monitoring for AWS Kinesis, enabling IT teams to track critical metrics and optimize real-time data streams. By integrating seamlessly with AWS and CloudWatch APIs, LogicMonitor offers out-of-the-box LogicModules to monitor essential performance metrics, including throughput, shard utilization, error rates, and latency. These metrics are easily accessible through customizable dashboards, providing a unified view of infrastructure performance.
With LogicMonitor, IT teams can troubleshoot issues quickly by identifying anomalies in metrics like latency and error rates. Shard utilization insights allow for dynamic scaling, optimizing resource allocation and reducing costs. Additionally, proactive alerts ensure that potential issues are addressed before they impact operations, keeping data pipelines running smoothly.
By correlating Kinesis metrics with data from on-premises and other cloud performance services, LogicMonitor delivers holistic observability. This comprehensive view enables IT teams to maintain efficient, reliable, and scalable Kinesis deployments, ensuring seamless real-time data streaming and analytics.
The scene is familiar to any IT operations professional: the dreaded 3 AM call, multiple monitoring tools showing conflicting status indicators, and teams pointing fingers instead of solving problems. For managed service providers (MSPs) supporting hundreds or thousands of customers, this challenge multiplies exponentially. But at AWS re:Invent 2024, Synoptek’s team revealed how they’ve fundamentally transformed this reality for their 1,200+ customer base through AI-powered observability.
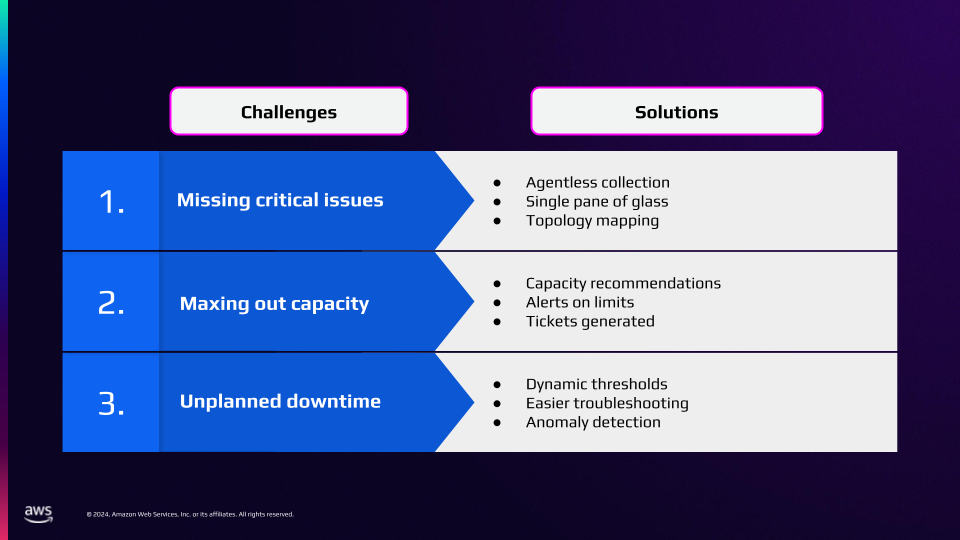
The true cost of tool sprawl: When more tools mean more problems
“In the before times, our enterprise operations center was watching six different tools looking for alerts and anomalies,” shares Mike Hashemi, Systems Integration Engineer at Synoptek.
This admission resonates with MSPs worldwide, where operating with multiple disparate tools has become an accepted, if painful, norm.
The true cost of this approach extends far beyond simple tool licensing. Neetin Pandya, Director of Cloud Operations at Synoptek, paints a stark picture of the operational burden: “If we have more than thousand plus customers, then we need one or two engineers with the same skill set into different shifts…three engineers for a single tool, every time.” This multiplication of specialized staff across three shifts creates an unsustainable operational model, both financially and practically.
The complexity doesn’t end with staffing. Each monitoring tool brings its own training requirements, maintenance overhead, and integration challenges.
Case in point: when different tools show conflicting statuses for the same device, engineers waste precious time simply verifying if alerts are real instead of solving actual problems. This tool sprawl creates a perfect storm of increased response times, decreased service quality, and frustrated customers.
Breaking free from traditional constraints
Synoptek’s transformation began with a fundamental shift in their monitoring approach. Rather than managing multiple agent-based tools, they moved to an agentless architecture that could monitor anything generating data, regardless of its location or connection method.
Hashemi shares a powerful example: “We had a device that was not network connected. But it was connected to a Raspberry Pi via serial cable…they realized that they had to watch that separate from the monitoring system. And they said, ‘Hey, can we get this in there?’ And I said, ‘yeah, absolutely, no problem.'”
This flexibility with LogicMonitor’s hybrid observability powered by AI platform, LM Envision, proves crucial for MSPs who need to support diverse client environments and unique monitoring requirements. But the real breakthrough came with the implementation of dynamic thresholds and AI-powered analysis.
Traditional static thresholds, while simple to understand, create a constant stream of false positives that overwhelm operations teams. “If a server CPU spikes up for one minute, drops back down, it’s one CPU in a cluster… you’re going to get an alert, but who cares? The cluster was fine,” Hashemi explains. The shift to dynamic thresholds that understand normal behavior patterns has dramatically reduced this noise.
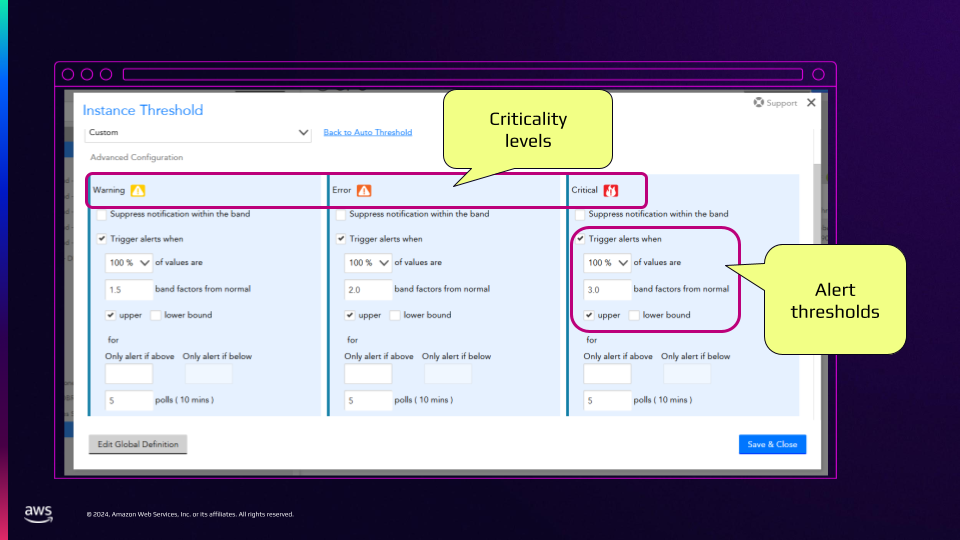
The cost optimization breakthrough
Perhaps the most compelling aspect of Synoptek’s transformation emerged in an unexpected area: cloud cost optimization. Pandya describes a common scenario that plagues many organizations: “For a safer side, what they do, they can just double the size and put it and deploy at that time. And they don’t know, and they are putting a lot of monthly recurring costs.”
Through comprehensive monitoring and analysis of resource utilization patterns, Synoptek has helped clients achieve an average of 20% reduction in cloud costs. This isn’t just about identifying underutilized resources; it’s about understanding usage patterns over time and making data-driven decisions about resource allocation.
The AI revolution: Empowering teams, not replacing them
The implementation of AI-powered operations will mark a fundamental shift in how Synoptek delivers services, with early indications pointing towards at least an 80% reduction in alert noise. But what happens to Level 1 engineers when alert volumes drop so dramatically? Synoptek saw an opportunity for evolution.
“Our L1 engineers who are appointed to see the continuous monitoring, that is no longer needed. We put them into more proactive or business strategic work…especially into DevOps operations support,” Pandya explains. This transformation represents a crucial opportunity for MSPs to elevate their service offerings while improving employee satisfaction and retention.
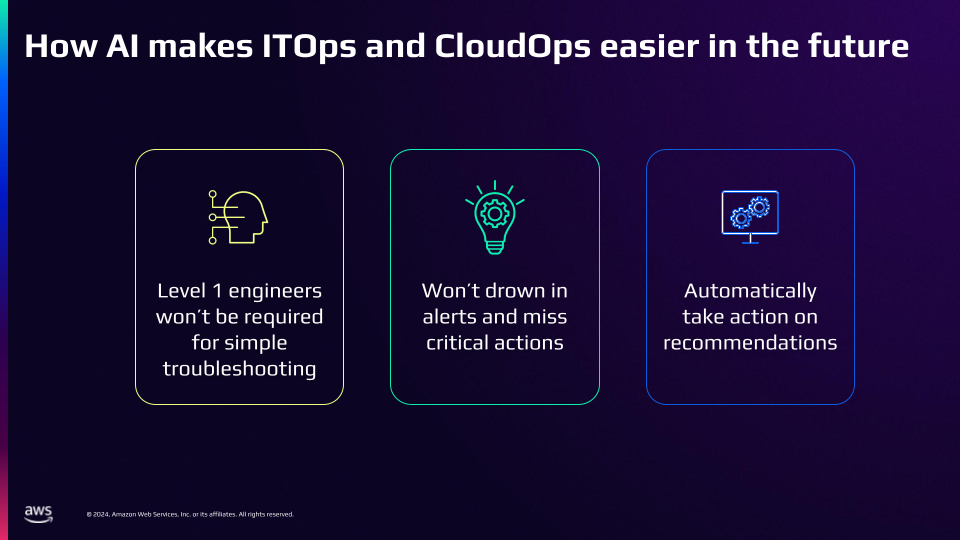
A new era for managed services providers
As Pandya concludes, “The biggest benefit is not only monitoring the cloud platform, we can manage all of our hyperscale and hybrid platforms as well. And it’s all in one place.” This unified approach, powered by AI and automation, represents the future of managed services.
The transformation journey isn’t without its challenges. Success requires careful planning, from selecting the right pilot clients to training teams on new capabilities. But the results, like improved service levels, reduced costs, and more strategic client relationships, make the effort worthwhile.
For MSPs watching from the sidelines, the message is clear: the future of IT operations lies not in having more tools or more data, but in having intelligent systems that can make sense of it all. The key is to start the journey now, learning from successful transformations like Synoptek’s while adapting the approach to specific business needs and client requirements.
Keeping a network in top shape is essential, especially when a single bottleneck can slow down the whole operation. Troubleshooting network problems quickly keeps network performance on track, and NetFlow delivers advanced network services to organizations. This gives network admins and engineers real-time traffic visibility that helps track bandwidth and resolve issues before they become headaches—while also boosting performance.
By tapping into built-in NetFlow on routers and switches, you can get a front-row view of what’s actually happening across your network. This guide dives into everything you need to know about how to effectively use a NetFlow traffic analyzer to track bandwidth usage, identify traffic bottlenecks, and optimize network performance, giving your IT teams the tools to address issues before they impact users.
This article will touch base on the following areas:
- NetfFlow versions and flow record
- Key applications of NetfFlow
- Monitoring NetFlow data
- Insights gained through NetFlow monitoring
What is a NetFlow traffic analyzer?
A NetFlow traffic analyzer is a powerful tool that provides deep insights into network traffic patterns by analyzing NetFlow data generated by network devices. This tool helps network engineers and administrators monitor bandwidth, detect anomalies, and optimize network performance in real-time. Analyzing NetFlow data shows where bandwidth is used, by whom, and for what purpose, giving IT teams critical visibility to troubleshoot and manage network traffic effectively.
Understanding NetFlow
NetFlow is a network protocol developed by Cisco Systems to collect detailed information about IP traffic. Now widely used across the industry, NetFlow captures data such as source and destination IP addresses and ports, IP protocol, and IP service types. Using this data, network teams can answer essential questions, such as:
- Who is using the bandwidth? (Identifying users)
- What is consuming bandwidth? (Tracking applications)
- How much bandwidth is being used? (Highlighting “Top Talkers”)
- When is the peak bandwidth usage? (Monitoring top flows)
- Where are bandwidth demands the highest? (Analyzing network interfaces)
What is NetFlow data?
NetFlow data refers to the specific information the NetFlow protocol captures to track and analyze network behavior. It acts like a blueprint of network traffic, detailing everything you need to know about how data moves through your network. By breaking down source, destination, and flow details, NetFlow data allows network administrators to pinpoint the who, what, where, when, and how of bandwidth usage.
The evolution of NetFlow and Flow Records
NetFlow has come a long way since its start, with multiple versions introducing new capabilities to meet the growing demands of network monitoring. Each iteration brought enhanced features to capture and analyze network traffic, with NetFlow v5 and NetFlow v9 currently being the most commonly used versions. NetFlow v5 was an early standard, capturing a fixed set of data points per packet. NetFlow v9, however, introduced a more adaptable template-based format, including additional details like application IDs.
The most recent iteration, IPFIX (often called NetFlow v10), is an industry-standard version offering even greater flexibility. IPFIX expanded data fields and data granularity, making it possible to gather highly specific network metrics, such as DNS query types, retransmission rates, Layer 2 details like MAC addresses, and much more.
The core output of each version is the flow record, which is a detailed summary of each data packet’s key fields, like source and destination identifiers. This flow is exported to the collector for further processing, offering IT teams the granular data they need to make informed decisions and address network challenges efficiently.
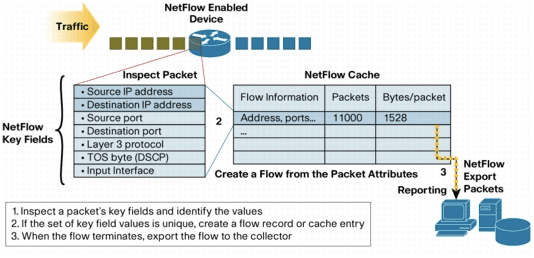
How to monitor network traffic using a NetFlow analyzer
Monitoring network traffic with a NetFlow analyzer enables IT teams to capture, analyze, and visualize flow data, helping them track bandwidth usage and detect inefficiencies across the network. Here’s a breakdown of the key components in this process:
Flow exporter
A network device, such as a router or firewall, acts as the flow exporter. This device collects packets into flows, capturing essential data points like source and destination IPs. Once accumulated, it forwards the flow records to a flow collector through UDP packets.
Flow collector
A flow collector, such as LogicMonitor’s Collector, is a central hub for all exported flow data. It gathers records from multiple flow exporters, bringing network visibility across all devices and locations together in one place. With everything in one spot, admins can analyze network traffic without the hassle of manually aggregating data.
Flow analyzer
Like LogicMonitor’s Cloud Server, the flow analyzer processes the collected flow data and provides detailed real-time network traffic analysis. This tool helps you zero in on bandwidth-heavy users, identify latency issues, and locate bottlenecks. By linking data across interfaces, protocols, and devices, LogicMonitor’s flow analyzer gives teams real-time insights to keep traffic moving smoothly and prevent disruptions.
Real-time network traffic analysis across environments
When dealing with interconnected networks, real-time analysis of network traffic helps you better understand your data flows, manage your bandwidth, and maintain ideal conditions across on-premises, cloud, and hybrid IT environments. A NetFlow analyzer lets LogicMonitor users track data flow anywhere they need to examine it and optimize traffic patterns for current and future network demands.
Real-time traffic analysis for on-premises networks
For on-prem systems, LogicMonitor’s NetFlow analysis gives you immediate insights into local network behavior. It pinpoints peak usage times and highlights applications or devices that may be using more bandwidth than they should. This real-time visibility helps you prioritize bandwidth to avoid bottlenecks and get the most out of your on-site networks.
Cloud network traffic monitoring in real-time
In a cloud environment, real-time monitoring gives you a deep look into traffic flows between cloud-native applications and resources, helping you manage network traffic with precision. LogicMonitor’s NetFlow analysis identifies high-demand services and simplifies bandwidth allocation across cloud instances, ensuring smooth data flow between applications.
Traffic analysis in hybrid cloud networks
In a hybrid cloud environment, data constantly moves between on-premises and cloud-based resources, making the LogicMonitor real-time network traffic analysis even more critical. Our NetFlow analyzer tracks data flows across both private and public cloud networks, providing real-time visibility into how traffic patterns impact bandwidth. Using real-time monitoring and historical data trends, our tools enable network administrators to ensure network resilience, manage traffic surges, and improve overall network efficiency in complex hybrid cloud settings.
LogicMonitor’s flow analyzer lets IT teams spot high-traffic areas and identify the root causes of slowdowns and bottlenecks. Armed with this information, admins can proactively adjust bandwidth allocation or tweak routing protocols to prevent congestion. This type of traffic analysis optimizes bandwidth utilization across all types of environments, supporting smooth data transfer between systems.
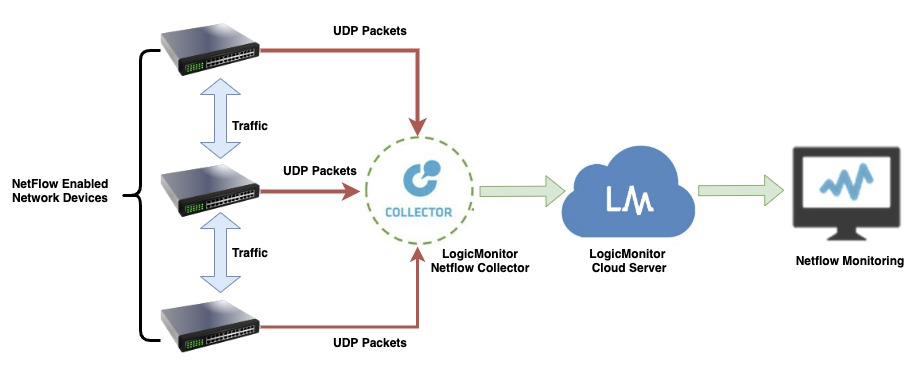
Why use a NetFlow traffic analyzer for your network?
A NetFlow traffic analyzer does more than just monitor your network—it gives you real-time visibility into the performance and security needed to keep everything running smoothly. With insights that help optimize network efficiency and troubleshoot issues before they become disruptions, NetFlow monitoring is an invaluable tool for keeping your network in top shape. Here’s a look at some key ways NetFlow monitoring can drive network efficiency and keep everything running smoothly:
1. Clear network visibility
A NetFlow traffic analyzer gives network admins real-time visibility into traffic flows, making it easy to see who’s using bandwidth and which apps are hogging resources. With live insights like these, admins can jump on performance bottlenecks before they become full-blown issues, ensuring users experience a smooth, seamless network. Using this data, you can quickly predict QoS (Quality Of Service) and direct resources based on users. You can also prevent network exposure to malware risks and intruders.
2. Root cause analysis of network issues
NetFlow monitoring makes finding the root cause of network slowdowns much easier. When users experience delays accessing applications, NetFlow data gives you a clear view of where your problem might be located. By analyzing traffic patterns, packet drops, and response times, your team can pinpoint which device, application, or traffic bottleneck is causing the lag. Your teams can use this data to resolve the problem at its source, keeping the network humming and users unaware.
3. Bandwidth optimization and performance troubleshooting
NetFlow data drills down into bandwidth usage across interfaces, protocols, and applications, helping you spot “top talkers”—the heaviest bandwidth users—on the network. With this detailed view, IT teams can quickly decide if high-usage traffic is relevant or needs adjusting. This helps balance resources efficiently, boosting overall network performance.
4. Forecasting bandwidth utilization and capacity planning
NetFlow data isn’t just for today’s needs; it helps IT teams look ahead. By analyzing traffic patterns over time, admins can forecast future bandwidth requirements, giving them the insight to plan capacity strategically. This proactive approach ensures your network can handle peak traffic times without slowdowns, keeping performance steady in the long run.
5. Identification of Security Breach
A NetFlow traffic analyzer is invaluable for detecting potential security threats, from unusual traffic spikes to unauthorized access attempts. Many types of security attacks consume network resources and cause anomalous usage spikes, which might mean a security breach. NetFlow data enables admins to monitor, receive alerts, and investigate suspicious patterns in real-time, addressing issues before they become security breaches.
Key insights from LogicMonitor’s NetFlow monitoring
Using LogicMonitor’s NetFlow Monitoring, one can get valuable insights on the below data points:
- Bandwidth Utilization
Identify the network conversation from the source and destination IP addresses and traffic path in the network from the Input and Output interface information.

- Top Flows and Top Talkers
Identify Top N applications, Top Source/Destination Endpoints, and protocols consuming the network bandwidth.
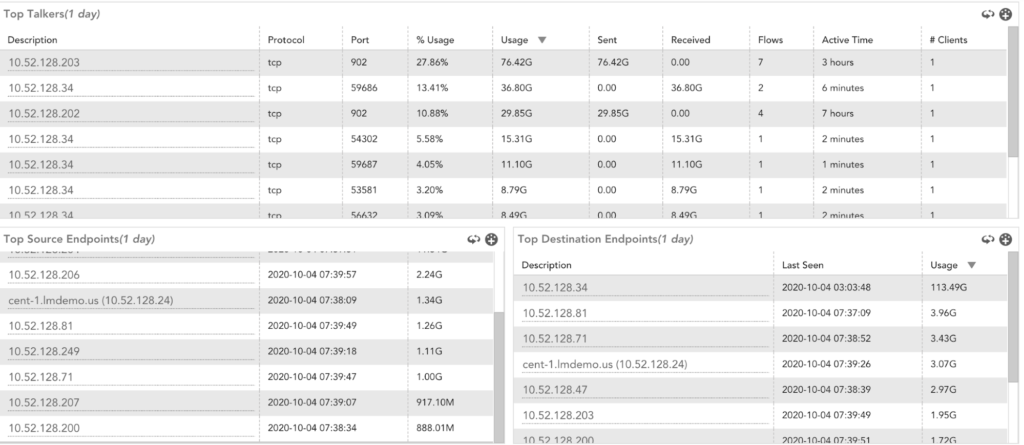
- Consumers of the Bandwidth
Keep track of interface details and statistics of top talkers and users. This can help determine the origin of an issue when it’s reported.

- Bandwidth Hogging
Analyze historical data to examine incident patterns and their impact on total network traffic through the packet and octet count.
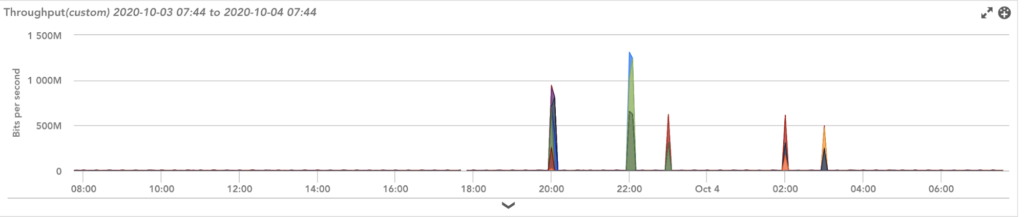
- ToS and QoS Analysis
Using ToS (Type of Service), ensure the right priorities are provided to the right applications. Verify the Quality of Service (QoS) levels achieved to optimize network bandwidth for the specific requirements.
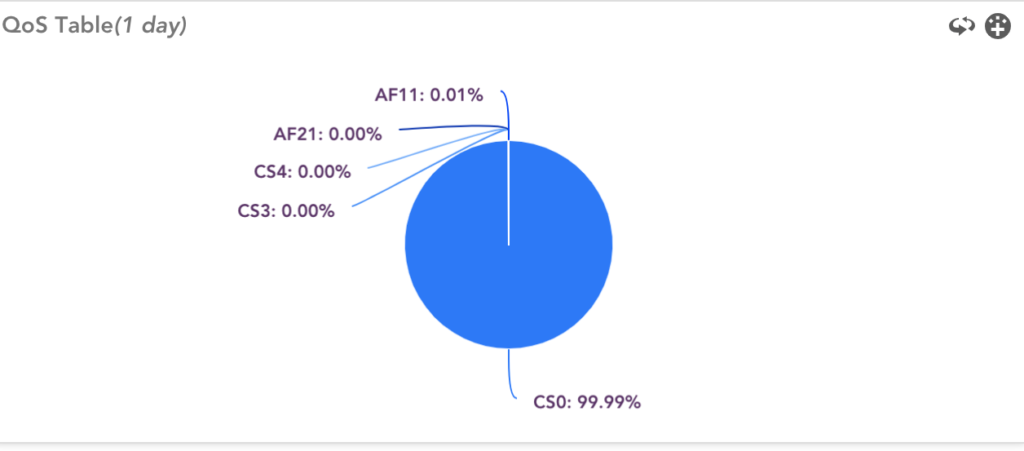
- IPv6 Traffic Monitoring
LogicMonitor’s NetFlow Monitoring provides out-of-the-box support for a mix of IPv4 and IPv6 environments and the flexibility to differentiate TopN flows in each protocol. IPv6 adoption is gaining significant traction in the public sector, large-scale distribution systems, and companies working with IoT infrastructures.
- Applications Classification through NBAR2
Network-Based Application Recognition (NBAR) provides an advanced application classification mechanism using application signatures, databases, and deep packet inspection. Enabling NBAR on specific devices directly within the network accomplishes this.
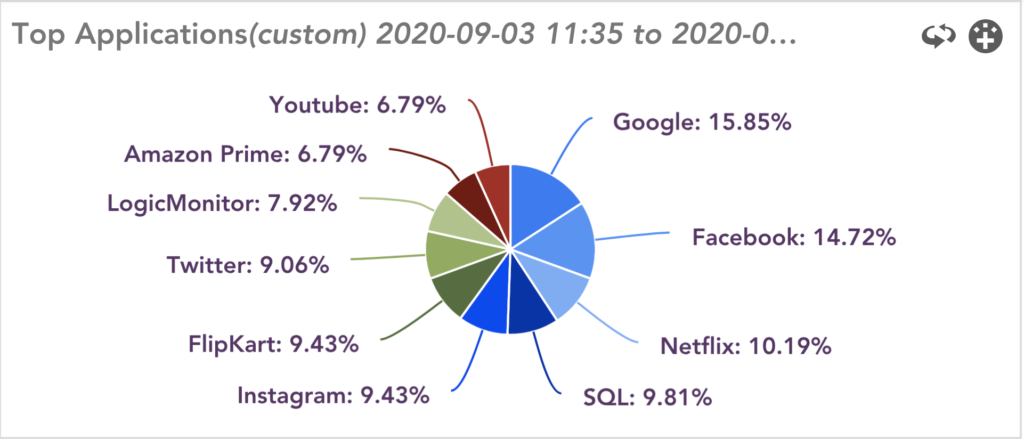
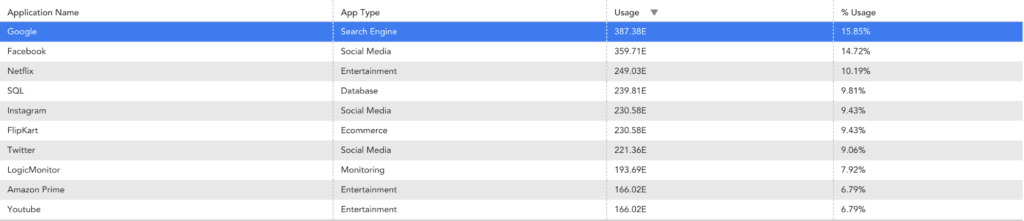
NetFlow traffic analyzer vs. other network monitoring tools
Each network monitoring tool brings its own strengths to the table, but NetFlow stands out when you need detailed traffic insights. With its ability to capture entire traffic flows, track bandwidth usage, and provide real-time visibility down to the user level, NetFlow is uniquely suited for in-depth network analysis. Here’s how NetFlow stacks up to other common methods:
- SNMP (Simple Network Management Protocol): SNMP is a popular go-to for device monitoring, providing valuable status data, such as device health and connectivity. However, unlike NetFlow, it doesn’t offer the granularity to drill down into specific traffic flows or analyze bandwidth by user or application.
- sFlow: sFlow offers real-time network monitoring similar to NetFlow but samples traffic instead of tracking every packet. This is helpful in high-speed networks with massive data volumes. NetFlow’s detailed traffic records provide a fuller view, making it the preferred choice of many admins and engineers for in-depth traffic analysis.
- Packet sniffers: Packet sniffers, like Wireshark, capture every packet for deep packet inspection and troubleshooting. While packet sniffers are great for precise packet analysis, they’re resource-heavy, less scalable, and lack NetFlow’s high-level summary, making NetFlow better suited for long-term traffic analysis and monitoring.
Choosing the right NetFlow traffic analyzer for your network
A NetFlow traffic analyzer is no place to cut corners. When choosing a traffic analysis tool, consider factors like network size, complexity, and scalability. The right NetFlow analyzer will simplify monitoring, enhance capacity planning, and support a complex network’s performance needs. Keep these features in mind when selecting your traffic analysis tool:
- Scalability: Plan for growth. Select a solution that can keep up as your network expands. For example, LogicMonitor’s NetFlow analyzer supports a range of network sizes while maintaining high performance.
- Integration: Compatibility is key. Choose a tool that integrates smoothly with your existing infrastructure, including network devices, software, and other bandwidth monitoring tools. This ensures better data flow and fewer integration hurdles.
- Ease of use: Sometimes, simplicity is best. An intuitive interface and easy-to-navigate dashboards streamline network management. Look for tools with customizable dashboards, like LogicMonitor, to make data visualization and metric tracking more accessible for your team.
Leveraging historical data from a NetFlow analyzer for trend analysis
A NetFlow analyzer does more than keep tabs on what’s happening right now—it also builds a rich library of historical data that’s invaluable for understanding network patterns over time. Harnessing historical NetFlow data transforms your network management from reactive to proactive, giving your team the foresight to stay ahead of network demands and keep performance steady. Analyzing traffic trends allows you to catch usage shifts, pinpoint recurring bottlenecks, and anticipate future bandwidth needs. Here’s how trend analysis is a game-changer for network management:
- Capacity planning: Historical data better prepares you for growth. Analyzing traffic patterns lets you predict when and where you might need to expand your network, helping you avoid unexpected slowdowns and allocate resources where your system needs them most.
- Issue prevention: Spotting patterns in past issues can reveal weak spots. By identifying trends in packet loss, latency spikes, or high bandwidth usage, your team can address problem areas and prevent potential disruptions.
- Optimizing resource allocation: Historical data helps you understand not only peak usage times but also which applications or users consistently consume a lot of bandwidth. With these insights, you can fine-tune resource allocation to maintain smooth network performance, even as demands evolve.
Customizing LogicMonitor’s NetFlow dashboards for better insights
Personalizing NetFlow dashboards is key to tracking the metrics that matter most to your network. With personalized dashboards and reports, LogicMonitor’s NetFlow capabilities provide a clear view of your network’s performance and use filters to narrow down metrics that impact network reliability. LogicMonitor makes it easy to set up custom views, helping you keep essential data at your fingertips.
- Tailored tracking: Customize dashboards to display specific metrics, such as top talkers, application performance, or interface traffic. Your team can monitor critical elements without sifting through unnecessary information by zeroing in on relevant data.
- Detailed reporting: You can generate reports that match your organization’s needs, from high-level summaries to deep-dive analytics. Custom reports let you focus on trends, performance, and usage patterns—whether you’re managing day-to-day operations or planning for growth.
Threshold alarms and alerts
LogicMonitor’s NetFlow analyzer lets you configure threshold alarms and alerts that enable your team to monitor network performance and detect anomalies in real-time. These alerts immediately flag unusual activity, such as bandwidth spikes or sudden drops in traffic, helping your team react quickly and keep network disruptions at bay. Here are a few ways that threshold alarms and alerts work to enhance monitoring:
- Customizable thresholds: Set individual thresholds for various traffic metrics, including bandwidth usage, latency, or protocol-specific data flows. Customization lets you tailor alerts to align with your network’s normal behavior, so you’re only notified when activity deviates from the expected range.
- Real-time alerts: LogicMonitor’s real-time alerts let you know the moment traffic deviates from set parameters. This instant feedback lets you respond quickly to potential issues, avoiding outages, slowdowns, or security vulnerabilities.
- Incident prioritization: By configuring alerts based on severity levels, you can prioritize responses according to the potential impact. You can set critical alerts to escalate instantly for immediate action, while you can document less urgent instances for review, keeping your team focused where they’re needed most.
- Performance tuning: Use historical data to fine-tune thresholds over time. Analyzing past trends helps optimize threshold settings, minimizing false alarms and improving accuracy for current network conditions.
Common network issues solved by NetFlow traffic analyzers
A NetFlow traffic analyzer is a powerful tool for spotting and resolving common network issues that can slow down or even compromise performance. Here’s a look at some of the most frequent network problems it addresses, along with how NetFlow data supports quick troubleshooting and issue resolution:
Bandwidth hogging
Heavy bandwidth usage, or “bandwidth hogging,” is a common culprit behind slow network speeds. NetFlow lets you see the heaviest bandwidth users, enabling your IT team to track which applications, devices, or users use the most resources. With this information, admins can adjust traffic flow to ensure everyone gets the necessary bandwidth.
Application slowdowns
Slow applications can get in the way of productivity. By analyzing NetFlow data, you can pinpoint the exact source of the slowdown, whether it’s high traffic volume, network latency, or misconfigured settings. With targeted data on hand, your team can quickly address the root cause of lagging applications and restore performance.
Network congestion and bottlenecks
Traffic congestion is especially common during peak usage times. NetFlow data highlights areas of high traffic density, helping admins identify and manage bottlenecks in real-time. By analyzing traffic flows across devices and interfaces, IT teams can reroute traffic or adjust resources to reduce congestion and keep data flowing smoothly.
Security threats and unusual activity
Unexpected traffic patterns can be an early warning sign of security threats, like DDoS attacks or unauthorized access attempts. NetFlow data enables IT teams to monitor and investigate unusual activity as it’s happening. With instant alerts and historical traffic records, teams can quickly detect, analyze, and shut down suspicious behavior before it escalates into a security breach.
Resource misallocation
Sometimes, network issues come down to how resources are allocated. NetFlow helps administrators track traffic by specific protocols or applications, enabling more precise resource distribution. By understanding actual usage patterns, IT can allocate bandwidth and prioritize applications more effectively, ensuring that critical services are always well supported.
In tackling these common network challenges, NetFlow’s data-driven insights let you respond proactively, keeping networks running efficiently and securely while reducing the risk of interruptions.
Take control of your network with NetFlow analysis
NetFlow for your network management is about staying proactive, enhancing performance, and making informed decisions based on real data. A NetFlow traffic analyzer equips your team with the insights they need to keep your networks operating securely and efficiently. With LogicMonitor’s AI-powered, customizable dashboards and threshold alerts, you’re fully prepared to track bandwidth usage, detect anomalies, and get ahead of issues before they impact the user experience.