OpenShift is a platform that allows developers, operations engineers, or even DevOps professionals to run containerized applications and workloads. It is best described as a cloud-based container orchestration platform, although an “on-prem” version is also possible.
Under the hood, it’s powered by Kubernetes, but an additional architectural layer makes life simpler for DevOps teams. OpenShift is from enterprise software specialist Red Hat and provides a range of automation options and lifecycle management, regardless of where you run your applications.
OpenShift architecture runs in any environment. The OS is usually Linux, but it also can use Centos. On top of that is the standard Kubernetes layer. However, there’s also an additional layer transforming Kubernetes into OpenShift.
OpenShift versions
Red Hat’s OpenShift container platform comes in a few different “flavors,” as IBM likes to call them. OKD or Origin Key Distribution powers an open-source version. OpenShift’s payable versions come with dedicated support, but only within the version lifecycle. For example, OpenShift 4.12 went live on January 17, 2023, and is supported until January 2025.
Why is OpenShift so popular?
OpenShift provides a range of enterprise-ready services straight out of the box. Plenty of other container orchestration services are available, such as Amazon EKS or the Google Kubernetes Engine (GKE). However, with any of these, businesses often need to invest in multiple additional services to make them useful as a full deployment and delivery solution.
OpenShift is a more desirable solution for enterprises that want to be able to build, deploy, and scale fast using a single platform.
How OpenShift differs from other container orchestration platforms
Other container orchestration platforms are aimed at everyone, from individual developers to SMEs, but OpenShift is marketed toward large enterprises. OpenShift empowers businesses to shift to cloud-native development and embrace continuous integration and delivery (CI/CD). Various levels of automation simplify day-to-day tasks and free up DevOps to spend time on other tasks. The platform includes features designed to facilitate faster deployment, plus a full suite of services.
Unlike many competitors, OpenShift provides extensive integrated services that support the full application lifecycle out of the box. Let’s examine a couple of popular OpenShift competitors.
- Docker Swarm is known for its simplicity and ease of use, appealing to smaller teams or projects that need straightforward container management without complex setup. However, it lacks the robust CI/CD capabilities and advanced security features that OpenShift offers.
- Amazon EKS and Amazon GKE provide scalable, cloud-native Kubernetes environments that are tightly integrated with their respective cloud platforms. While they offer powerful options for teams already using AWS or Google Cloud, they often require supplementary services. OpenShift’s all-in-one approach delivers built-in developer tools, automation for CI/CD, and strong multi-cloud and hybrid support.
Architectural components of OpenShift
OpenShift’s multi-layered architecture combines infrastructure and service layers with a structured node system to ensure flexibility, scalability, and performance across various environments.
Layer types
- Infrastructure layer: This foundational layer is the launchpad for deployment across physical, virtual, or cloud-based setups. Compatible with major public clouds like AWS, Azure, and GCP, it abstracts hardware quirks to provide a seamless environment for containerized apps.
- Service layer: Built on Kubernetes, the service layer powers OpenShift’s core. Packed with Red Hat’s integrated tools for monitoring, logging, and automation, it acts as a central command hub—managing networking, storage, and security. Plus, built-in CI/CD pipelines keep development and deployment fast and friction-free.
Node types
In OpenShift, nodes are the backbone of the cluster, working together to stay organized and efficiently manage workloads:
- Master nodes: The brains of the operation, master nodes handle API requests, coordinate workloads, and allocate resources across the infrastructure.
- Infrastructure nodes: Dedicated to essential service components, such as routing, image registries, and monitoring, infrastructure nodes free up worker nodes so they can focus solely on running your apps.
- Worker nodes: Running the containerized applications, worker nodes keep workloads balanced across the cluster to maintain high performance and ensure that reliability never wavers.
By combining these layers and nodes, OpenShift simplifies operational complexity without sacrificing scalability or security. This powerful mix lets enterprises confidently approach cloud-native development by utilizing built-in CI/CD, observability, and strong security practices to support every stage of the application lifecycle.
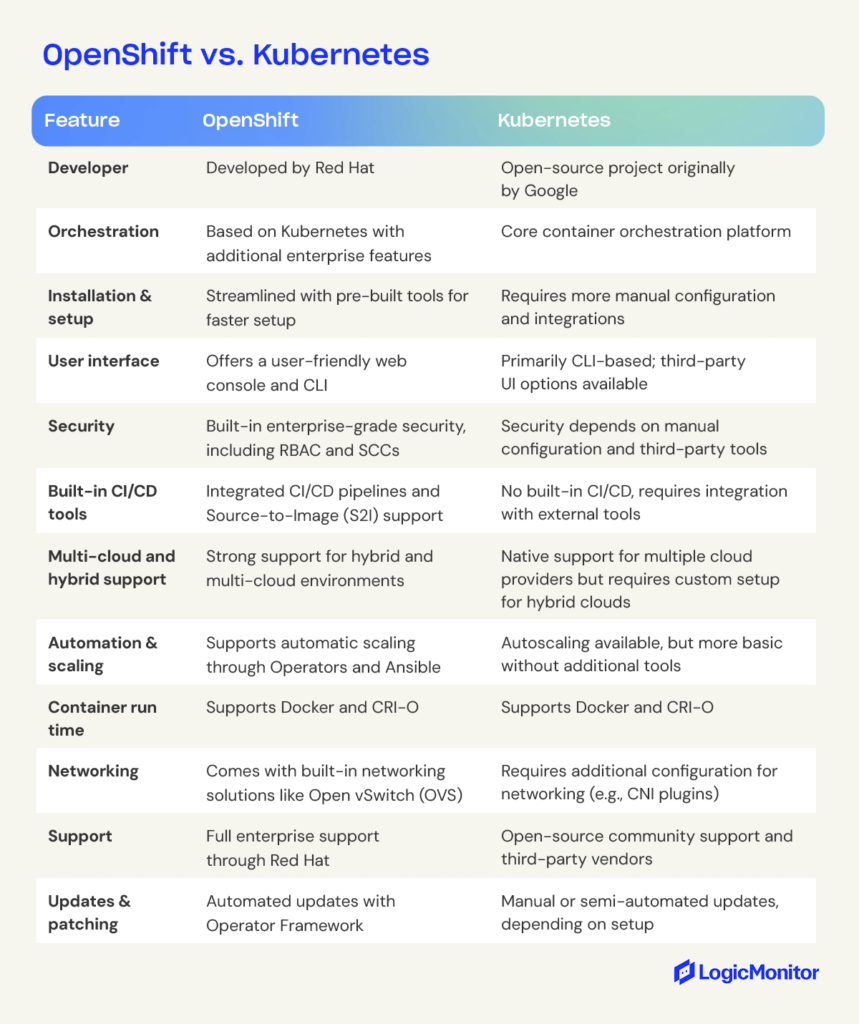
OpenShift vs. Kubernetes
Both OpenShift and Kubernetes offer powerful container orchestration, except OpenShift builds on Kubernetes with additional enterprise-ready features. Let’s take a closer look at how these platforms compare in terms of functionality, setup, and support.
Key features of OpenShift
OpenShift utilizes image streams to shift container images to the cluster. Image streams allow changes to occur via automation. Basically, as soon as any alteration occurs in the source code, an image stream allows a developer to push those changes through with minimal application downtime.
On the monitoring and automation side, OpenShift has some serious tools for streamlined management. Built-in monitoring dives deep into container performance, resource usage, and troubling issues you might encounter, helping DevOps pinpoint and remedy bottlenecks quickly.
On the automation side, OpenShift uses Operators and Ansible Playbooks to handle routine management tasks and scale infrastructure. Operators act like custom helpers that simplify deployment and maintenance, while Ansible Playbooks add scripting power, letting teams easily spin up new nodes or containers.
Since OpenShift is cloud-based, it plays well with any infrastructure, making it ideal for multi-platform development. Developers don’t have to constantly shift how they code to match different ecosystems. Plus, OpenShift includes upstream Kubernetes and Linux CoreOS, delivering an all-in-one solution right out of the box.
Best practices for monitoring
Built-in tools like Prometheus and Grafana are great for tracking container health and resource usage, while external tools like Dynatrace bring real-time insights and anomaly detection for enhanced observability. Dynatrace’s integration with OpenShift helps teams monitor app health, dependencies, and resource demands, giving them a proactive option for tackling issues.
With OpenShift 4.12, new features like IBM Secure Execution, pre-existing VPC setups, and custom cluster installations improve monitoring and automation capabilities, making it even better suited for the continual demands and unique needs of enterprise environments.
Benefits of OpenShift
One of OpenShift’s standout advantages is its support for hybrid and multi-cloud environments. This allows you to launch and manage applications seamlessly across a mix of on-prem, private, and public cloud environments. This flexibility helps avoid vendor lock-in, balance workloads between environments, and give you value for your cost with top-notch performance.
Seamless integration across platforms
OpenShift’s consistent Kubernetes-based foundation makes it easier to deploy, manage, and scale applications across cloud providers and on-premises data centers. With built-in automation tools like Operators and Ansible Playbooks, OpenShift maintains application consistency and performance across different platforms, providing users a uniform experience even in complex multi-cloud deployments.
Hybrid Cloud benefits
If your business embraces a hybrid cloud, OpenShift offers tools for optimizing resources and scaling applications between on-prem and cloud environments. Its hybrid support enables you to keep critical workloads on-prem while taking advantage of the cloud’s scalability and cost efficiency. OpenShift’s centralized management is all about simplicity and efficiency, giving DevOps cloud and on-prem resource management with a single console.
Streamlined operations
With its unified management console and automation features, OpenShift enables your team to deploy updates across multiple environments without needing custom solutions for each platform. This reduces operational overhead and helps you stay agile, making OpenShift a compelling option for organizations moving toward cloud-native development.
Use case example: financial services
A financial institution looking to maximize operational efficiency while meeting regulatory requirements could use OpenShift’s multi-cloud support to manage sensitive data in an on-prem environment while launching customer-facing applications in the cloud. This setup balances security with scalability, letting them respond rapidly to changing customer needs without compromising data protection.
Scaling with OpenShift
Scalability can be a challenge as apps acquire larger user bases or need to perform additional tasks. OpenShift supports the deployment of large clusters or additional hosts and even provides recommended best practices to assure persistent high performance even as applications grow. For example, the default cluster network is:
cidr 10.128.0.0/14
However, this network only allows clusters of up to 500 nodes. OpenShift documentation explains how to switch to one of the following networks:
10.128.0.0/12 or 10.128.0.0/10
These networks support the creation of clusters with more than 500 nodes.
OpenShift allows developers to create “stacks” of containers without reducing performance or speed.
OpenShift also utilizes other tools in its tech stack to support scaling, such as Ansible Playbooks. Ansible is an open-source infrastructure automation tool that Red Hat initially developed. By taking advantage of Ansible Playbooks, OpenShift allows developers to create a new host speedily and bring it into the cluster, simplifying scaling up or down.
OpenShift security
OpenShift is built with enterprise security in mind, supporting secure deployment and scaling while also protecting the development infrastructure. Considering cyberattacks surged by 30% year-over-year in Q2 2024, reaching an average of 1,636 attacks per organization per week, this is a key benefit for many developers.
With built-in support for Role-Based Access Control (RBAC) and Security Context Constraints (SCCs), OpenShift lets you enforce strict access control policies, giving only authorized users access to specific resources. OpenShift’s security framework also integrates seamlessly with many existing corporate identity management systems, providing Single Sign-On (SSO) capabilities that make user management even easier.
Automated security updates and patching
One of OpenShift’s most outstanding security features is its automated updates and patching. By making these tasks automatic, OpenShift reduces the possibility of security risks that tend to go along with outdated software versions or configurations. This reduces the likelihood of vulnerabilities in your production environments. Through frameworks like Operators, OpenShift manages updates for both the platform and applications it supports, enabling DevOps teams to keep security measures current with little to no manual intervention.
Network and data protection
OpenShift offers several powerful network security features, including encrypted communication between containers and stringent network traffic flow restriction policies to reduce exposure. It also offers data encryption both at rest and in transit, helping to keep sensitive information protected throughout its lifecycle.
Security across hybrid and multi-cloud environments
For organizations with hybrid and multi-cloud architectures, OpenShift ensures that security policies are consistent across environments, giving teams unified security protocols to manage applications. OpenShift’s multi-environment security supports compliance while retaining the flexibility of a hybrid cloud, making it especially valuable if your company handles sensitive data that has to comply with regulatory standards.
OpenShift use cases
OpenShift is ideal for modernizing existing apps as well as creating new ones. It transforms the deployment of upgrades and changes, allowing for effortless scaling. Because OpenShift runs on any cloud, it effectively future-proofs applications while ensuring they remain secure and stable. Use cases include:
- Lifting and shifting existing web apps into containerized environments
- Developing cloud-native applications
- Creating apps via distributed microservices
- Quickly add a new service or feature to an existing app
This last point is a key feature of continuous integration and continuous delivery (CI/CD) and is vital for retaining an engaged user base.
Industry use cases
OpenShift is widely adopted across industries, offering flexibility, security, and scalability that make it a top choice for diverse applications:
Financial services: Financial institutions benefit from OpenShift’s security features, ensuring compliance with GDPR and PCI DSS regulations. Banks can keep sensitive data secure on-premises by utilizing hybrid cloud capabilities while deploying customer-facing applications in the cloud. For example, a financial institution in Peru used OpenShift to regularly increase the number of services available to users, reducing the need for in-branch visits and cutting transaction costs by 3%.
Healthcare: Healthcare providers rely on OpenShift to maintain HIPAA compliance and secure patient data across on-premises and cloud environments. OpenShift’s RBAC, SCCs, and data encryption help keep patient data protected at all stages. Another helpful feature is OpenShift’s automated updating, which reduces the need for manual patching, freeing IT resources to focus on other critical tasks.
Retail: In retail, OpenShift empowers companies to build and scale e-commerce platforms quickly, providing a sturdy foundation for handling high traffic volumes during peak times. With CI/CD automation, retailers can update their online stores and integrate new features as often as necessary to keep up with market demands, giving their customers a more pleasant shopping experience.
Implementing continuous integration and delivery (CI/CD)
CI/CD is a growing development approach that uses automation to ensure app updates and adjustments happen as quickly as possible with minimal downtime. Containerized development environments already support continuous integration—the rapid testing and deployment of small code changes—by allowing tests to occur in isolation prior to deployment. Thanks to its simplified interface, OpenShift makes CI/CD pipelines even more efficient by reducing the risk of human error and helping developers maintain consistent processes.
Research shows that even though the benefits of CI/CD are clear, not all organizations are confident of their ability to make this shift. OpenShift could help businesses maximize their digital transformation efforts by empowering developers to embrace the CI/CD culture and get apps to users faster.
OpenShift provides templates for objects and utilizes Jenkins jobs and pipelines to improve automation and promote CI/CD for all application development and deployment. For those comparing Jenkins tools for CI/CD, this article on Jenkins vs. Jenkins X can help clarify which solution best fits your needs.
How to set up and deploy using an OpenShift cluster
Firstly, a developer or DevOps professional needs to get access to OpenShift. You can download and manage the free version yourself, but the fully managed version needs to be purchased from Red Hat. When you subscribe to a hosted version of OpenShift, you’ll get the secure credentials needed to deploy the OpenShift environment.
The simplest way to interact with OpenShift is via the web console. There is also an oc command-line tool.
Before deploying any application, you must create a “project.” This contains everything related to the application.
At this point, you can also use the web console to add collaborators.
You can deploy applications to OpenShift clusters via various methods, including:
- Using an existing container image hosted outside the OpenShift cluster
- Importing an existing container image into an image registry within the OpenShift cluster
- Using source code from a Git repository hosting service
OpenShift also provides templates to simplify the deployment of apps with multiple components. Within the template, you can set your own parameters to exercise complete control over the deployment process. To access these, use the console’s “Add to Project” function. There’s a whole section here dedicated to CI/CD.
To enter image stream tags, use the “Deploy Image” tab in the console or “oc new-app” in the CLI. You can monitor or even scale up from here by adding more instances of that container image.
Wrapping up
Red Hat provides extensive resources to support teams deploying and optimizing OpenShift, making it easier to get the best from this platform. With robust automation and security features and its support for hybrid and multi-cloud environments, OpenShift proves to be a powerful solution for modern app development and deployment. OpenShift enables you to confidently scale, secure, and streamline applications, creating an agile and resilient infrastructure that meets today’s evolving demands.
NetApp, formerly Network Appliance Inc., is a computer technology company specializing in data storage and management software.
Known for its innovative approach to data solutions, NetApp provides comprehensive cloud data services to help businesses efficiently manage, secure, and access their data across diverse environments. Alongside data storage, NetApp offers advanced management solutions for applications, enabling organizations to streamline operations and enhance data-driven decision-making across hybrid and multi-cloud platforms.
What is NetApp?
NetApp is a computer technology company that provides on-premises storage, cloud services, and hybrid data services in the cloud. Its hardware includes storage systems for file, block, and object storage. It also integrates its services with public cloud providers. NetApp’s services offer solutions for data management, enterprise applications, cybersecurity, and supporting AI workloads. Some of its main products include different storage software and servers.
NetApp has developed various products and services, and according to Gartner, was ranked the number one storage company in 2019. The following includes detailed definitions of NetApp’s key terms and services.
Azure NetApp is a popular shared file-storage service used for migrating POSIX-compliant Linux and Windows applications, HPC infrastructure, databases, SAP HANA, and enterprise web applications.
Why choose NetApp?
NetApp provides organizations with advanced data storage and management solutions designed to support diverse IT environments, from on-premises to multi-cloud. For businesses looking to enhance their infrastructure, NetApp offers several key advantages:
- Cost efficiency: NetApp’s tools help optimize cloud expenses, enabling companies to manage data growth without excessive costs, while its efficient storage solutions reduce overall spending.
- Scalability: Built to grow with your business, NetApp’s services seamlessly scale across cloud, hybrid, and on-premises environments, making it easier to expand as data needs evolve.
- Enhanced security: NetApp prioritizes data protection with features designed to defend against cyber threats, ensuring high levels of security for critical information.
- Seamless cloud integration: With strong support for leading cloud providers like Google Cloud Platform (GCP) and AWS, NetApp simplifies hybrid cloud setups and provides smooth data migration across platforms.
Understanding the dos and don’ts of NetApp monitoring can help you maximize its benefits. By selecting NetApp, IT professionals and decision-makers can leverage streamlined data management, improved performance, and flexible integration options that fit their organization’s unique needs.
What are NetApp’s key services?
NetApp offers several important services and products to help customers meet their data storage and management goals.
Ansible
Ansible is a platform for automating networking, servers, and storage. This configuration management system enables arduous manual tasks to become repeatable and less susceptible to mistakes. The biggest selling points are that it’s easy to use, reliable, and provides strong security.
CVO
CVO (Cloud Volumes ONTAP) is a type of storage delivering data management for block and file workloads. This advanced storage allows you to make the most of your cloud expenses while improving application performance. It also helps with compliance and data protection.
Dynamic Disc Pool
Dynamic Disc Pool technology (DDP) addresses the problem of RAID rebuild times and the potential increase in disk failure and reduced performance this may cause. DDP delivers prime storage solutions while maintaining performance. The technology can rebuild up to four times more quickly while featuring exceptional data protection. DDP allows you to group similar disks in a pool topology with faster rebuilds than RAID 5 or 6.
For more on monitoring disk performance and latency in NetApp environments, explore how LogicMonitor visualizes these metrics to optimize storage efficiency.
FAS
FAS (Fabric Attached Storage) is a unified storage platform in the cloud. FAS is one of the company’s core products. NetApp currently has six models of storage to choose from, allowing users to select the best model that meets their organization’s storage needs. These products consist of storage controllers with shelves made of hard disk enclosures. In some entry-level products, the storage controller contains the actual drives.
Flexpod
Flexpod is a type of architecture for network, server, and storage components. The components of a Flexpod consist of three layers: computing, networking, and storage. Flexpod allows users to select specific components, making it ideal for almost any type of business. Whether you’re looking for rack components or optimizing for artificial intelligence, Flexpod can help you put together the architecture your organization needs.
FlexCache
FlexCache offers remote simplified file distribution. It can also improve WAN usage with lower bandwidth costs and latency. You can distribute through multiple sites. FlexCache provides a more significant storage system ROI, improves the ability to handle workload increases, and limits remote access latency. It’s also easier to scale out storage performance with read-heavy applications. ONTAP Select running on 9.5 versions or later, FAS, and AFF support FlexCache.
OnCommand (OCI)
An OnCommand Insight Server (OCI) provides access to storage information and receives updates involving environment changes from acquisition units. The updates pass through a secure channel and then go to storage in the database. OCI can simplify virtual environments and manage complex private cloud systems. OCI allows analysis and management across networks, servers, and storage in both virtual and physical environments. It specifically enables cross-domain management.
OnCommand has two different Acquisition units. These are the Local Acquisition Unit (LAU), which you can install along with the OnCommand Insight Server, and the Remote Acquisition Unit (RAU). This one is optional. You can install it on a single remote server or several servers.
ONTAP
This is the operating system for hybrid cloud enhancement that helps with staffing, data security, and promoting future growth. New features for ONTAP include greater protection from ransomware, simplification for configuring security profiles, and more flexibility for accessing storage.
StorageGRID
If your organization has large data sets to store, StorageGrid is a solution that can help you manage the data cost-efficiently. StorageGrid offers storage and management for large amounts of unstructured data. You can reduce costs and optimize workflows when you place content in the correct storage tier. Some of the reviews for NetApp StorageGRID state that three of its best features are its valuable backup features, easy deployment, and cost-effectiveness.
Snapshot
Snapshots are designed to help with data protection but can be used for other purposes. NetApp snapshots are for backup and restoring purposes. When you have a snapshot backup, you save a specific moment-in-time image of the Unified database files in case your data is lost or the system fails. The Snapshot backup is periodically written on an ONTAP cluster. This way, you’ll have an updated copy.
Solidfire
Solidfire is one of NetApp’s many acquisitions, as it took over the company in January 2016. Solidfire uses the Element operating system for its arrays. This NetApp product provides all-flash storage solutions. SolidFire is not as successful as other products at NetApp; ONTAP, in particular, overshadows SolidFire. Some industry professionals may question how long SolidFire will continue as a NetApp product. So far, SolidFire is still a private cloud hardware platform.
Trident
Trident is an open-source project that can meet your container application demands. It utilizes Kubernetes clusters as pods. This offers exceptional storage services and allows containerized apps to consume storage from different sources. Trident provides full support as an open-source project and uses industry-standard interfaces. These interfaces include the Container Storage Interface.
NetApp’s integration with public cloud platforms
NetApp’s solutions are designed to support organizations working across hybrid and multi-cloud environments, offering seamless compatibility with major cloud providers like GCP and AWS. NetApp’s tools, including CVO and StorageGRID, enable efficient data management, transfer, and protection, ensuring that businesses can maintain control of their data infrastructure across platforms.
- CVO: CVO offers data management across cloud environments by combining NetApp’s ONTAP capabilities with public cloud infrastructure. This solution allows organizations to optimize cloud storage costs and manage data protection, compliance, and performance. For example, a company using CVO with GCP can streamline its data backup processes, reducing both costs and latency by storing frequently accessed data close to applications.
- StorageGRID: Designed for storing large amounts of unstructured data, StorageGRID enables multi-cloud data management with the flexibility to tier data across cloud and on-premises environments. By supporting object storage and efficient data retrieval, StorageGRID allows businesses to manage compliance and access requirements for big data applications. A healthcare organization, for example, could use StorageGRID to store and retrieve extensive medical records across both private and public cloud environments, ensuring secure and compliant access to data when needed.
With NetApp’s hybrid and multi-cloud capabilities, businesses can reduce the complexity of managing data across cloud platforms, optimize storage expenses, and maintain compliance, all while ensuring data accessibility and security across environments.
What are NetApp’s key terms?
To understand how NetApp works, it’s necessary to know some of its terminology and product selections. The following are some basic terms and products with brief definitions.
Aggregate
An aggregate is a collection of physical disks you can organize and configure to support various performance and security needs. According to NetApp, if your environment contains certain configurations, you’ll need to create aggregates manually. A few of these configurations include flash pool aggregates and MetroCluster configurations.
Cluster MTU
This feature enables you to configure MTU size by using an ONTAP Select multi-node cluster. An MTU is the maximum transmission unit size that specifies the jumbo frame size on 10 Gigabit interfaces as well as 1 Gigabit Ethernet. Using the ifconfig command, you can select the particular MTU size for transmission between a client and storage.
FlexVol Volume
FlexVol volumes are a type of volume that generally connects to each of its containing aggregates. Several FlexVol volumes can receive their storage sources from a single aggregate. Since these volumes are separate from the aggregates, you can dynamically change the size of each FlexVol volume without a disruption in the environment.
Initiator
An initiator is a port for connecting with a LUN. You can select an iSCSI hardware or software adapter or an FC. The ONTAP System Manager enables you to manage initiator groups. If you want to control which LIFs each initiator has access to, you can do this with portsets.
IOPS
IOPS measures how many Input/Output operations per second occur. You would generally use IOPS to measure your storage performance in units of bytes for read or write operations. You’ll sometimes need different IOP limits in various operations that are in the same application.
License Manager
This software component is part of the Deploy administration utility. This is an API you can use to update an IP address when the IP address changes. To generate a file, you need to use the License Lock ID (LLID) and the capacity pool license serial number.
LUN
LUNs are block-based storage objects that you can format in various ways. They work through the FC or iSCSI protocol. ONTAP System Manager is able to help you create LUNS if there is available free space. There are many ways you can use LUNs; for example, you might develop a LUN for a QTree, volume, or aggregate that you already have.
Multiple Cluster Systems
If you need an at-scale system for a growing organization, you’ll want to consider NetApp systems that have multiple clusters. A cluster consists of grouped nodes to create scalable clusters. This is done primarily to use the nodes more effectively and distribute the workload throughout the cluster. An advantage of having clusters is to provide continuous service for users even if an individual node goes offline.
ONTAP Select Cluster
You can create clusters with one, two, four, six, or even eight nodes. A cluster with only one node doesn’t produce any HA capability. Clusters with more than one node, however, will have at least one HA pair.
ONTAP Select Deploy
You can use this administration utility to deploy ONTAP Select clusters. The web user interface provides access to the Deploy utility. The REST API and CLI management shell also provide access.
Qtrees
Qtrees are file systems that are often subdirectories of a primary directory. You might want to use qtrees if you’re managing or configuring quotas. You can create them within volumes when you need smaller segments of each volume. Developing as many as 4,995 qtrees in each internal volume is possible. Internal volumes and qtrees have many similarities. Primary differences include that qtrees can’t support space guarantees or space reservations. Individual qtrees also can’t enable or disable snapshot copies. Clients will see the qtree as a directory when they access that particular volume.
Snapshot Copy
Snapshot copy is a read-only image that captures a moment-in-time of storage system volume. The technology behind ONTAP Snapshot enables the image to take up a minimum of storage space. Instead of copying data blocks, ONTAP creates Snapshot copies by referencing metadata. You can recover LUNS, contents of a volume, or individual files with a Snapshot copy.
SnapMirror
This replication software runs as a part of the Data ONTAP system. SnapMirror can replicate data from a qtree or a source volume. It’s essential to establish a connection between the source and the destination before copying data with SnapMirror. After creating a snapshot copy and copying it to the destination, the result is a read-only qtree or volume containing the same information as the source when it was last updated.
You will want to use SnapMirror in asynchronous, synchronous, or semi-synchronous mode. If at the qtree level, SnapMirror runs only in asynchronous mode. Before setting up a SnapMirror operation, you need a separate license and must enable the correct license on the destination and source systems.
Storage Pools
Storage pools are data containers with the ability to hide physical storage. Storage pools increase overall storage efficiency. The benefit is that you may need to buy fewer disks. The drawback is disk failure can have a ripple effect when several are members of the same storage pool.
System Manager
If you’re just beginning to use NetApp and need a basic, browser-based interface, you may want to consider the OnCommand System Manager. System Manager includes detailed tables, graphs, and charts for tracking past and current performance.
Discover the power of NetApp with LogicMonitor
NetApp provides valuable data and storage services to help your organization access and manage data throughout multi-cloud environments more efficiently. With various products and services, NetApp enables you to put together the data management and storage solutions that meet your organization’s needs.
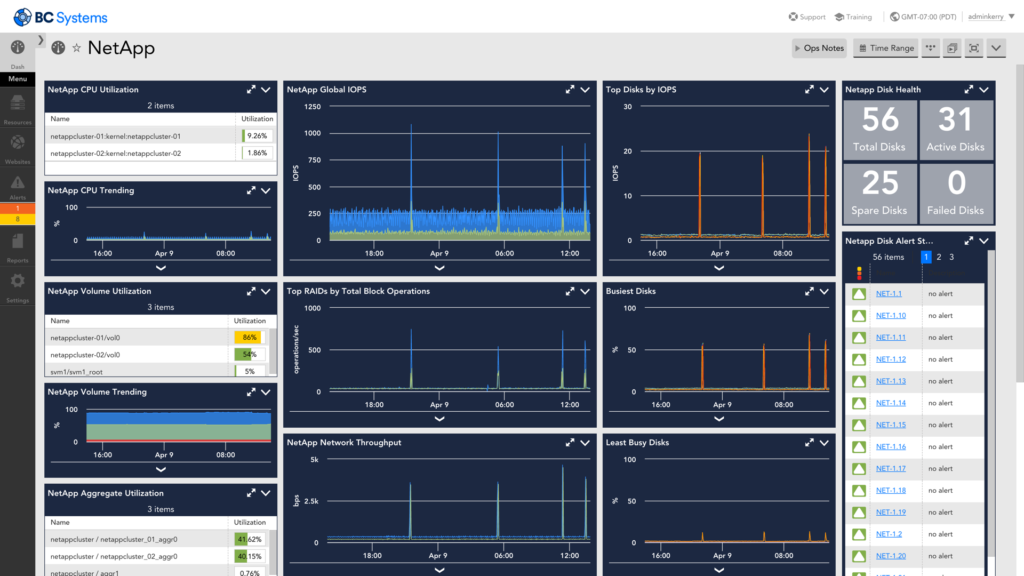
As a trusted NetApp technology partner, LogicMonitor brings automated, insightful monitoring to your NetApp environment. Transition seamlessly from manual tracking to advanced automated monitoring and gain access to essential metrics like CPU usage, disk activity, and latency analysis—all without configuration work.
With LogicMonitor’s platform, your team can focus on strategic goals, while LogicMonitor ensures efficient and precise monitoring across your NetApp systems, including ONTAP.
Monitoring once provided straightforward insights into IT health: you collected data, identified metrics to monitor, and diagnosed issues as they arose. However, as IT infrastructure evolves with cloud, containerization, and distributed architectures, traditional monitoring can struggle to keep pace. Enter observability, a methodology that not only enhances visibility but also enables proactive issue detection and troubleshooting.
Is observability simply a buzzword, or does it represent a fundamental shift in IT operations? This article will explore the differences between monitoring and observability, their complementary roles, and why observability is essential for today’s IT teams.
In this blog, we’ll cover:
- What is monitoring?
- What is observability?
- Key differences between monitoring vs. observability
- How observability and monitoring work together
- Steps for transitioning from monitoring to full observability
What is monitoring?
Monitoring is the practice of systematically collecting and analyzing data from IT systems to detect and alert on performance issues or failures. Traditional monitoring tools rely on known metrics, such as CPU utilization or memory usage, often generating alerts when thresholds are breached. This data typically comes in the form of time-series metrics, providing a snapshot of system health based on predefined parameters.
Key characteristics of monitoring:
- Reactive by nature: Monitoring often triggers alerts after an issue has already impacted users.
- Threshold-based alerts: Notifications are generated when metrics exceed specified limits (e.g., high memory usage).
- Primary goal: To detect and alert on known issues to facilitate quick response.
An example of monitoring is a CPU utilization alert that may notify you that a server is under load, but without additional context, it cannot identify the root cause, which might reside elsewhere in a complex infrastructure.
What is observability?
Observability goes beyond monitoring by combining data analysis, machine learning, and advanced logging to understand complex system behaviors. Observability relies on the three core pillars—logs, metrics, and traces—to provide a holistic view of system performance, enabling teams to identify unknown issues, optimize performance, and prevent future disruptions.
Key characteristics of observability:
- Proactive approach: Observability enables teams to anticipate and prevent issues before they impact users.
- Unified data collection: Logs, metrics, and traces come together to offer deep insights into system behavior.
- Root cause analysis: Observability tools leverage machine learning to correlate data, helping identify causation rather than just symptoms.
An example of observability: In a microservices architecture, if response times slow down, observability can help pinpoint the exact microservice causing the issue, even if the problem originated from a dependency several layers deep.
For a deeper understanding of what observability entails, check out our article, What is O11y? Observability explained.
Key differences of monitoring vs. observability
Monitoring and observability complement each other, but their objectives differ. Monitoring tracks known events to ensure systems meet predefined standards, while observability analyzes outputs to infer system health and preemptively address unknown issues.
| Aspect | Monitoring | Observability |
| Purpose | To detect known issues | To gain insight into unknown issues and root causes |
| Data focus | Time-series metrics | Logs, metrics, traces |
| Approach | Reactive | Proactive |
| Problem scope | Identifies symptoms | Diagnoses causes |
| Example use case | Alerting on high CPU usage | Tracing slow requests across microservices |
Monitoring vs. observability vs. telemetry vs. APM
Monitoring and observability are not interchangeable terms, but they do work together to achieve a common goal. Monitoring is an important aspect of an observability workflow, as it allows us to track the state of our systems and services actively. However, monitoring alone cannot provide the complete picture that observability offers.
Observability encompasses both monitoring and telemetry as it relies on these components to gather data and analyze it for insights into system behavior. Telemetry provides the raw data that feeds into the analysis process, while monitoring ensures that we are constantly collecting this data and staying informed about any changes or issues in our systems. Without telemetry and monitoring, observability cannot exist.
Application Performance Monitoring (APM) tools give developers and operations teams real-time insights into application performance, enabling quick identification and troubleshooting of issues. Unlike traditional monitoring, APM offers deeper visibility into application code and dependencies.
How monitoring and observability work together
Monitoring and observability are complementary forces that, when used together, create a complete ecosystem for managing and optimizing IT systems. Here’s a step-by-step breakdown of how these two functions interact in real-world scenarios to maintain system health and enhance response capabilities.
Monitoring sets the foundation by tracking known metrics
Monitoring provides the essential baseline data that observability builds upon. Continuously tracking known metrics ensures that teams are alerted to any deviations from expected performance.
- Example: Monitoring tools track key indicators like CPU usage, memory consumption, and response times. When any of these metrics exceed set thresholds, an alert is generated. This serves as the initial signal to IT teams that something may be wrong.
Observability enhances monitoring alerts with contextual depth
Once monitoring generates an alert, observability tools step in to provide the necessary context. Instead of simply reporting that a threshold has been breached, observability digs into the incident’s details, using logs, traces, and correlations across multiple data sources to uncover why the alert occurred.
- Example: If monitoring triggers an alert due to high response times on a specific service, observability traces can reveal dependencies and interactions with other services that could be contributing factors. Analyzing these dependencies helps identify whether the latency is due to a database bottleneck, network congestion, or another underlying service.
Correlating data across monitoring and observability layers for faster troubleshooting
Monitoring data, though essential, often lacks the detailed, correlated insights needed to troubleshoot complex, multi-service issues. Observability integrates data from various layers—such as application logs, user transactions, and infrastructure metrics—to correlate events and determine the root cause more quickly.
- Example: Suppose an e-commerce application shows a spike in checkout failures. Monitoring flags this with an error alert, but observability allows teams to correlate the error with recent deployments, configuration changes, or specific microservices involved in the checkout process. This correlation can show, for instance, that the issue started right after a specific deployment, guiding the team to focus on potential bugs in that release.
Machine learning amplifies alert accuracy and reduces noise
Monitoring generates numerous alerts, some of which are not critical or might even be false positives. Observability platforms, particularly those equipped with machine learning (ML), analyze historical data to improve alert quality and suppress noise by dynamically adjusting thresholds and identifying true anomalies.
- Example: If monitoring detects a temporary spike in CPU usage, ML within the observability platform can recognize it as an expected transient increase based on past behavior, suppressing the alert. Conversely, if it identifies an unusual pattern (e.g., sustained CPU usage across services), it escalates the issue. This filtering reduces noise and ensures that only critical alerts reach IT teams.
Observability enhances monitoring’s proactive capabilities
While monitoring is inherently reactive—alerting when something crosses a threshold—observability takes a proactive stance by identifying patterns and trends that could lead to issues in the future. Observability platforms with predictive analytics use monitoring data to anticipate problems before they fully manifest.
- Example: Observability can predict resource exhaustion in a specific server by analyzing monitoring data on memory usage trends. If it detects a steady increase in memory use over time, it can alert teams before the server reaches full capacity, allowing preventive action.
Unified dashboards combine monitoring alerts with observability insights
Effective incident response requires visibility into both real-time monitoring alerts and in-depth observability insights, often through a unified dashboard. By centralizing these data points, IT teams have a single source of truth that enables quicker and more coordinated responses.
- Example: In a single-pane-of-glass dashboard, monitoring data flags a service outage, while observability insights provide detailed logs, traces, and metrics across affected services. This unified view allows the team to investigate the outage’s impact across the entire system, reducing the time to diagnosis and response.
Feedback loops between monitoring and observability for continuous improvement
As observability uncovers new failure modes and root causes, these insights can refine monitoring configurations, creating a continuous feedback loop. Observability-driven insights lead to the creation of new monitoring rules and thresholds, ensuring that future incidents are detected more accurately and earlier.
- Example: During troubleshooting, observability may reveal that a certain pattern of log events signals an impending memory leak. Setting up new monitoring alerts based on these log patterns can proactively alert teams before a memory leak becomes critical, enhancing resilience.
Key outcomes of the monitoring-observability synergy
Monitoring and observability deliver a comprehensive approach to system health, resulting in:
- Faster issue resolution: Monitoring alerts IT teams to problems instantly, while observability accelerates root cause analysis by providing context and correlations.
- Enhanced resilience: Observability-driven insights refine monitoring rules, leading to more accurate and proactive alerting, which keeps systems stable under increasing complexity.
- Operational efficiency: Unified dashboards streamline workflows, allowing teams to respond efficiently, reduce mean time to resolution (MTTR), and minimize service disruptions.
In short, monitoring and observability create a powerful synergy that supports both reactive troubleshooting and proactive optimization, enabling IT teams to stay ahead of potential issues while maintaining high levels of system performance and reliability.
Steps for transitioning from monitoring to observability
Transitioning from traditional monitoring to a full observability strategy requires not only new tools but also a shift in mindset and practices. Here’s a step-by-step guide to help your team make a seamless, impactful transition:
1. Begin with a comprehensive monitoring foundation
Monitoring provides the essential data foundation that observability needs to deliver insights. Without stable monitoring, observability can’t achieve its full potential.
Set up centralized monitoring to cover all environments—on-premises, cloud, and hybrid. Ensure coverage of all critical metrics such as CPU, memory, disk usage, and network latency across all your systems and applications. For hybrid environments, it’s particularly important to use a monitoring tool that can handle disparate data sources, including both virtual and physical assets.
Pro tip:
Invest time in configuring detailed alert thresholds and suppressing false positives to minimize alert fatigue. Initial monitoring accuracy reduces noise and creates a solid base for observability to build on.
2. Leverage log aggregation to gain granular visibility
Observability relies on an in-depth view of what’s happening across services, and logs are critical for this purpose. Aggregated logs allow teams to correlate patterns across systems, leading to faster root cause identification.
Choose a log aggregation solution that can handle large volumes of log data from diverse sources. This solution should support real-time indexing and allow for flexible querying. Look for tools that offer structured and unstructured log handling so that you can gain actionable insights without manual log parsing.
Pro tip:
In complex environments, logging everything indiscriminately can quickly lead to overwhelming amounts of data. Implement dynamic logging levels—logging more detail temporarily only when issues are suspected, then scaling back once the system is stable. This keeps log data manageable while still supporting deep dives when needed.
3. Add tracing to connect metrics and logs for a complete picture
In distributed environments, tracing connects the dots across services, helping to identify and understand dependencies and causations. Tracing shows the journey of requests, revealing delays and bottlenecks across microservices and third-party integrations.
Adopt a tracing framework that’s compatible with your existing architecture, such as OpenTelemetry, which integrates with many observability platforms and is widely supported. Configure traces to follow requests across services, capturing data on latency, error rates, and processing times at each stage.
Pro tip:
Start with tracing critical user journeys—like checkout flows or key API requests. These flows often correlate directly with business metrics and customer satisfaction, making it easier to demonstrate the value of observability to stakeholders. As you gain confidence, expand tracing coverage to additional services.
4. Introduce machine learning and AIOps for enhanced anomaly detection
Traditional monitoring relies on static thresholds, which can lead to either missed incidents or alert fatigue. Machine learning (ML) in observability tools dynamically adjusts these thresholds, identifying anomalies that static rules might overlook.
Deploy an AIOps (Artificial Intelligence for IT Operations) platform that uses ML to detect patterns across logs, metrics, and traces. These systems continuously analyze historical data, making it easier to spot deviations that indicate emerging issues.
Pro tip:
While ML can be powerful, it’s not a one-size-fits-all solution. Initially, calibrate the AIOps platform with supervised learning by identifying normal versus abnormal patterns based on historical data. Use these insights to tailor ML models that suit your specific environment. Over time, the system can adapt to handle seasonality and load changes, refining anomaly detection accuracy.
5. Establish a single pane of glass for unified monitoring and observability
Managing multiple dashboards is inefficient and increases response time in incidents. A single pane of glass consolidates monitoring and observability data, making it easier to identify issues holistically and in real-time.
Choose a unified observability platform that integrates telemetry (logs, metrics, and traces) from diverse systems, cloud providers, and applications. Ideally, this platform should support both real-time analytics and historical data review, allowing teams to investigate past incidents in detail.
Pro tip:
In practice, aim to customize the single-pane dashboard for different roles. For example, give SREs deep trace and log visibility, while providing executive summaries of system health to leadership. This not only aids operational efficiency but also allows stakeholders at every level to see observability’s value in action.
6. Optimize incident response with automated workflows
Observability is only valuable if it shortens response times and drives faster resolution. Automated workflows integrate observability insights with incident response processes, ensuring that the right people are alerted to relevant, contextualized data.
Configure incident response workflows that trigger automatically when observability tools detect anomalies or critical incidents. Integrate these workflows with collaboration platforms like Slack, Teams, or PagerDuty to notify relevant teams instantly.
Pro tip:
Take the time to set up intelligent incident triage. Route different types of incidents to specialized teams (e.g., network, application, or database), each with their own protocols. This specialization makes incident handling more efficient and prevents delays that could arise from cross-team handoffs.
7. Create a feedback loop to improve monitoring with observability insights
Observability can reveal recurring issues or latent risks, which can then inform monitoring improvements. By continually refining monitoring based on observability data, IT teams can better anticipate issues, enhancing the reliability and resilience of their systems.
Regularly review observability insights to identify any new patterns or potential points of failure. Set up recurring retrospectives where observability data from recent incidents is analyzed, and monitoring configurations are adjusted based on lessons learned.
Pro tip:
Establish a formal feedback loop where observability engineers and monitoring admins collaborate monthly to review insights and refine monitoring rules. Observability can identify previously unknown thresholds that monitoring tools can then proactively track, reducing future incidents.
8. Communicate observability’s impact on business outcomes
Demonstrating the tangible value of observability is essential for maintaining stakeholder buy-in and ensuring continued investment.
Track key performance indicators (KPIs) such as MTTR, incident frequency, and system uptime, and correlate these metrics with observability efforts. Share these results with stakeholders to highlight how observability reduces operational costs, improves user experience, and drives revenue.
Pro tip:
Translating observability’s technical metrics into business terms is crucial. For example, if observability helped prevent an outage, quantify the potential revenue saved based on your system’s downtime cost per hour. By linking observability to bottom-line metrics, you reinforce its value beyond IT.
Embrace the power of observability and monitoring
Observability is not just an extension of monitoring—it’s a fundamental shift in how IT teams operate. While monitoring is essential for tracking known issues and providing visibility, observability provides a deeper, proactive approach to system diagnostics, enabling teams to innovate while minimizing downtime.
To fully realize the benefits of observability, it’s important to combine both monitoring and observability tools into a cohesive, holistic approach. By doing so, businesses can ensure that their systems are not only operational but also resilient and adaptable in an ever-evolving digital landscape.
Logging is critical for gaining valuable application insights, such as performance inefficiencies and architectural structure. But creating reliable, flexible, and lightweight logging solutions isn’t the easiest task—which is where Docker helps.
Docker containers are a great way to create lightweight, portable, and self-contained application environments. They also give IT teams a way to create impermanent and portable logging solutions that can run on any environment. Because logging is such a crucial aspect of performance, Docker dual logging is more beneficial in complex, multi-container setups that depend on reliable log management for troubleshooting and auditing.
Docker dual logging allows the capture of container logs in two separate locations at the same time. This approach ensures log redundancy, improved compliance, and enhanced operating system (like Windows, Linux, etc.) observability by maintaining consistent log data across distributed environments.
This guide covers the essentials of Docker logging, focusing on implementing Docker dual logging functionality to optimize your infrastructure.
What is a Docker container?
A Docker container is a standard unit of software that wraps up code and all its dependencies so the program can be moved from one environment to another, quickly and reliably.
Containerized software, available for Linux and Windows-based applications, will always run the same way despite the infrastructure.
Containers encapsulate software from its environment, ensuring that it performs consistently despite variations between environments — for example, development and staging.
Docker container technology was introduced as an open-source Docker Engine in 2013.
What is a Docker image?
A Docker image is a lightweight, standalone, executable software package that contains everything required to run an application: code, system tools, system libraries, and settings.
In other words, an image is a read-only template with instructions for constructing a container that can operate on the Docker platform. It provides an easy method to package up programs and preset server environments that you can use privately or openly with other Docker users.
What is Docker logging?
Docker logging refers to the process of capturing and managing logs generated by containerized applications. Logs provide critical insights into system behavior, helping you troubleshoot issues, monitor performance, and ensure overall application log health.
Combined with monitoring solutions, you can maintain complete visibility into your containerized environments, helping you solve problems faster and ensure reliability. Using other data insights, you can examine historical data to find trends and anticipate potential problems.
Docker container logs
What are container logs?
Docker container logs, in a nutshell, are the console output of running containers. They specifically supply the stdout and stderr streams running within a container.
As previously stated, Docker logging is not the same as logging elsewhere. Everything that is written to the stdout and stderr streams in Docker is implicitly forwarded to a driver, allowing accessing and writing logs to a file.
Logs can also be viewed in the console. The Docker logs command displays information sent by a currently executing container. The docker service logs command displays information by all containers members of the service.
What is a Docker logging driver?
The Docker logging drivers gather data from containers and make it accessible for analysis.
If no additional log-driver option is supplied when a container is launched, Docker will use the json-file driver by default. A few important notes on this:
- Log-rotation is not performed by default. As a result, log files kept using the json-file logging driver can consume a significant amount of disk space for containers that produce a large output, potentially leading to disk space depletion.
- Docker preserves the json-file logging driver — without log-rotation — as the default to maintain backward compatibility with older Docker versions and for instances when Docker is used as a Kubernetes runtime.
- The local driver is preferable because it automatically rotates logs and utilizes a more efficient file format.
Docker also includes logging drivers for sending logs to various services — for example, a logging service, a log shipper, or a log analysis platform. There are many different Docker logging drivers available. Some examples are listed below:
- syslog — A long-standing and widely used standard for logging applications and infrastructure.
- journald — A structured alternative to Syslog’s unstructured output.
- fluentd — An open-source data collector for unified logging layer.
- awslogs — AWS CloudWatch logging driver. If you host your apps on AWS, this is a fantastic choice.
You do, however, have several alternative logging driver options, which you can find in the Docker logging docs.
Docker also allows logging driver plugins, enabling you to write your Docker logging drivers and make them available over Docker Hub. At the same time, you can use any plugins accessible on Docker Hub.
Logging driver configuration
To configure a Docker logging driver as the default for all containers, you can set the value of the log-driver to the name of the logging driver in the daemon.json configuration file.
This example sets the default logging driver to the local driver:
{

  “log-driver”: “local”

}
Another option is configuring a driver on a container-by-container basis. When you initialize a container, you can use the –log-driver flag to specify a different logging driver than the Docker daemon’s default.
The code below starts an Alpine container with the local Docker logging driver:
docker run -it –log-driver local alpine ashThe docker info command will provide you with the current default logging driver for the Docker daemon.
Docker Logs With Remote Logging Drivers
Previously, the Docker logs command could only be used with logging drivers that supported containers utilizing the local, json-file, or journald logging drivers. However, many third-party Docker logging drivers did not enable reading logs from Docker logs locally.
When attempting to collect log data automatically and consistently, this caused a slew of issues. Log information could only be accessed and displayed in the format required by the third-party solution.
Starting with Docker Engine 20.10, you can use docker logs to read container logs independent of the logging driver or plugin that is enabled.
Dual logging requires no configuration changes. Docker Engine 20.10 later allows double logging by default if the chosen Docker logging driver does not support reading logs.
Where are Docker logs stored?
Docker keeps container logs in its default place, /var/lib/docker/. Each container has a log that is unique to its ID (the full ID, not the shorter one that is generally presented), and you may access it as follows:
/var/lib/docker/containers/ID/ID-json.log
docker run -it –log-driver local alpine ashWhat are the Docker logging delivery modes?
Docker logging delivery modes refer to how the container balances or prioritizes logging against other tasks. The available Docker logging delivery modes are blocking and non-blocking. Both the options can be applied regardless of what Docker logging driver you selected.
Blocking mode
When in blocking mode, the program will be interrupted whenever a message needs to be delivered to the driver.
The advantage of the blocking mode is that all logs are forwarded to the logging driver, even though there may be a lag in your application’s performance. In this sense, this mode prioritizes logging against performance.
Depending on the Docker logging driver you choose, your application’s latency may vary. For example, the json-file driver, which writes to the local filesystem, produces logs rapidly and is unlikely to block or create a significant delay.
On the contrary, Docker logging drivers requiring the container to connect to a remote location may block it for extended periods, resulting in increased latency.
Docker’s default mode is blocking.
When to use the blocking mode?
The json-file logging driver in blocking mode is recommended for most use situations. As mentioned before, the driver is quick since it writes to a local file. Therefore it’s generally safe to use it in a blocking way.
The blocking mode should also be used for memory-hungry programs requiring the bulk of the RAM available to your containers. The reason is that if the driver cannot deliver logs to its endpoint due to a problem such as a network issue, there may not be enough memory available for the buffer if it’s in non-blocking mode.
Non-blocking
The non-blocking Docker logging delivery mode will not prevent the program from running to provide logs. Instead of waiting for logs to be sent to their destination, the container will store logs in a buffer in its memory.
Though the non-blocking Docker logging delivery mode appears to be the preferable option, it also introduces the possibility of some log entries being lost. Because the memory buffer in which the logs are saved has a limited capacity, it might fill up.
Furthermore, if a container breaks, logs may be lost before being released from the buffer.
You may override Docker’s default blocking mode for new containers by adding an log-opts item to the daemon.json file. The max-buffer-size, which refers to the memory buffer capacity mentioned above, may also be changed from the 1 MB default.
{

        “log-driver”: “local”,

        “log-opts”: {

                “mode”: “non-blocking”

        }
}
Also, you can provide log-opts on a single container. The following example creates an Alpine container with non-blocking log output and a 4 MB buffer:
docker run -it –log-opt mode=non-blocking –log-opt max-buffer-size=4m alpineWhen to use non-blocking mode?
Consider using the json-file driver in the non-blocking mode if your application has a big I/O demand and generates a significant number of logs.
Because writing logs locally is rapid, the buffer is unlikely to fill quickly. If your program does not create spikes in logging, this configuration should handle all of your logs without interfering with performance.
For applications where performance is more a priority than logging but cannot use the local file system for logs — such as mission-critical applications — you can provide enough RAM for a reliable buffer and use the non-blocking mode. This setting should ensure the performance is not hampered by logging, yet the container should still handle most log data.
Why Docker logging is different from traditional logging
Logging in containerized environments like Docker is more complex than in traditional systems due to the temporary and distributed nature of containers. Docker containers generate multiple log streams, often in different formats, making standard log analysis tools less effective and debugging more challenging compared to single, self-contained applications.
Two key characteristics of Docker containers contribute to this complexity:
- Temporary containers: Docker containers are designed to be short-lived, meaning they can be stopped or destroyed at any time. When this happens, any logs stored within the container are lost. To prevent data loss, it’s crucial to use a log aggregator that collects and stores logs in a permanent, centralized location. You may use a centralized logging solution to aggregate log data and use data volumes to store persistent data on host devices.
- Multiple logging layers: Docker logging involves log entries from individual containers and the host system. Managing these multi-level logs requires specialized tools that can gather and analyze data from all levels and logging formats effectively, ensuring no critical information is missed. Containers may also generate large volumes of log data, which means traditional log analysis tools may struggle with the sheer amount of data.
Understanding Docker dual logging
Docker dual logging involves sending logs to two different locations simultaneously. This approach ensures that log data is redundantly stored, reducing the risk of data loss and providing multiple sources for analysis. Dual logging is particularly valuable in environments where compliance and uptime are critical.
Benefits of Docker dual logging
- Redundancy: Dual logging ensures that log messages are preserved even if one logging system fails and logging continues in case of service failure.
- Enhanced troubleshooting: With logs available in two places, cross-referencing data leads to diagnosing issues more effectively.
- Compliance: For industries with strict data retention and auditing requirements, dual logging helps meet these obligations by providing reliable log storage across multiple systems.
Docker dual logging in action
Docker dual logging is widely implemented in various industries to improve compliance, security, and system reliability. By implementing Docker dual logging, you can safeguard data, meet regulatory demands, and optimize your infrastructure. Below are some real-world examples of how organizations benefit from dual logging:
- E-commerce compliance: A global e-commerce company uses dual logging to meet data retention laws by storing log files both locally and in the cloud, ensuring regulatory compliance (such as GDPR and CCPA) and audit readiness.
- Financial institution security: A financial firm uses dual logging to enhance security by routing logs to secure on-premise and cloud systems, quickly detecting suspicious activities, aiding forensic analysis, and minimizing data loss.
- SaaS uptime and reliability: A SaaS provider leverages dual logging to monitor logs across local and remote sites, minimizing downtime by resolving issues faster and debugging across distributed systems to ensure high service availability.
How to implement Docker dual logging
Implementing dual logging in the Docker engine involves configuring containers to use multiple logging drivers. For example, logs can be routed to both a local JSON file and a remote logging service like AWS CloudWatch. Here’s a simple configuration file example:
bash

copy code

docker run -d \

  --log-driver=json-file \

  --log-driver=fluentd \

  --log-opt fluentd-address=localhost:24224 \

  your-container-image
The specific logging driver and other settings will vary based on your specific configuration. Look at your organization’s infrastructure to determine the driver names and the address of the logging server.
This setup ensures that logs are stored locally while also being sent to a centralized log management service. If you’re using Kubernetes to manage and monitor public cloud environments, you can benefit from the LogicMonitor Collector for better cloud monitoring.
Docker Daemon Logs
What are Daemon logs?
The Docker platform generates and stores logs for its daemons. Depending on the host operating system, daemon logs are written to the system’s logging service or a log file.
If you only collected container logs, you would gain insight into the state of your services. On the other hand, you need to be informed of the state of your entire Docker platform, and the daemon logs exist for that reason as they provide an overview of your whole microservices architecture.
Assume a container shuts down unexpectedly. Because the container terminates before any log events can be captured, we cannot pinpoint the underlying cause using the docker logs command or an application-based logging framework.
Instead, we may filter the daemon log for events that contain the container name or ID and sort by timestamp, which allows us to establish a chronology of the container’s life from its origin through its destruction.
The daemon log also contains helpful information about the host’s status. If the host kernel does not support a specific functionality or the host setup is suboptimal, the Docker daemon will note it during the initialization process.
Depending on the operating system settings and the Docker logging subsystem utilized, the logs may be kept in one of many locations. In Linux, you can look at the journalctl records:
sudo journalctl -xu docker.serviceAnalyzing Docker logs
Log data must be evaluated before it can be used. When you analyze log data, you’re hunting for a needle in a haystack.
You’re typically hunting for that one line with an error among thousands of lines of regular log entries. A solid analysis platform is required to determine the actual value of logs. Log collecting and analysis tools are critical. Here are some of the options.
Fluentd
Fluentd is a popular open-source solution for logging your complete stack, including non-Docker services. It’s a data collector that allows you to integrate data gathering and consumption for improved data utilization and comprehension.
ELK
ELK is the most widely used open-source log data analysis solution. It’s a set of tools:ElasticSearch for storing log data, Logstash for processing log data, and Kibana for displaying data via a graphical user interface.
ELK is an excellent solution for Docker log analysis since it provides a solid platform maintained by a big developer community and is free.
Advanced log analysis tools
With open-source alternatives, you must build up and manage your stack independently, which entails allocating the necessary resources and ensuring that your tools are highly accessible and housed on scalable infrastructure. It can necessitate a significant amount of IT resources as well.
That’s where more advanced log analysis platforms offer tremendous advantages. For example, tools like LogicMonitor’s SaaS platform for log intelligence and aggregation can give teams quick access to contextualized and connected logs and metrics in a single, unified cloud-based platform.
These sophisticated technologies leverage the power of machine learning to enable companies to reduce troubleshooting, streamline IT operations, and increase control while lowering risk.
Best practices for Docker dual logging
Docker dual logging offers many benefits. But to get the most out of it, you’ll need to implement best practices to build a reliable logging environment. Use the best practices below to get started.
- Monitor log performance: Regularly check the performance impact of dual logging on containers by gathering metrics like CPU usage and network bandwidth, and adjust configurations as necessary.
- Ensure log security: Use encryption and secure access controls when transmitting logs to remote locations, and verify your controls comply with regulations.
- Automate log management: implement automated processes to manage, review, and archive logs from devices ingesting logs to prevent storage issues.
Analyzing Docker logs in a dual logging setup
When logs are stored in two places, analyzing them becomes more complicated. Using log aggregation tools like Fluentd or ELK to collect and analyze logs from both sources provides a comprehensive view of a system’s behavior. This dual approach can significantly increase the ability to detect and resolve your issues quickly.
Overview of Docker logging drivers
Docker supports various logging drivers, each suited to different use cases. Drivers can be mixed and matched when implementing dual logging to achieve the best results for whole environments. Common drivers include:
- json-file: Stores logs in a JSON format on the local filesystem
- Fluentd: Sends logs to a Fluentd service, ideal for centralized logging
- awslogs: Directs logs to AWS CloudWatch, suitable for cloud-based monitoring
- gelf: Sends logs to in Graylog Extended Log Format for GrayWatch and Logstash endpoints
Tools and integration for Docker dual logging
To fully leverage Docker dual logging, integrating with powerful log management tools is essential. These popular tools enhance Docker dual logging by providing advanced features for log aggregation, analysis, and visualization.
- ELK Stack: An open-source solution comprising Elasticsearch, Logstash, and Kibana, ideal for collecting, searching, and visualizing log data.
- Splunk: A platform offering comprehensive log analysis and real-time monitoring capabilities suitable for large-scale environments.
- Graylog: A flexible, open-source log management tool that allows centralized logging and supports various data sources.
Conclusion
Docker dual logging is a powerful strategy for ensuring reliable, redundant log management in containerized environments. Implementing dual logging enhances your system’s resilience, improves troubleshooting capabilities, and meets compliance requirements with greater ease. As containerized applications continue to grow in complexity and scale, implementing dual logging will be critical for maintaining efficient infrastructures.
Familiarity with key abbreviations for incident management KPIs (Key Performance Indicators) is essential for effective performance analysis. In this article, we’ll explore calculating metrics like MTTR and MTBF, compare different metrics, and consider the role of software tools, such as CMMS and EAM systems, in managing and improving metrics like MTBF and MTTR.
Definitions of reliability metrics
What is MTTF?
MTTF stands for mean time to failure. It is the average lifespan of a given device. The mean time to failure is calculated by adding up the lifespans of all the devices and dividing it by their count.
MTTF = total lifespan across devices / # of devices
MTTF is specific to non-repairable devices, like a spinning disk drive; the manufacturer would talk about its lifespan in terms of MTTF.
For example, consider three dead drives pulled out of a storage array. S.M.A.R.T. indicates that they lasted for 2.1, 2.7, and 2.3 years, respectively.
(2.1 + 2.7 + 2.3) / 3 = ~2.37 years MTTF
We should probably buy some different drives in the future.
MTTF alternatively stands for mean time to fix, but it seems that “failure” is the more common meaning.
Related:
What is MTBF?
MTBF stands for the mean time between failures. MTBF is used to identify the average time between failures of something that can be repaired.
The mean time between failures is calculated by adding up all the lifespans of devices and dividing by the number of failures:
MTBF = total lifespan across devices / # of failures
The total lifespan does not include the time it takes to repair the device after a failure.
An example of MTBF would be how long, on average, an operating system stays up between random crashes.
Related:
What is MTTR?
MTTR stands for mean time to repair, mean time to recovery, mean time to resolution, mean time to resolve, mean time to restore, or mean time to respond. Mean time to repair and mean time to recovery seem to be the most common.
The mean time to repair (and restore) is the average time it takes to repair a system once the failure is discovered. It is calculated by adding the total time spent repairing and dividing that by the number of repairs.
MTTR (repair) = total time spent repairing / # of repairs
For example, let’s say three drives we pulled out of an array, two of which took 5 minutes to walk over and swap out a drive. The third one took 6 minutes because the drive sled was a bit jammed. So:
(5 + 5 + 6) / 3 = 5.3 minutes MTTR
The mean time to repair assumes that the failed system is capable of restoration and does not require replacement. It is synonymous with the mean time to fix.
Mean time to recovery, resolution, and resolve is the time it takes from when something goes down to when it is back and at full functionality. This includes everything from finding the problem, fixing it, and using technology (like CMMS and EAM systems) to analyze historical data and current assets to develop your maintenance strategy. In DevOps and ITOps, keeping MTTR to an absolute minimum is crucial.
MTTR (recovery) = total time spent discovery & repairing / # of repairs
The mean time to respond is the most basic of the bunch. The mean time to respond is the average time it takes to respond to a failure.
Related:
What is MTRS?
MTRS stands for the mean time to restore service. It is the average time it takes from when something that has failed is detected to the time that it is back and at full functionality. MTRS is synonymous with mean time to recovery and is used to differentiate mean time to recovery from mean time to repair. MTRS is the preferred term for mean time to recovery, as it’s more accurate and less confusing, per ITIL v4.
MTRS = total downtime / # of failures
Let’s take an example of an organization that suffered from four outages. The downtime for each failure is the following:
- Outage 1: 3 hours
- Outage 2: 2 hours
- Outage 3: 4 hours
- Outage 4: 1 hour
First, calculate the total downtime experience: 3 + 2 + 4 + 1 = 10 hours
After that, divide the total downtime by the number of outages: 10 / 4 = 2.5 hours
That gives you an MTRS of 2.5 hours, which may need improvement depending on how vital your services are.
For example, if the service going down is a payment system, whether online payments or in-store payments with a POS, you don’t want those systems down for several hours at a time.
Related:
What is MTBSI?
MTBSI stands for mean time between service incidents and is used to measure reliability. MTBSI is calculated by adding MTBF and MTRS together.
MTBSI = MTBF + MTRS
Here’s an example of an enterprise’s database server. Over a span of several weeks, you collect the following information:
- MTBF: 300 hours
- MTRS: 4 hours
To calculate your MTBSI, just add those numbers: 300 + 4 = 304 hours
This means your database server will experience an incident, on average, every 304 hours. This metric will help your maintenance team assess your server’s reliability and look for opportunities to improve uptime.
After all, you don’t want critical applications going down too often when your team relies on them being online.
What is MTTD?
MTTD stands for mean time to detect. This is the average time it takes you, or more likely a system, to realize that something has failed. MTTD can be calculated by adding up all the times between failure and detection and dividing them by the number of system failures.
MTTD = total time between failure & detection / # of failures
MTTD can be reduced with a monitoring platform capable of checking everything in an environment. With a monitoring platform like LogicMonitor, MTTD can be reduced to a minute or less by automatically checking everything in your environment for you.
Related:
What is MTTI?
MTTI stands for mean time to identify. Mean time to identify is the average time it takes for you or a system to identify an issue. You can calculate the MTTI by adding the total time from discovering an issue to identifying the solution and dividing that number by the total number of occurrences.
MTTI = total time from issue occurrence to identification / number of issues
For example, let’s look at an example where your organization is responsible for maintaining a web application. Over the course of a month, you identify four instances of poor performance:
- Occurrence 1: issue identified in 35 minutes
- Occurrence 2: issue identified in 20 minutes
- Occurrence 3: issue identified in 10 minutes
- Occurrence 4: issue identified in 15 minutes
Start by calculating the total time to identify your web issues: 35 + 20 + 10 + 15 = 80 minutes
Then divide by the number of issues (80 / 4 = 20) to get 20 minutes as the MTTI to identify issues. For critical applications, you may want to reduce this by adding real-time monitoring to gather data about your IT infrastructure, creating alerts to notify your team about issues that may contribute to an occurrence, and training your team to interpret monitoring data.
Related:
What is MTTK?
MTTK stands for mean time to know. MTTK is the time between when an issue is detected and when the cause of that issue is discovered. In other words, MTTK is the time it takes to figure out why an issue happened. To calculate this, determine the amount of time it takes your team to identify the root cause of problems and divide it by the number of problems encountered.
MTTK = total time from issue detection to root cause identification / number of issues
For example, imagine that your organization maintains critical infrastructure for customers (such as a SaaS service) that they rely on to function. Any downtime will lead to dissatisfaction and a potential loss of revenue.
You measure your MTTK to determine how quickly your team gets services back online. Your team has the following identification times over the course of a month:
- Issue 1: 1.5 hours
- Issue 2: 1.75 hours
- Issue 3: 1 hour
You can calculate your MTTK with the following: 1.5 hours + 1.75 hours + 1 hour / 3 incidents = 1.42 MTTK
Knowing this number will help you determine how effective the process your team uses to diagnose processes is. You can then look for areas to optimize to reduce your MTTK.
What is MDT?
MDT stands for mean downtime. It is simply the average period that a system or device is not working. MDT includes scheduled downtime and unscheduled downtime. In some sense, this is the ultimate KPI. The goal is 0. Improving your mean time to recovery will ultimately improve your MDT.
MDT = total downtime / number of events
Let’s take an example of a critical application your IT team supports. Over the course of a month, you experience the following downtimes:
- Instance 1: 2 hours
- Instance 2: 30 minutes
- Instance 3: 1 hour
- Instance 4: 25 minutes
Calculate the MDT by adding the total time and the number of instances: (120 + 30 + 60 + 25) / 4 = 58.75 minutes
Depending on when those downtimes occur, your team may need to look for optimizations to reduce them—or if they are planned downtime, make sure they occur during off hours when demand is reduced.
What is MTTA?
MTTA stands for mean time to acknowledge. It is the average time from when a failure is detected to when work begins on the issue.
MTTA = total time to acknowledge detected failures / # of failures
Imagine the 100-meter dash. The starting horn sounds; you detect it a few milliseconds later. After a few more milliseconds, your brain has acknowledged the horn by making your legs start running. Measure that 100 times, divide by 100, voila, MTTA.
This KPI is particularly important for on-call DevOps engineers and anyone in a support role. DevOps engineers need to keep MTTA low to keep MTTR low and to avoid needless escalations. Support staff needs to keep MTTA low to keep customers happy. Even if you’re still working toward a resolution, customers want to know their issues are acknowledged and worked on promptly.
Related:
What is MTTV?
MTTV stands for the mean time to verify. Mean time to verify is typically the last step in mean time to restore services, with the average time from when a fix is implemented to having that fix verified that it is working and has solved the issue.
MTTV = total time to verify resolution / # of resolved failures
You can improve this KPI in your organization by automating verification through unit tests at the code level or with your monitoring platform at the infrastructure, application, or service level.
Metric comparisons
MTTR vs MTBF
MTBF (Mean Time Between Failures) measures the time a system operates before failure, indicating its reliability and helping plan maintenance schedules. MTTR (Mean Time to Repair) measures the time it takes to repair a system after failure, focusing on minimizing downtime and repair costs. Simply put, MTBF evaluates reliability, while MTTR measures repair efficiency.

Calculating MTTR and MTBF
Let’s say an IT team manages several servers with a total number of 10 assets. During that time:
- Total operational time: 720 hours (24 hours x 30 days) for each server, for 7,200 total hours
- Number of failures: 5 server failures
- Total repair time: 15 hours for repairs
Starting with MTBF, start with the total number of operational hours and divide it by the number of failures: 7,200 / 5 = 1,400 hours
This means you have an average of 1,400 hours of uptime before you experience a server failure that leads to unscheduled downtime.
Calculating MTTR, on the other hand, tells you how well your team handles repairs and how quickly they get the servers back online.
To calculate this, take the total repair time and divide it by the number of repairs: 15 hours / 5 repairs = 3 hours
These calculations will help you understand how often downtime occurs, how long it takes to bring services online, and how often you can expect it to happen each month.
Improving MTTR and MTBF
These calculations will also help your team improve maintenance schedules to address these problems, reducing total downtime and the number of incidents. Predictive and preventative maintenance strategies can be implemented to catch potential issues before they become major problems, increasing MTBF and decreasing MTTR.
Implementing redundancies and fault tolerance measures can also greatly improve both MTBF and MTTR. By having backup systems in place, downtime due to hardware failures can be minimized or even eliminated.
MTTF vs MTBF
The main difference between MTTF and MTBF is how each is resolved, depending on what failure happened. In MTTF, what is broken is replaced, and in MTBF, what is broken is repaired.
MTTF and MTBF even follow the wording naturally. “To failure” implies it ends there, while “between failures” implies there can be more than one.
In many practical situations, you can use MTTF and MTBF interchangeably. Lots of other people do.
The remedy for hardware failures is generally replacement. Even if you’re repairing a problematic switch, you’re likely replacing a failed part. Something like an operating system crash still requires something that could be considered a “repair” instead of a “replacement.”
MTTF and MTBF are largely the concerns of vendors and manufacturers. You can’t change the MTTF on a drive, but you can run them in a RAID and drive down MTTR for issues within your infrastructure.
You generally can’t directly change your hardware’s MTTF or MTBF. Still, you can use quality components, best practices, and redundancy to reduce the impact of failures and increase the overall service’s MTBF.
MTTD vs MTTI
The mean time to detect and the mean time to identify are mostly interchangeable, depending on your company and the context.
MTTD vs MTTA
Detecting and acknowledging incidents and failures are similar but often differentiate themselves in the human element. MTTD is most often a computed metric that platforms should tell you.
For instance, in the case of LogicMonitor, MTTD would be the average time from when a failure happened to when the LogicMonitor platform identified the failure.
MTTA takes this and adds a human layer, taking MTTD and having a human acknowledge that something has failed.
MTTA is important because while the algorithms that detect anomalies and issues are incredibly accurate, they are still the result of a machine-learned algorithm. A human should make sure that the detected issue is indeed an issue.
MTTF (failure) vs MTTR: Mean time to failure vs Mean time to repair
Mean time to failure typically measures the time in relation to a failure. Mean time to repair measures how long it takes to get a system back up and running. This makes for an unfair comparison, as what is measured is very different.
Let’s take cars as an example. Let’s say your 2006 Honda CR-V gets into an accident. MTTF could be calculated as the time from when the accident occurred to the time you got a new car. MTTR would be the time from when the accident occurred to when the car was repaired.
MTTF (fix) vs MTTR: Mean time to fix vs mean time to repair
Mean time to fix and mean time to repair can be used interchangeably. The preferred term in most environments is mean time to repair.
MTRS vs MTTR: Mean time to restore service vs mean time to repair
The mean time to restore service is similar to the mean time to repair service, but instead of using the time from failure to resolution, it only covers the time from when the repairs start to when full functionality is restored.
In general, MTTR as a KPI is only so useful. It will tell you about your repair process and its efficiency, but it won’t tell you how much your users might be suffering. If it takes 3 months to find the broken drives, and they are slowing down the system for your users, 5.3 minutes MTTR is not useful or impressive.
Typically, customers care about the total time devices are down much more than the repair time. They want to be down as little as possible. For the sake of completeness, let’s calculate this one too:
((5 + 5 + 6) + ( 3 + 3 + 3) ) / 3 = 8.3 minutes MTTR
In general, the MTTR KPIs will be more useful to you as an IT operator.
The role of CMMS and EAM systems in managing reliability metrics
Computerized Maintenance Management Systems (CMMS) and Enterprise Asset Management (EAM) software are essential tools available to your team that will help them track reliability and failure metrics. They offer many features that help, including:
- Maintenance scheduling: Automate preventative maintenance tasks to reduce unexpected breakdowns
- Asset performance monitoring: Track your company’s assets in real-time to detect issues early
- Data analysis and reporting: See insights from historical data to make informed decisions and predict future performance
These tools will help your organization move from a reactive approach to a proactive one, where you stay ahead of problems and minimize downtime.
From ambiguity to action: Defining KPIs for better outcomes
When an incident occurs, time is of the essence. These KPIs, like MTTF, MTTD, MTTR, and MTBF, can help you gain better insight into your remediation processes and find areas to optimize.
Unfortunately, because each KPI has subtle similarities, many meanings differ from company to company. For example, MTTF and MTBF both tell you how long you can expect a device to stay online before failing, but MTTF is often used to identify how long a device takes to break (instead of offline for repair).
If these initialisms come up in a meeting, I suggest clarifying the meaning with the speaker—eventually solidifying these definitions in your organizations to avoid confusion. Otherwise, you might be DOA.
Organizations of all sizes have a complex array of hardware, software, staff, and vendors. Each of those assets comes with complex configurations and relationships between them. Visualizing and tracking these configurations and relationships over time is critical to quickly responding to incidents. Plus, it helps inform business decisions, especially regarding future IT components and upgrades.
Any organization familiar with the ITIL framework will know the term configuration management database (CMDB). This unique database aims to track a company’s assets and all of the complex relationships between them. However, designing a configuration management database is not that easy. You must consider what to include, how to find it, the intricacies of maintaining it, and everything in between.
Are you interested in implementing a configuration management database in your IT department, or need help improving a CMDB project gone wrong? If so, this guide will help you find a feasible solution to maintain and make it accessible to everyone who needs it.
What is a CMDB?
A configuration management database (CMDB) is unlike other databases because it’s designed entirely for internal management and control purposes. A CMDB acts as a central repository. It’s used to track and control the relationships between various IT assets and their established configurations. For any company implementing the Information Technology Infrastructure Library (ITIL) framework, a CMDB is crucial to IT processes.
The ITIL framework lays out many crucial IT standards and processes. These pertain to incident response, availability, deployment management, and other key activities. The framework makes suggestions to help better align these IT activities with business objectives. Doing so recognizes that the most up-to-date and accurate information must inform these processes and the resulting decisions. So, to execute the framework, IT departments require good configuration management. That means enlisting the help of a CMDB.
Configuration management aims to give a team the context it needs to evaluate an asset. Instead of viewing it in a silo, the IT department can look at the CMDB to see how it relates to other assets. They can then see how changing its configuration will impact the organization. This information allows IT managers and administrators to make better-informed decisions. Thus, a CMDB helps plan releases, deploy new components, and respond to incidents.
For example, if something disrupts the business’s network and impacts all workstations in a given department, an IT administrator would have difficulty manually tracking down the routers and servers involved in the issue. This would lead to a great deal of trial and error or information hunting just to start step one of resolving the issue. On the other hand, if that administrator has a CMDB to reference, they can immediately figure out the routers, servers, and other infrastructure involved.
Even with a basic example such as this, it’s clear to see that a CMDB is incredibly valuable for IT professionals. CMDBs will take time to set up and maintain. However, their ability to speed up incident resolution, simplify deployments, and better inform IT decisions means the investment will pay off rapidly.
Why is a CMDB important?
The role of a CMDB in the IT department is clear. With all of the information in front of them, an IT professional can better make decisions pertaining to incident resolution, system updates, and infrastructure upgrades. The result is more efficient resource utilization and less trial-and-error. In turn, that helps the entire organization continue running smoothly.
In addition to giving IT insight into how an organization’s data assets are being controlled and connected, a CMDB also reveals data that are siloed in various departments. This information helps organizations restore accessibility and visibility at scale. A CMDB improves data governance. In turn, that helps support the mission-critical activities of the company’s planners, accountants, and operations staff.
- The IT department is empowered to resolve issues more quickly by understanding the connections between affected systems at a glance. Likewise, they have the information they need to inform decisions. Integrations, upgrades, and deployments happen more smoothly. Visibility minimizes issues and downtime.
- The planning department needs the CMDB in order to plan high-level enterprise architecture. Technology managers also need the insights a CMDB provides to manage assets and capacity at a more granular level.
- The accounting department requires a more detailed overview of various assets and their associated costs. This supports accurate billing and budgeting.
- The operations department relies on the CMDB to inform about changes and incident management. The CMDB helps identify root causes, changes, risks, and other key indicators. The Ops team needs this information to prevent issues and keep processes running smoothly.
As you can see, the CMDB’s role has a far-reaching impact that ultimately touches every facet of an organization. A lack of visibility will directly impact operations, compliance, and reporting. That’s why implementing CMDB helps businesses overcome inefficiencies.
How do CMDBs work?
CMDBs work by gathering data from different sources and storing information about IT assets and other configuration items in a commonplace that is easily accessible. Even for a small company, CMDBs are necessary. Once an IT department begins analyzing all of its assets and the complicated relationships between them, it will discover a substantial amount of information that must be stored. Plus, that information needs to be updated often.
Using a CMDB is regarded as the most efficient way to store IT information. After all, it can track complicated configurations, relationships, and dependencies with ease. When designing a CMDB, you should plan to enter all known assets. These assets are referred to as “configuration items” (CIs). Once all assets are entered, it is then the responsibility of the IT department to connect the dots. That means defining the various relationships between the CIs.
There are several assets that a department may need to track. Some examples include hardware, software, documentation, and vendors. Both manual and automated tools exist to help IT departments discover their assets and the relationships between them. While it’s not possible to achieve and maintain complete accuracy, departments should strive to keep the CMDB as up-to-date as possible. If it’s not updated, the CMDB won’t be able to serve its purpose effectively.
Regarding who should be in charge of creating the CMDB, it’s a group effort. Once the CIs have been identified, their respective owners should be brought into the process as early as possible. These individuals will hold helpful knowledge about the asset and its complex relationships. The involvement of these stakeholders helps to make sure that the CMDB is accurate and complete.
Once data has been brought into the CMDB, the challenge becomes maintaining it. Certain characteristics set a good, usable CMDB apart from those ultimately not maintained. Failing to prioritize these characteristics could mean the CMDB is eventually abandoned due to inefficiencies and resource consumption.
Real-time monitoring and incident management with a CMDB
A CMDB plays a pivotal role in real-time monitoring by providing IT teams with a centralized view of all CIs and their relationships. When integrated with monitoring and automation tools, a CMDB can continuously track the health of critical IT assets, proactively alerting teams to potential issues and reducing the time to resolution.
For instance, suppose a network disruption impacts multiple assets. A CMDB enables IT administrators to quickly identify the affected routers, servers, and applications by viewing dependency mappings. This view accelerates root cause analysis, allowing teams to isolate the issue and focus on specific CIs instead of manually troubleshooting a broad network.
Additionally, CMDBs integrated with AIOps can automatically trigger responses for certain incidents. This functionality allows IT teams to automate routine responses, freeing up resources to focus on high-priority tasks. With automated workflows, the CMDB can also log incident data, providing an audit trail that supports compliance and continuous improvement.
Incorporating real-time monitoring through a CMDB thus enhances an IT department’s ability to manage incidents effectively and maintain system stability, ultimately minimizing downtime and improving service reliability.
Characteristics of a CMDB
Now, you have a big-picture understanding of how a CMDB works and the role it plays in IT and the ITIL framework. However, it’s also important to approach it in a more practical sense. A CMDB may store hundreds, if not thousands, of CIs. How are these discovered, maintained, and utilized on a day-to-day basis? That depends on the exact features and characteristics of the CMDB you’re designing.
The first characteristics that need to be identified relate to the creation and maintenance of the database itself. Departments will need to pull in data manually and with API-driven integrations. There should also be automation involved. Without automated discovery, accurately creating and maintaining the CMDB will prove challenging. So, incorporating scanning tools into the CMDB should be a top priority.
During the creation and throughout its use, the department needs to maintain a graphical representation of all the CIs in the database. You should be able to see how CIs are dependent on each other at a glance. This is known as service mapping. Some CMDB tools can generate a service map automatically.
By providing a clear, visual representation of these dependencies, service mapping helps IT teams quickly understand the relationships between configuration items (CIs). This level of visibility is critical when planning changes, as it allows teams to assess the potential impact on interconnected systems before implementation. For example, if a critical server is scheduled for an update, service mapping instantly shows which applications and services depend on that server. This insight minimizes the risk of unforeseen IT outages, allowing for smoother change management.
Once established, a CMDB should be intuitive, accessible, and visual whenever possible. This starts by implementing dashboards that track specific metrics about the CIs and their relationships. For instance, IT departments should be able to pinpoint how a change or release impacts the health of relevant CIs. The dashboard should also reveal patterns in incident reports, outstanding issues, and associated costs.
The IT department should also have visibility into compliance, especially when working at the enterprise level. Auditors need to know the state of CIs and have access to historical incidents and changes. For that reason, transparency and reporting are critical characteristics of a CMDB.
Enabling users to gain access to the database is critical, limiting what they can view and change. For that reason, access controls are another essential characteristic. A lack of access controls will lead to significant data integrity and compliance challenges.
Implementing a CMDB presents several additional challenges, including cultural differences, relevance, centralization, accuracy, processes, and tool-related issues. These obstacles can complicate the implementation process and impede the realization of its full benefits.
As you can see, the design of a CMDB can grow very complicated very fast. This is why the IT department must gather key stakeholders. Teams must discuss the organization’s compliance needs and other considerations before they implement a CMDB. With a well-informed team in place, a business is empowered to design underlying infrastructure that’s feasible to maintain and use daily.
Once established, a CMDB should be intuitive, accessible, and visual whenever possible. Dashboards tracking metrics about CIs and their relationships can enhance team-wide understanding of the IT infrastructure. These visual aids not only help pinpoint the impact of changes but also improve cross-departmental communication by presenting complex dependencies in a user-friendly way.
Should you implement CMDB monitoring?
Implementing a CMDB helps organizations manage their assets and regain visibility into their data and infrastructure. Any organization following the ITIL framework needs a CMDB. However, smaller companies may feel that they will not be able to realize great value from one.
In truth, companies of all sizes—including small businesses—are finding that a CMDB is becoming more important. No matter the size of your operations, you are not exempt from complying with data privacy and protection regulations. As data governance standards grow more strict, visibility is crucial.
In addition, a CMDB helps companies improve the observability of their systems. Even smaller companies struggle as data and assets become more distributed across the cloud, on-premises, and third-party applications. With all that in mind, a CMDB is likely a worthy investment for your business.
The good news is that you do not have to build your CMDB from scratch. Several solution providers can help your company establish a CMDB. They even have the associated dashboards, tracking, and access controls. The result is a CMDB that’s easier to implement, use, and maintain. Achieving that reality takes the right partners.
CMDB implementation and maintenance tips
Implementing a CMDB may seem daunting, but starting with a focused approach can set the foundation for long-term success. Begin with the critical assets and CIs that have the most impact on daily operations. By establishing the core components first, your team can gradually expand the CMDB’s scope over time as more data and resources become available.
Involve key stakeholders early in the process to ensure accuracy and completeness. Each department typically has unique insights into its assets, making their involvement essential for identifying dependencies and asset relationships accurately. These stakeholders not only provide valuable information during the setup but also contribute to ongoing maintenance.
Automation is a cornerstone of effective CMDB management, particularly as IT environments grow in complexity. Automated discovery tools help keep asset information up-to-date, reducing the risk of outdated or incomplete data. When combined with regular review schedules, automation ensures that the CMDB remains a reliable source of truth for configuration and asset management.
IT Asset Management (ITAM) also plays a crucial role in managing IT infrastructure. While CMDB focuses on the technical details and relationships between assets, ITAM focuses on ensuring all assets are accounted for and managed efficiently throughout their lifecycle. This includes procurement, deployment, maintenance, and retirement of assets.
Finally, schedule periodic audits of the CMDB to maintain data accuracy and relevance. Regular reviews help identify and address discrepancies, ensuring the database remains useful for incident response, change management, and compliance.
Ready to take your CMDB to the next level?
A well-maintained CMDB goes beyond simple configuration tracking—it becomes an operational backbone that empowers IT departments to align with business objectives, enhance compliance, and improve infrastructure planning. By centralizing and visualizing the relationships between critical assets, a CMDB enables IT teams to make informed, strategic decisions that support both immediate and long-term business goals.
Whether you’re a small business looking to establish a CMDB or a large organization ready to optimize an existing setup, now is the time to assess your needs and start planning for growth. Implementing and maintaining a CMDB is an investment in your organization’s future—ensuring visibility, accountability, and agility as IT environments continue to evolve.
The LogicMonitor ServiceNow CMDB Integration eliminates the need for time-consuming data sifting across systems, so you can gain a holistic view of your ecosystem, from infrastructure to applications. With immediate notifications for changes, you can stay on top of your assets and their dependencies without missing a beat.
Logging as a Service (LaaS) provides a cloud-based, centralized solution for managing log data from applications, servers, and devices, helping IT teams streamline analysis, improve security, and reduce infrastructure costs. By automating data collection and offering scalable storage, LaaS enables fast, efficient insights into system performance and security across diverse environments.
LaaS allows companies to manage log data regardless of whether it comes from applications, servers, or devices. With LaaS, companies can more easily aggregate and collate data, scale and manage storage requirements, set up notifications and alerts, and analyze data and trends. It also allows teams to customize dashboards, reports, and visualizations. It’s a platform designed to accommodate a company’s requirements for scalability.
Unlike traditional log management models, LaaS provides flexible, cloud-based services and support, enabling teams to access data centers instantly through web-based configurations. This agility not only supports real-time decision-making but also helps organizations optimize resources, enhance security, and ensure compliance—all without the infrastructure costs or maintenance burden of traditional solutions.
Why is log management so challenging?
A conventional approach to log management has its drawbacks. Here are a few of the challenges you might face with log management:
Resource heavy
Log management tools require significant storage and consume CPU time. Not only do they need substantial storage for log data, but they also eat up considerable CPU time collecting, indexing, and managing logs in real time. As a result, you may have fewer resources for locally running tools and applications, slowing down operations or impacting system performance. With LaaS, cloud-based resources scale automatically, allowing log data to be processed without consuming critical on-premises resources.
Poor reliability
Traditional log management tools can crash when they are locally hosted, or hosting servers might fail, especially during high-traffic periods or data surges. This lack of reliability means you could lose valuable log data, impacting your ability to investigate incidents or maintain compliance—a risk no organization can afford. LaaS, by operating in the cloud, offers high availability and built-in redundancy to prevent data loss and ensure continuous log access.
Minimal support
With logging tools, the scenario lends itself to a potentially faulty situation if you’re running more than a few applications across servers. Some companies may run some apps locally while running others in the cloud, creating data silos that complicate log collection and correlation. LaaS simplifies log management for hybrid environments, consolidating logs across on-premises and cloud systems for a unified view, which is critical for complex, multi-cloud infrastructures.
Lack of scalability
For companies relying on a local log retention solution, the host infrastructure’s size may cause challenges. To increase log volume for your company, you’ll probably need access to more resources, which may already be limited, resulting in performance bottlenecks and potential data loss. Scaling up an on-premises solution often requires substantial hardware investments, making it costly and time-consuming. LaaS solutions, on the other hand, scale effortlessly in the cloud, handling increased log volumes without requiring additional infrastructure investment.
High costs and maintenance overheads
Traditional log management solutions often require significant upfront investment in hardware and incur ongoing maintenance costs, as IT teams must regularly update software, manage storage, and troubleshoot issues. With LaaS, these maintenance burdens are significantly reduced, as the service provider handles updates, storage management, and troubleshooting, freeing up your IT team for more strategic tasks.
What are the benefits of Logging as a Service?
Logging as a Service maintains records of how the software is used for specific roles and functions across organizations. As a highly scalable solution, LaaS allows companies to focus on analyzing and better understanding the data logs instead of maintaining them.
Ensures greater efficiency
Logging as a Service deploys an enterprise-wide solution quickly and reliably. LaaS solutions ensure innovation with centralized deployment and updates. Outsourcing software management lends greater productivity to teams across the organization. With fast and reliable tracking LaaS options, you can correlate events and perform distributed traces across software environments. For example, e-commerce platforms benefit by quickly correlating user behaviors and system events to improve user experience and minimize downtime during peak shopping periods.
Protects your company
With better security measures, Logging as a Service can configure your infrastructure and log files to better support your company’s needs. LaaS monitors your systems for data breaches to give you better control and protection while supporting regulatory compliance as part of LaaS services. This means the service can quickly and reliably roll out security hotfixes. In industries like healthcare, where patient data privacy is critical, LaaS helps ensure data security and HIPAA compliance by monitoring logs for access control and vulnerabilities.
Visualizes log data
Visualizations are valuable and important. With graphing and data plotting tools used in a LaaS solution, companies can more easily visualize log data without the installation and configuration requirements. Companies save time and money and reduce frustration by avoiding manually importing data. In finance, LaaS visualization tools enable teams to monitor transactions in real-time, allowing for quicker detection of anomalies that could indicate fraud.
Adapts to changing requirements
LaaS services support better adaptability to IT environments. With the realities of cloud infrastructure, container management, and even remote work scenarios, your company and team must be agile. For instance, companies in the tech industry frequently change or scale their cloud infrastructure, and LaaS seamlessly supports this adaptability, ensuring consistent cloud-based log management without reconfigurations.
Accounts for global coverage
Evolutions in IT environments and requirements mean that you should consider global coverage opportunities. LaaS services support regulatory enforcement and intellectual property (IP) protection even if your users are spread across the globe.
Delivers 24/7 support
LaaS services address immediate troubleshooting needs, installing extensions, or reconfiguring logging tools. LaaS supports your need to ensure the functionality and accessibility necessary for operations, and it takes the guesswork out of monitoring those log files. This 24/7 support is particularly valuable for multinational organizations that require constant monitoring to accommodate various time zones and global operations.
LaaS implementation steps
Implementing Logging as a Service is a streamlined process that enables your organization to centralize, monitor, and scale log data effectively. Here’s how to get started:
- Assess current logging needs
Begin by evaluating your organization’s logging requirements. Identify data sources, log volume expectations, compliance needs, and key performance metrics. This assessment helps ensure that the LaaS solution meets your specific use cases and scalability goals. - Select a LaaS provider
Choose a LaaS provider that aligns with your technical requirements and budget. Consider factors such as scalability, ease of integration, customization options, and customer support. Selecting the right provider is essential for smooth integration and long-term support. - Plan for integration with existing systems
Map out how LaaS will integrate with your current IT log infrastructure. Identify the applications, servers, and devices that will feed data into the LaaS platform. This planning helps prevent data silos and ensures comprehensive log coverage across your environment. - Configure alerts and dashboards
Set up custom alerts and dashboards based on your team’s operational priorities. Configure notifications for critical events, such as security breaches or performance anomalies, to ensure proactive log monitoring. Custom dashboards enable faster decision-making by presenting data in an accessible, real-time format. - Test the LaaS setup
Conduct a thorough test of the LaaS system before full deployment. Check data flow from all intended sources, validate alert accuracy, and ensure that dashboards reflect live data. Testing provides confidence that the setup will perform as expected when handling production-level log volumes. - Monitor and optimize over time
Regularly review your LaaS setup to refine configurations and add new data sources as your environment evolves. Continuous optimization enables your LaaS solution to scale effectively with your organization, supporting long-term operational goals and maintaining system performance.
Built for the future with LogicMonitor
Logging as a Service is a powerful, future-ready solution designed to meet the evolving needs of modern enterprises. With its scalability, real-time log analytics, and robust security, LaaS enables organizations to stay agile, reduce infrastructure strain, and gain deeper insights into their data. By shifting log management to a cloud-based model, companies can better manage growing data volumes, simplify compliance, and focus more on innovation and less on maintenance.
At LogicMonitor, we’re committed to helping companies transform the way they manage log data, delivering extraordinary employee and customer experiences while maximizing efficiency.
Amazon Web Services (AWS) dominates the cloud computing industry with over 200 services, including AI and SaaS. In fact, according to Statista, AWS accounted for 32% of cloud spending in Q3 2022, surpassing the combined spending on Microsoft Azure, Google Cloud, and other providers.
A virtual private cloud (VPC) is one of AWS‘ most popular solutions. It offers a secure private virtual cloud that you can customize to meet your specific virtualization needs. This allows you to have complete control over your virtual networking environment.
Let’s dive deeper into AWS VPC, including its definition, components, features, benefits, and use cases.
What is a virtual private cloud?
A virtual private cloud refers to a private cloud computing environment within a public cloud. It provides exclusive cloud infrastructure for your business, eliminating the need to share resources with others. This arrangement enhances data transfer security and gives you full control over your infrastructure.
When you choose a virtual private cloud vendor like AWS, they handle all the necessary infrastructure for your private cloud. This means you don’t have to purchase equipment, install software, or hire additional team members. The vendor takes care of these responsibilities for you.
AWS VPC allows you to store data, launch applications, and manage workloads within an isolated virtualized environment. It’s like having your very own private section in the AWS Cloud that is completely separate from other virtual clouds.
AWS private cloud components
AWS VPC is made up of several essential components:
Subnetworks
Subnetworks, also known as subnets, are the individual IP addresses that comprise a virtual private cloud. AWS VPC offers both public subnets, which allow resources to access the internet, and private subnets, which do not require internet access.
Network access control lists
Network access control lists (Network ACLs) enhance the security of public and private subnets within AWS VPC. They contain rules that regulate inbound and outbound traffic at the subnet level. While AWS VPC has a default network NACL, you can also create a custom one and assign it to a subnet.
Security groups
Security groups further bolster the security of subnets in AWS VPC. They control the flow of traffic to and from various resources. For example, you can have a security group specifically for an AWS EC2 instance to manage its traffic.
Internet gateways
An internet gateway allows your virtual private cloud resources that have public IP addresses to access internet and cloud services. These gateways are redundant, horizontally scalable, and highly available.
Virtual private gateways
AWS defines a private gateway as “the VPN endpoint on the Amazon side of your Site-to-Site VPN connection that can be attached to a single VPC.” It facilitates the termination of a VPN connection from your on-premises environment.
Route tables
Route tables contain rules, known as “routes,” that dictate the flow of network traffic between gateways and subnets.
In addition to the above components, AWS VPC also includes peering connections, NAT gateways, egress-only internet gateways, and VPC endpoints. AWS provides comprehensive documentation on all these components to help you set up and maintain your AWS VPC environment.
AWS VPC features
AWS VPC offers a range of features to optimize your network connectivity and IP address management:
Network connectivity options
AWS VPC provides various options for connecting your environment to remote networks. For instance, you can integrate your internal networks into the AWS Cloud. Connectivity options include AWS Site-to-Site VPN, AWS Transit Gateway + AWS Site-to-Site VPN, AWS Direct Connect + AWS Transit Gateway, and AWS Transit Gateway + SD-WAN solutions.
Customize IP address ranges
You can specify the IP address ranges to assign private IPs to resources within AWS VPC. This allows you to easily identify devices within a subnet.
Network segmentation
AWS supports network segmentation, which involves dividing your network into isolated segments. You can create multiple segments within your network and allocate a dedicated routing domain to each segment.
Elastic IP addresses
Elastic IP addresses in AWS VPC help mitigate the impact of software failures or instance issues by automatically remapping the address to another instance within your account.
VPC peering
VPC peering connections establish network connections between two virtual private clouds, enabling routing through private IPs as if they were in the same network. You can create peering connections between your own virtual private clouds or with private clouds belonging to other AWS accounts.
AWS VPC benefits
There are several benefits to using AWS VPC:
Increased security
AWS VPC employs protocols like logical isolation to ensure the security of your virtual private cloud. The AWS cloud also offers additional security features, including infrastructure security, identity and access management, and compliance validation. AWS meets security requirements for most organizations and supports 98 compliance certifications and security standards, more than any other cloud computing provider.
Scalability
One of the major advantages of using AWS VPC is its scalability. With traditional on-premise infrastructure, businesses often have to invest in expensive hardware and equipment to meet their growing needs. This can be a time-consuming and costly process. However, with AWS VPC, businesses can easily scale their resources up or down as needed, without purchasing any additional hardware. This allows for more flexibility and cost-effectiveness in managing resources.
AWS also offers automatic scaling, which allows you to adjust resources dynamically based on demand, reducing costs and improving efficiency.
Flexibility
AWS VPC offers high flexibility, enabling you to customize your virtual private cloud according to your specific requirements. You can enhance visibility into traffic and network dependencies with flow logs, and ensure your network complies with security requirements using the Network Access Analyzer VPC monitoring feature. AWS VPC provides numerous capabilities to personalize your virtual private cloud experience.
Pay-as-you-go pricing
With AWS VPC, you only pay for the resources you use, including data transfers. You can request a cost estimate from AWS to determine the pricing for your business.
Comparison: AWS VPC vs. other cloud providers’ VPC solutions
When evaluating virtual private cloud solutions, understanding how AWS VPC compares to competitors like Azure Virtual Network and Google Cloud VPC is essential. Each platform offers unique features, but AWS VPC stands out in several critical areas, making it a preferred choice for many businesses.
AWS VPS
AWS VPC excels in service integration, seamlessly connecting with over 200 AWS services such as EC2, S3, Lambda, and RDS. This extensive ecosystem allows businesses to create and manage highly scalable, multi-tier applications with ease. AWS VPC leads the industry in compliance certifications, meeting 98 security standards and regulations, including HIPAA, GDPR, and FedRAMP. This makes it particularly suitable for organizations in regulated industries such as healthcare, finance, and government.
Azure Virtual Network
By comparison, Azure Virtual Network is tightly integrated with Microsoft’s ecosystem, including Azure Active Directory and Office 365. This makes it a strong contender for enterprises that already rely heavily on Microsoft tools. However, Azure’s service portfolio is smaller than AWS’s, and its networking options may not offer the same level of flexibility.
Google Cloud VPC
Google Cloud VPC is designed with a globally distributed network architecture, allowing users to connect resources across regions without additional configuration. This makes it an excellent choice for businesses requiring low-latency global connectivity. However, Google Cloud’s smaller service ecosystem and fewer compliance certifications may limit its appeal for organizations with stringent regulatory needs or diverse application requirements.
AWS VPC shines in scenarios where large-scale, multi-tier applications need to be deployed quickly and efficiently. It is also the better choice for businesses with strict compliance requirements, as its security measures and certifications are unmatched. Furthermore, its advanced networking features, including customizable IP ranges, elastic IPs, and detailed monitoring tools like flow logs, make AWS VPC ideal for organizations seeking a highly flexible and secure cloud environment.
AWS VPC use cases
Businesses utilize AWS VPC for various purposes. Here are some popular use cases:
Host multi-tier web apps
AWS VPC is an ideal choice for hosting web applications that consist of multiple tiers. You can harness the power of other AWS services to add functionality to your apps and deliver them to users.
Host websites and databases together
With AWS VPC, you can simultaneously host a public-facing website and a private database within the same virtual private cloud. This eliminates the need for separate VPCs.
Disaster recovery
AWS VPC enables network replication, ensuring access to your data in the event of a cyberattack or data breach. This enhances business continuity and minimizes downtime.
Beyond basic data replication, AWS VPC can enhance disaster recovery strategies by integrating with AWS Backup and AWS Storage Gateway. These services ensure faster recovery times and robust data integrity, allowing organizations to maintain operations with minimal impact during outages or breaches.
Hybrid cloud architectures
AWS VPC supports hybrid cloud setups, enabling businesses to seamlessly integrate their on-premises infrastructure with AWS. This allows organizations to extend their existing environments to the cloud, ensuring smooth operations during migrations or when scaling workloads dynamically. For example, you can use AWS Direct Connect to establish private, low-latency connections between your VPC and your data center.
DevOps and continuous integration/continuous deployment (CI/CD)
AWS VPC provides a secure and isolated environment for implementing DevOps workflows. By integrating VPC with tools like AWS CodePipeline, CodeBuild, and CodeDeploy, businesses can run CI/CD pipelines while ensuring the security and reliability of their applications. This setup is particularly valuable for teams managing frequent updates or deploying multiple application versions in parallel.
Secure data analytics and machine learning
AWS VPC can host secure environments for running data analytics and machine learning workflows. By leveraging services like Amazon SageMaker or AWS Glue within a VPC, businesses can process sensitive data without exposing it to public networks. This setup is ideal for organizations in sectors like finance and healthcare, where data privacy is critical.
AWS VPC deployment recommendations
Deploying an AWS VPC effectively requires following best practices to optimize performance, enhance security, and ensure scalability. Here are some updated recommendations:
1. Use security groups to restrict unauthorized access
- Configure security groups to allow only necessary inbound and outbound traffic to resources in your VPC.
- Apply the principle of least privilege by restricting access to specific IP addresses, protocols, and ports. For example, allow SSH (port 22) access only from a trusted IP range.
2. Implement multiple layers of security
- Use Network ACLs to provide an additional layer of protection at the subnet level.
- Combine these with security groups to create a layered security model, protecting resources from unauthorized access at both the instance and network level.
3. Leverage VPC peering for efficient communication
- Establish VPC peering connections to enable private communication between multiple VPCs within or across AWS accounts.
- Ensure route tables are correctly configured to enable seamless traffic flow between peered VPCs. Use this feature for scenarios like shared services or multi-region architectures.
4. Use VPN or AWS direct connect for hybrid cloud connectivity
- For hybrid cloud setups, establish Site-to-Site VPN connections or AWS Direct Connect to integrate your on-premises environment with your VPC.
- AWS Direct Connect offers lower latency and higher bandwidth, making it ideal for workloads requiring consistent performance.
5. Plan subnets for scalability and efficiency
- Allocate IPv4 CIDR blocks carefully to ensure sufficient IP addresses for future scaling. For example, reserve separate CIDR blocks for public, private, and database subnets.
- Divide subnets across multiple availability zones to increase availability and fault tolerance.
6. Enable VPC flow logs for monitoring
- Activate VPC Flow Logs to capture information about IP traffic going to and from network interfaces in your VPC.
- Use these logs to troubleshoot network connectivity issues, monitor traffic patterns, and enhance security by detecting unusual activity.
7. Optimize costs with NAT gateways
- Use NAT gateways to enable private subnet instances to access the internet without exposing them to inbound traffic.
- For cost-sensitive environments, consider replacing NAT Gateways with NAT Instances, although this requires more management effort.
8. Use elastic load balancing for high availability
- Deploy Elastic Load Balancers (ELBs) in public subnets to distribute traffic across multiple instances in private subnets.
- This improves scalability and ensures application availability during traffic spikes or failures.
9. Automate deployment with Infrastructure as Code (IaC)
- Use tools like AWS CloudFormation or Terraform to automate VPC setup and ensure consistency across environments.
- Version control your IaC templates to track changes and simplify updates.
10. Apply tagging for better resource management
- Assign meaningful tags to all VPC components, such as subnets, route tables, and security groups.
- Tags like Environment: Production or Project: WebApp make it easier to manage, monitor, and allocate costs.
By following these best practices, businesses can ensure that their AWS VPC deployments are secure, scalable, and optimized for performance. This approach also lays the groundwork for effectively managing more complex cloud architectures in the future.
Why choose AWS VPC?
AWS VPC offers a secure and customizable virtual private cloud solution for your business. Its features include VPC peering, network segmentation, flexibility, and enhanced security measures. Whether you wish to host multi-tier applications, improve disaster recovery capabilities, or achieve business continuity, investing in AWS VPC can bring significant benefits. Remember to follow the deployment recommendations provided above to maximize the value of this technology.
To maximize the value of your AWS VPC deployment, it’s essential to monitor and manage your cloud infrastructure effectively. LogicMonitor’s platform seamlessly integrates with AWS, offering advanced AWS monitoring capabilities that provide real-time visibility into your VPC and other AWS resources.
With LogicMonitor, you can proactively identify and resolve performance issues, optimize your infrastructure, and ensure that your AWS environment aligns with your business goals.
At LogicMonitor, we manage vast quantities of time series data, processing billions of metrics, events, and configurations daily. As part of our transition from a monolithic architecture to microservices, we chose Quarkus—a Kubernetes-native Java stack—for its efficiency and scalability. Built with the best-of-breed Java libraries and standards, Quarkus is designed to work seamlessly with OpenJDK HotSpot and GraalVM.
To monitor our microservices effectively, we integrated Micrometer, a vendor-agnostic metrics instrumentation library for JVM-based applications. Micrometer simplifies the collection of both JVM and custom metrics, helping maximize portability and streamline performance monitoring across our services.
In this guide, we’ll show you how to integrate Quarkus with Micrometer metrics, offering practical steps, code examples, and best practices. Whether you’re troubleshooting performance issues or evaluating these tools for your architecture, this article will help you set up effective microservice monitoring.
How Quarkus and Micrometer work together
Quarkus offers a dedicated extension that simplifies the integration of Micrometer, making it easier to collect both JVM and custom metrics. This extension allows you to quickly expose application metrics through representational state transfer (REST) endpoints, enabling real-time monitoring of everything from Java Virtual Machine (JVM) performance to specific microservice metrics. By streamlining this process, Quarkus and Micrometer work hand-in-hand to deliver a powerful solution for monitoring microservices with minimal setup.
// gradle dependency for the Quarkus Micrometer extension
implementation 'io.quarkus:quarkus-micrometer:1.11.0.Final'
// gradle dependency for an in-memory registry designed to operate on a pull model
implementation 'io.micrometer:micrometer-registry-prometheus:1.6.3'
What are the two major KPIs of our metrics processing pipeline?
For our metrics processing pipeline, our two major KPIs (Key Performance Indicators) are the number of processed messages and the latency of the whole pipeline across multiple microservices.
We are interested in the number of processed messages over time in order to detect anomalies in the expected workload of the application. Our workload is variable across time but normally follows predictable patterns. This allows us to detect greater than expected load, react accordingly, and proactively detect potential data collection issues.
In addition to the data volume, we are interested in the pipeline latency. This metric is measured for all messages from the first ingestion time to being fully processed. This metric allows us to monitor the health of the pipeline as a whole in conjunction with microservice-specific metrics. It includes the time spent in transit in Kafka clusters between our different microservices. Because we monitor the total processing duration for each message, we can report and alert on average processing time and different percentile values like p50, p95, and p999. This can help detect when one or multiple nodes in a microservice along the pipeline are unhealthy. The average processing duration across all messages might not change much, but the high percentile (p99, p999) will increase, indicating a localized issue.
In addition to our KPIs, Micrometer exposes JVM metrics that can be used for normal application monitoring, such as memory usage, CPU usage, garbage collection, and more.
Using Micrometer annotations
Two dependencies are required to use Micrometer within Quarkus: the Quarkus Micrometer dependency and Micrometer Registry Prometheus. Quarkus Micrometer provides the interfaces and classes needed to instrument codes, and Micrometer Registry Prometheus is an in-memory registry that exposes metrics easily with rest endpoints. Those two dependencies are combined into one extension, starting with Quarkus 1.11.0.Final.
Micrometer annotations in Quarkus produce a simple method to track metric names across different methods. Two key annotations are:
- @Timed: Measures the time a method takes to execute.
- @Counted: Tracks how often a method is called.
This, however, is limited to methods in a single microservice.
@Timed(
   value = "processMessage",
   description = "How long it takes to process a message"
)
public void processMessage(String message) {
   // Process the message
}
It is also possible to programmatically create and provide values for Timer metrics. This is helpful when you want to instrument a duration, but want to provide individual measurements. We are using this method to track the KPIs for our microservice pipeline. We attach the ingestion timestamp as a Kafka header to each message and can track the time spent throughout the pipeline.
@ApplicationScoped
public class Processor {

   private MeterRegistry registry;
   private Timer timer;

   // Quarkus injects the MeterRegistry
   public Processor(MeterRegistry registry) {
       this.registry = registry;
       timer = Timer.builder("pipelineLatency")
           .description("The latency of the whole pipeline.")
           .publishPercentiles(0.5, 0.75, 0.95, 0.98, 0.99, 0.999)
           .percentilePrecision(3)
           .distributionStatisticExpiry(Duration.ofMinutes(5))
           .register(registry);
   }

   public void processMessage(ConsumerRecord<String, String> message) {
       /*
           Do message processing
        */
       // Retrieve the kafka header
       Optional.ofNullable(message.headers().lastHeader("pipelineIngestionTimestamp"))
           // Get the value of the header
           .map(Header::value)
           // Read the bytes as String
           .map(v -> new String(v, StandardCharsets.UTF_8))
           // Parse as long epoch in millisecond
           .map(v -> {
               try {
                   return Long.parseLong(v);
               } catch (NumberFormatException e) {
                   // The header can't be parsed as a Long
                   return null;
               }
           })
           // Calculate the duration between the start and now
           // If there is a discrepancy in the clocks the calculated
           // duration might be less than 0. Those will be dropped by MicroMeter
           .map(t -> System.currentTimeMillis() - t)
           .ifPresent(d -> timer.record(d, TimeUnit.MILLISECONDS));
   }
}
The timer metric with aggregation can then be retrieved via the REST endpoint at https://quarkusHostname/metrics.
# HELP pipelineLatency_seconds The latency of the whole pipeline.
# TYPE pipelineLatency_seconds summary
pipelineLatency_seconds{quantile="0.5",} 0.271055872
pipelineLatency_seconds{quantile="0.75",} 0.386137088
pipelineLatency_seconds{quantile="0.95",} 0.483130368
pipelineLatency_seconds{quantile="0.98",} 0.48915968
pipelineLatency_seconds{quantile="0.99",} 0.494140416
pipelineLatency_seconds{quantile="0.999",} 0.498072576
pipelineLatency_seconds_count 168.0
pipelineLatency_seconds_sum 42.581
# HELP pipelineLatency_seconds_max The latency of the whole pipeline.
# TYPE pipelineLatency_seconds_max gauge
pipelineLatency_seconds_max 0.498
We then ingest those metrics in LogicMonitor as DataPoints using collectors.
Step-by-step setup for Quarkus Micrometer
To integrate Micrometer with Quarkus for seamless microservice monitoring, follow these steps:
1. Add Dependencies: Add the required Micrometer and Quarkus dependencies to enable metrics collection and reporting for your microservices.
gradle
Copy code
implementation 'io.quarkus:quarkus-micrometer:1.11.0.Final'
implementation 'io.micrometer:micrometer-registry-prometheus:1.6.3'2. Enable REST endpoint: Configure Micrometer to expose metrics via a REST endpoint, such as /metrics.
3. Use annotations for metrics: Apply Micrometer annotations like @Timed and @Counted to the methods where metrics need to be tracked.
4. Set up a registry: Use Prometheus as a registry to pull metrics from Quarkus via Micrometer. Here’s an example of how to set up a timer:
java
Copy code
Timer timer = Timer.builder("pipelineLatency")
.description("Latency of the pipeline") .publishPercentiles(0.5, 0.75, 0.95, 0.98, 0.99, 0.999) .register(registry);5. Monitor via the endpoint: After setup, retrieve and monitor metrics through the designated REST endpoint:
urlCopy codehttps://quarkusHostname/metricsPractical use cases for using Micrometer in Quarkus
Quarkus and Micrometer offer a strong foundation for monitoring microservices, providing valuable insights for optimizing their performance. Here are some practical applications:
- Latency tracking: Use Micrometer to measure the time it takes for messages to move through your microservice pipeline. This helps identify bottlenecks and improve processing efficiency.
- Anomaly detection: By continuously analyzing metrics over time, you can detect unusual patterns in message processing rates or spikes in system latency, letting you address issues before they impact performance.
- Resource monitoring: Track JVM metrics like memory usage and CPU consumption to optimize resource allocation and ensure your services run smoothly.
- Custom KPIs: Tailor metrics to your specific business objectives, such as message processing speed or response times, allowing you to track key performance indicators that matter most to your organization.
LogicMonitor microservice technology stack
LogicMonitor’s Metric Pipeline, where we built out multiple microservices with Quarkus in our environment, is deployed on the following technology stack:
- Java 11 (corretto, cuz licenses)
- Kafka (managed in AWS MSK)
- Kubernetes
- Nginx (ingress controller within Kubernetes)

How do we correlate configuration changes to metrics?
Once those metrics are ingested in LogicMonitor, they can be displayed as graphs or integrated into dashboards. They can also be used for alerting and anomaly detections, and in conjunction with ops notes, they can be visualized in relation to infrastructure or configuration changes, as well as other significant events.
Below is an example of an increase in processing duration correlated to deploying a new version. Deploying a new version automatically triggers an ops note that can then be displayed on graphs and dashboards. In this example, this functionality facilitates the correlation between latency increase and service deployment.

Tips for efficient metrics collection and optimizing performance
To get the most out of Quarkus and Micrometer, follow these best practices for efficient metrics collection:
- Focus on Key Metrics: Track the metrics that directly impact your application’s performance, such as latency, throughput, and resource usage. This helps you monitor critical areas that influence your overall system health.
- Use Percentile Data: Analyzing percentile values like p95 and p99 allows you to spot outliers and bottlenecks more effectively than relying on averages. This gives you deeper insights into performance anomalies.
- Monitor Custom Metrics: Customize the metrics you collect to match your application’s specific needs. Don’t limit yourself to default metrics. Tracking specific business-critical metrics will give you more actionable data.
How to Track Anomalies
All of our microservices are monitored with LogicMonitor. Here’s an example of Anomaly Detection for the pipeline latencies 95 percentile. LogicMonitor dynamically figures out the normal operating values and creates a band of expected values. It’s then possible to define alerts when values fall outside the generated band.

As seen above, the integration of MicroMeter with Quarkus allows in conjunction with LogicMonitor a straightforward, easy, and quick way to add visibility into our microservices. This ensures that our processing pipeline provides the most value to our clients while minimizing the monitoring effort for our engineers, reducing cost, and increasing productivity.
Quarkus With Micrometer: Unlock the Power of Real-Time Insights
Integrating Micrometer with Quarkus empowers real-time visibility into the performance of your microservices with minimal effort. Whether you’re monitoring latency, tracking custom KPIs, or optimizing resource usage, this streamlined approach simplifies metrics collection and enhances operational efficiency.
Leverage the combined strengths of Quarkus and Micrometer to proactively address performance issues, improve scalability, and ensure your services are running at peak efficiency.
FAQs
How does Micrometer work with Quarkus?
Micrometer integrates seamlessly with Quarkus by providing a vendor-neutral interface for collecting and exposing metrics. Quarkus offers an extension that simplifies the integration, allowing users to track JVM and custom metrics via annotations like @Timed and @Counted and expose them through a REST endpoint.
What are the benefits of using Micrometer in a microservice architecture?
Using Micrometer in a microservice architecture provides observability, real-time visibility into the performance of individual services, helping detect anomalies, track latency, and monitor resource usage. It supports integration with popular monitoring systems like Prometheus, enabling efficient metrics collection and analysis across microservices, improving scalability and reliability.
How do you set up Micrometer metrics in Quarkus?
To set up Micrometer metrics in Quarkus, add the necessary dependencies (quarkus-micrometer and a registry like micrometer-registry-prometheus). Enable metrics exposure via a REST endpoint, apply annotations like @Timed to track specific metrics, and configure a registry (e.g., Prometheus) to pull and monitor the metrics.
What are common issues when integrating Micrometer with Quarkus, and how can they be resolved?
Common issues include misconfigured dependencies, failure to expose the metrics endpoint, and incorrect use of annotations. These can be resolved by ensuring that the proper dependencies are included, that the REST endpoint for metrics is correctly configured, and that annotations like @Timed and @Counted are applied to the correct methods.
How do I monitor a Quarkus microservice with Micrometer?
To monitor a Quarkus microservice with Micrometer, add the Micrometer and Prometheus dependencies, configure Micrometer to expose metrics via a REST endpoint, and use annotations like @Timed to track important performance metrics. You can then pull these metrics into a monitoring system like Prometheus or LogicMonitor for visualization and alerting.
If you’re reading this, you already understand the importance of keeping your Apache web servers running smoothly. Whether it’s ensuring you stay within the limits of configured server workers, tracking how many requests are being handled, or guaranteeing maximum uptime, effective Apache monitoring is the key to maintaining server performance and reliability. Fortunately, setting up Apache monitoring is straightforward and can be done in just a few steps.
This guide will take you through a simple, step-by-step process to monitor your Apache servers effectively on operating systems like Windows, covering everything from enabling necessary modules to configuring alerts and integrating with monitoring tools. By the end, you’ll be able to proactively manage your server health, catch potential issues early, and optimize your system for peak performance.
Step 1: Make sure you are loading the mod_status module.
If you are using a version of Apache that was installed by your OS’s package manager, there are OS specific ways to enable modules.
For Ubuntu/Debian:
/usr/sbin/a2enmod status
For Redhat/Centos: Just uncomment the line:
LoadModule status_module modules/mod_status.so
in /etc/httpd/conf/httpd.conf
For Suse derivatives:
add “status” to the list of modules on the line starting with APACHE_MODULES= in /etc/sysconfig/apache2
Step 2: Configure the Mod_status module
You want the following to be loaded in your apache configuration files.
ExtendedStatus On
<Location /server-status>
 SetHandler server-status
 Order deny,allow
 Deny from all
#Add LogicMonitor agent addresses here
 Allow from logicmonitor.com 192.168.10.10
</Location>
Where you set that configuration also changes depending on your Linux distribution.
/etc/apache2/mods-available/status.conf on Ubuntu/Debian
/etc/httpd/conf/httpd.conf on Redhat/CentOs
/etc/apache2/mod_status.conf on OpenSuse/SLES
Finally, restart apache using your OS startup script ( /etc/init.d/httpd restart or /etc/init.d/apache2 restart). Note that using the OS startup script is often necessary to allow the OS specific script files to assemble the final apache config. Sending apache signals, or using apache2ctl, does not do this.
Step 3. Watch the monitoring happen.
If you are using LogicMonitor’s Apache monitoring, then you’re done. LogicMonitor will automatically detect the Apache web server, and apply appropriate monitoring and alerting, as well as alerting and graphing on the rest of the system, so you can correlate CPU, interface and disk load to Apache load.
One thing you may want to customize is your dashboards – add a widget that collects all Apache requests/second, from all hosts, or all production hosts, and aggregates them into a single graph. Using LogicMonitor’s flexible graphs, the graph will automatically include new servers as you add them.

Best practices for Apache server monitoring
Establish baselines
Establishing baselines for Apache performance metrics is crucial for effective network monitoring. Baselines help you understand what normal behavior looks like for your servers. By comparing real-time data against these baselines, you can quickly identify anomalies that may indicate issues such as increased traffic or hardware failures.
Automate alerts
Automating alerts is a key way to reduce manual monitoring overhead and ensure timely responses to potential problems. By configuring automated alerts for critical metrics such as CPU load, memory usage, and error rates, you can receive notifications as soon as thresholds are exceeded. This proactive approach allows you to address issues before they escalate, minimizing downtime and ensuring consistent server performance.
Analyze trends
Regularly analyzing trends in your monitoring data helps with capacity planning and optimizing performance. Use historical data to identify patterns, such as increased traffic during certain times or resource usage spikes. This enables you to make informed decisions about scaling infrastructure, optimizing configurations, and planning for future growth. Trend analysis also allows you to fine-tune alert thresholds to reduce false positives and improve the accuracy of your monitoring system.
Tracing and automation
Implementing tracing and automation workflows enhances Apache server monitoring by automating alerts and analyzing trends. Tracing tracks request paths, offering insights into response times, errors, and dependencies to identify bottlenecks and optimize performance.
Automation workflows enable you to streamline repetitive tasks such as log analysis, performance testing, and restarts. By automating these processes, you can focus on more critical tasks while ensuring consistency and efficiency in your monitoring efforts. Version pinning specifies exact software versions, reducing compatibility issues and simplifying troubleshooting.
Ready to simplify your Apache monitoring?
Monitoring your Apache http servers is essential for maintaining optimal performance, ensuring availability, and preventing issues before they escalate. By understanding key metrics, integrating powerful monitoring tools, and setting up proactive alerts, you can stay ahead of server problems and ensure your infrastructure remains healthy and efficient.
If you’re looking to simplify your Apache monitoring, consider using LogicMonitor. LogicMonitor automates the setup, detection, and visualization of your Apache environment, making it easier to identify issues, set up alerts, and aggregate critical metrics. With LogicMonitor, you can save time, reduce manual effort, and ensure comprehensive coverage of your Apache infrastructure.