If you need to ensure all your storage systems are working at their peak – you need LogicMonitor.
Simply tell LogicMonitor to monitor your Isilon cluster, and LogicMonitor will do the rest. LogicMonitor will automatically detect and monitor all:
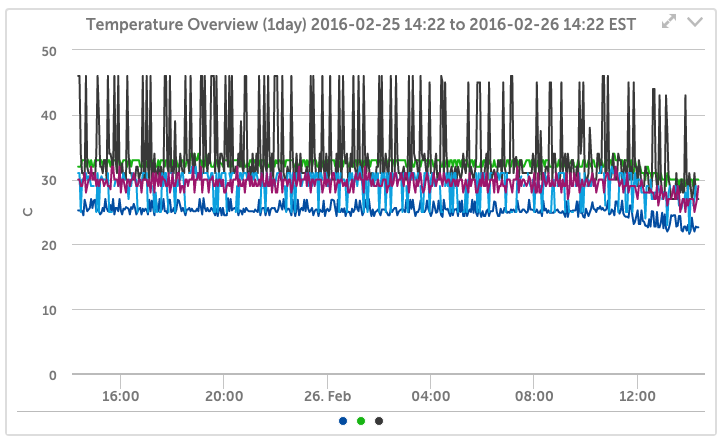
- temperature sensors
- SmartQuotas
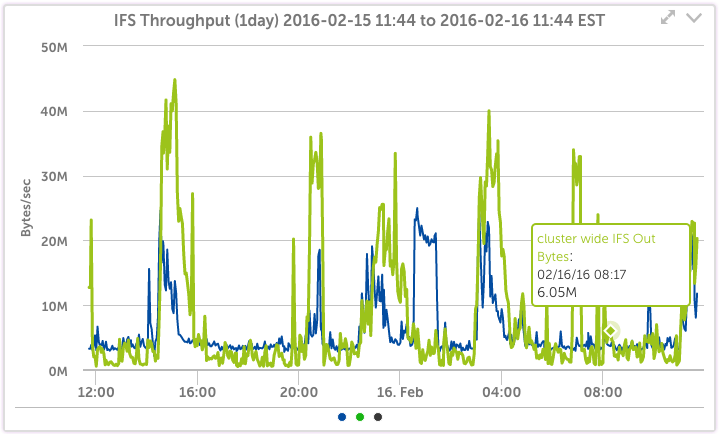
- Cluster-wide and Node IFS performance
- Interfaces
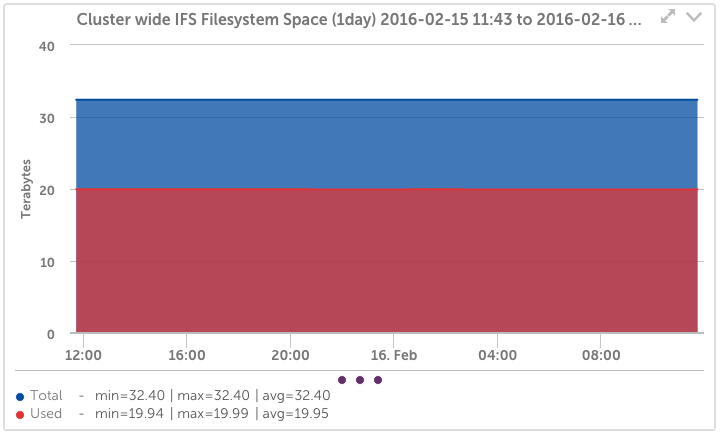
- File Systems
- Fans
- Disks
- and more
With best practices alerts and thresholds pre-defined. You’ll get graphical trends of performance going back a year, and alerts informing you of issues that need your attention. Automatically.
Just a few of the critical Isilon metrics we monitor:
Isilon Cluster Metrics
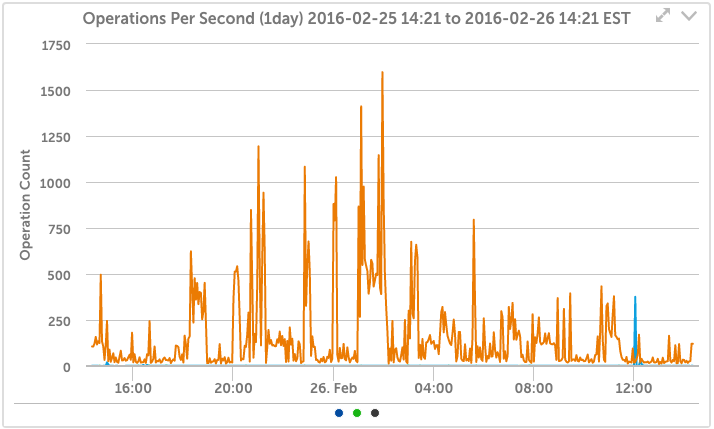
Track the cluster throughput, CPU load, Operations, and more – automatically. You’ll know when you are reaching the limits of CPU or disk performance, and how much throughput you are getting from your cluster.
Isilon protocol Metrics
Automatically detect each storage protocol in use and easily see the relative load per protocol on each node. You can trend the usage over time for the last year, as well as zoom in to any period for more detail. See the latency and throughput rates at a glance.
Isilon Health Monitoring
Automatically detect every disk drive, fan, and temperature sensor in the Isilon system, and monitor for failures and alert conditions. Escalate alerts to the right people, at the right time to ensure your systems are up.