Join us at LM Elevate. Our annual conference for IT industry thought leaders, LogicMonitor users and partners. Register now!
LogicMonitor Logo LogicMonitor Logo
  • Why LogicMonitor
    • For Enterprises
    • For MSPs
  • Platform
    • Security
    • Integrations
    • Infrastructure Monitoring
    • Cloud Monitoring
    • Network Monitoring
    • Application Performance Monitoring
    • Log Analysis
    • Server Monitoring
    • + View all Solutions
  • Pricing
  • Resources
  • Support
Try it Free
Search:
  • Why LogicMonitor
    • For Enterprises
    • For MSPs
  • Platform
    • Security
    • Integrations
    • Infrastructure Monitoring
    • Cloud Monitoring
    • Network Monitoring
    • Application Performance Monitoring
    • Log Analysis
    • Server Monitoring
    • + View all Solutions
  • Pricing
  • Resources
  • Support
Try it Free
  • Platform
    • Integrations
    • Security
    • Platform Demo
  • Pricing
  • Why LogicMonitor
  • Case Studies
  • Support
    • Professional Services
    • Developer Documentation
    • Academy
    • Release Notes
  • About us
    • Leadership
    • Employee Spotlight
    • Press
    • Careers
    • Diversity & Culture
    • Contact / Locations
    • Events
  • Resources
  • Blog
  • Partner Program
  • Community
Integrations > Microsoft Sql Server

Microsoft SQL Server

Microsoft SQL Server Logo

Microsoft SQL Server is a relational database management system developed by Microsoft.

LogicMonitor’s unique hosted monitoring service provides full Microsoft SQL Server monitoring, complete with best practices alerts and thresholds distilled from years of real-life datacenter experience.

Agentless Monitoring of Key Metrics

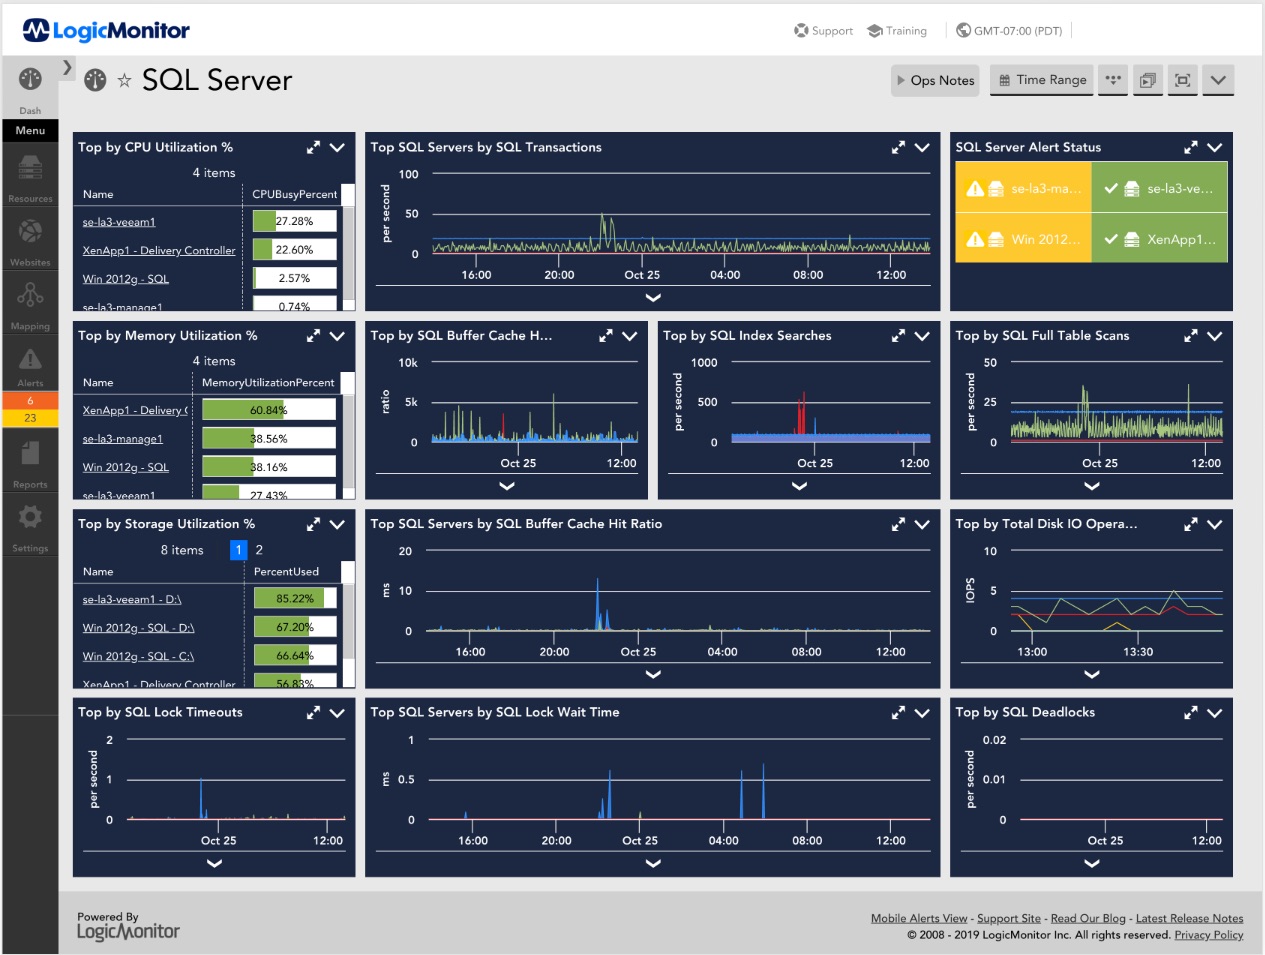
LogicMonitor’s agentless architecture allows you to deploy anywhere and start collecting critical SQL Server metrics, such as query response time, within minutes. For each existing and new instances of SQL Server found on a host, LogicMonitor’s SQL Server monitoring system automatically monitors, trends, and alerts on many key performance indicators, allowing you to see at a glance how your servers are running.

No Need to be a MS SQL Guru

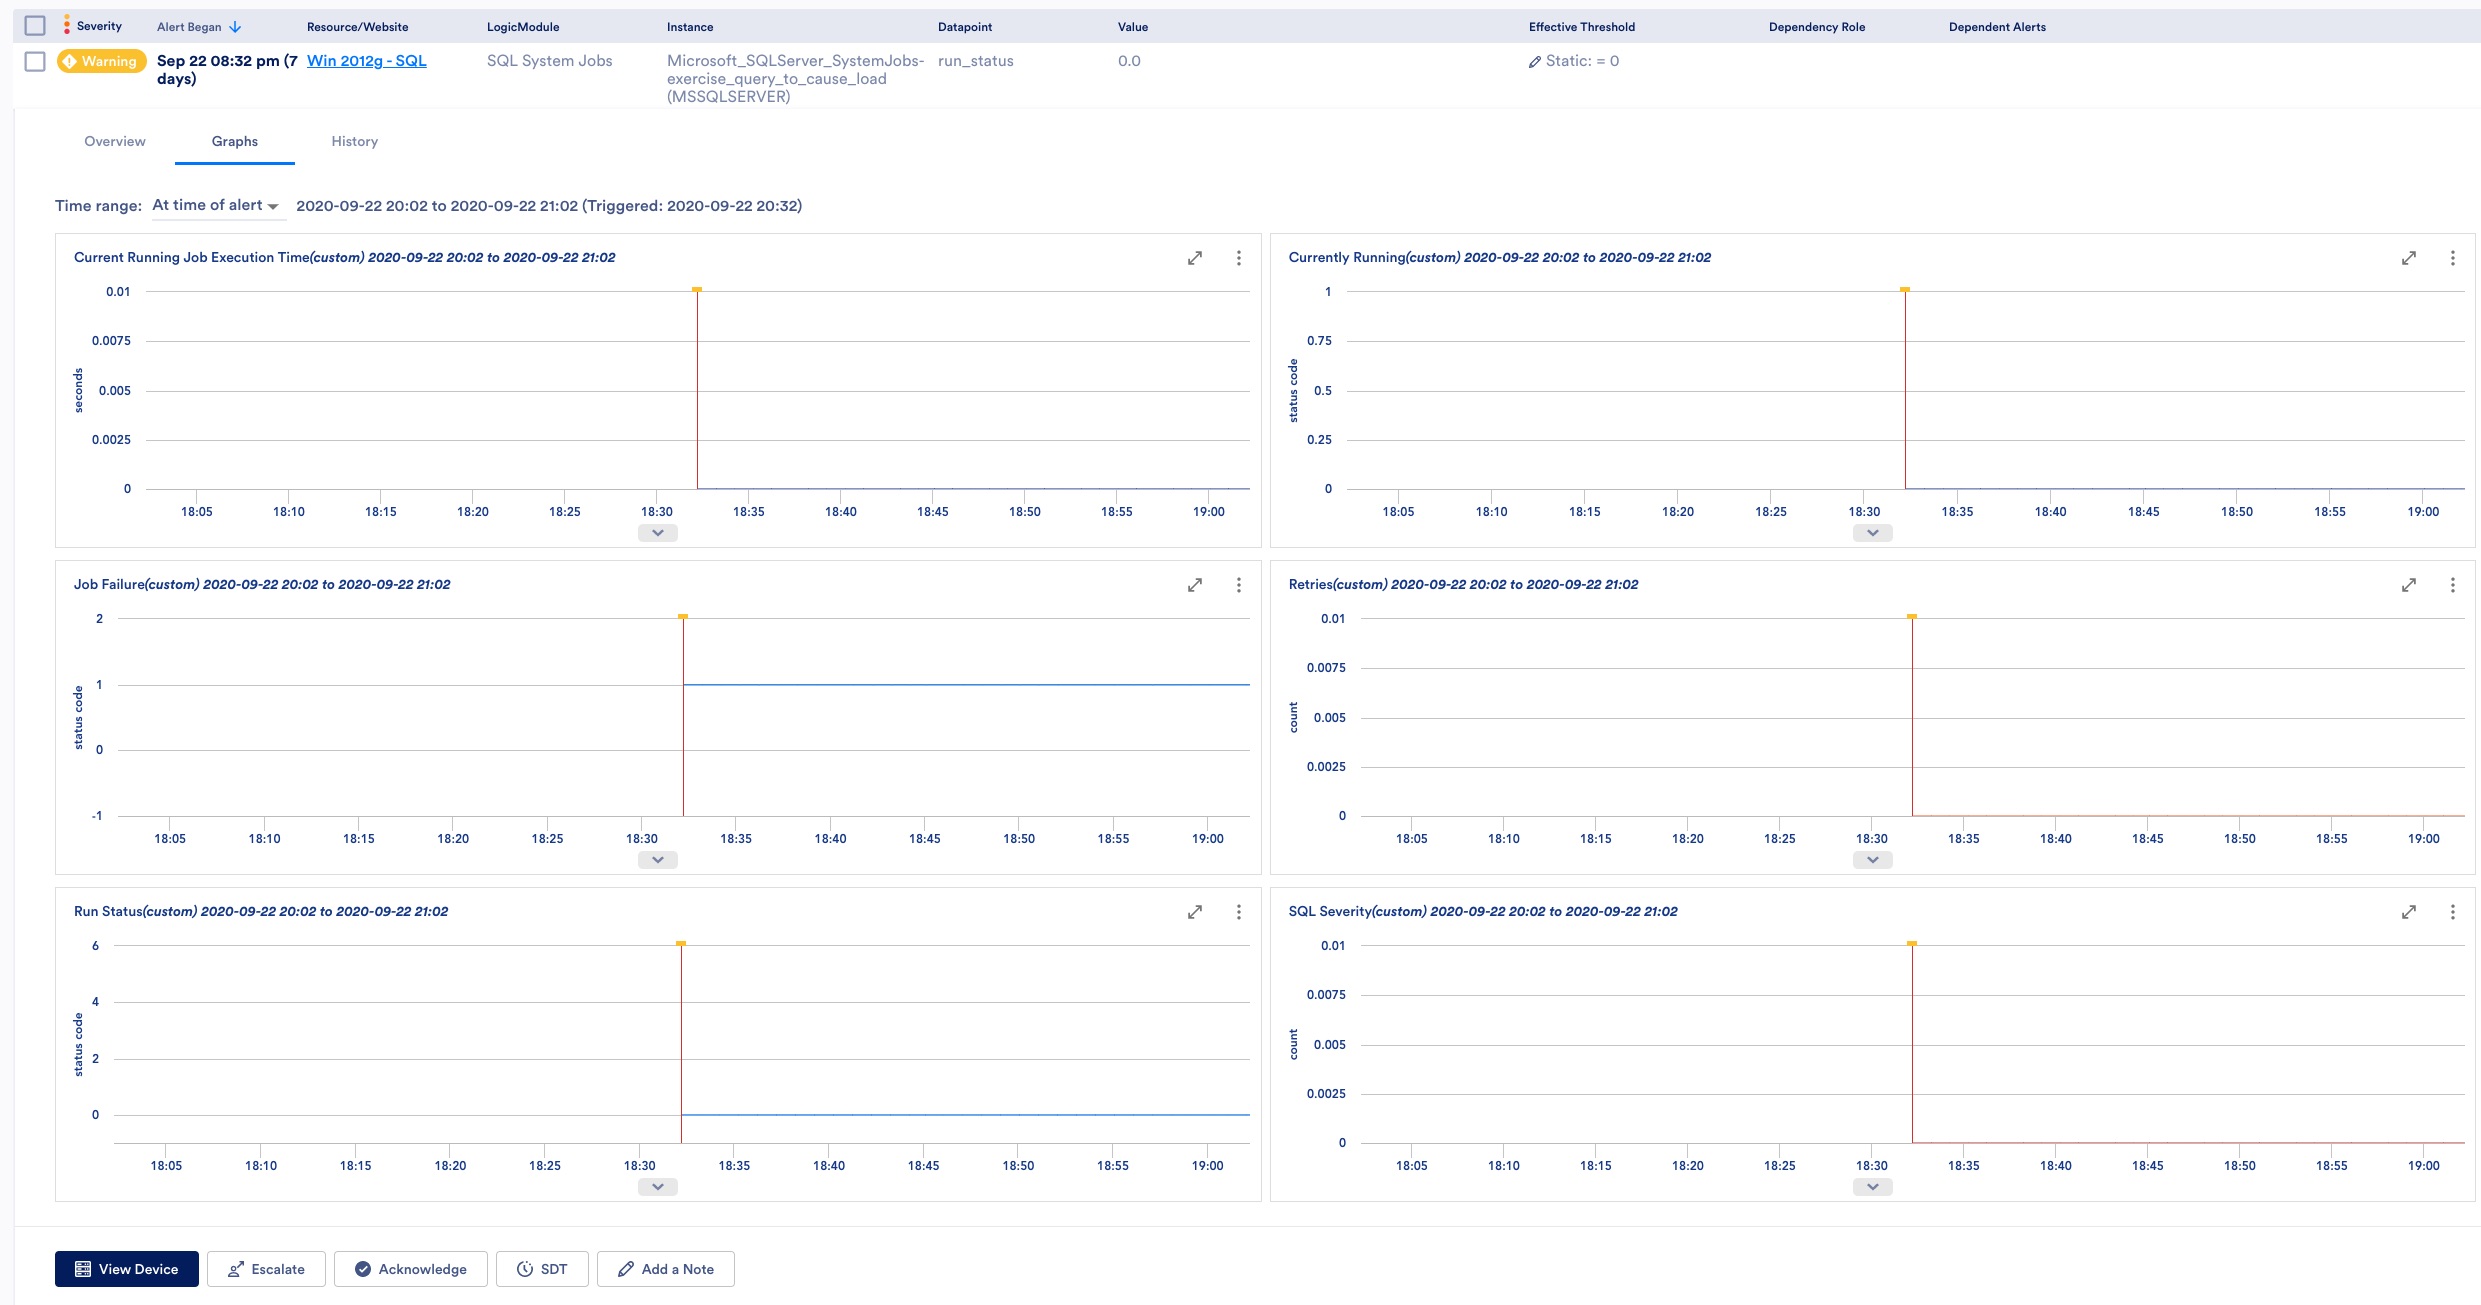
Predefined alert thresholds provide expert-based recommendations about settings that may need tuning or indications of SQL that may need optimization. Plus, with Dynamic Thresholds, we can baseline the metrics according to the environment’s usage and tailor the thresholds to your needs.

Visualize Your Environment

LogicMonitor’s topology feature helps you see the dependencies of your SQL Server and quickly identify any potential bottlenecks. In addition to the topology view, LogicMonitor’s AIOps capabilities can suppress alert storms from downstream devices.

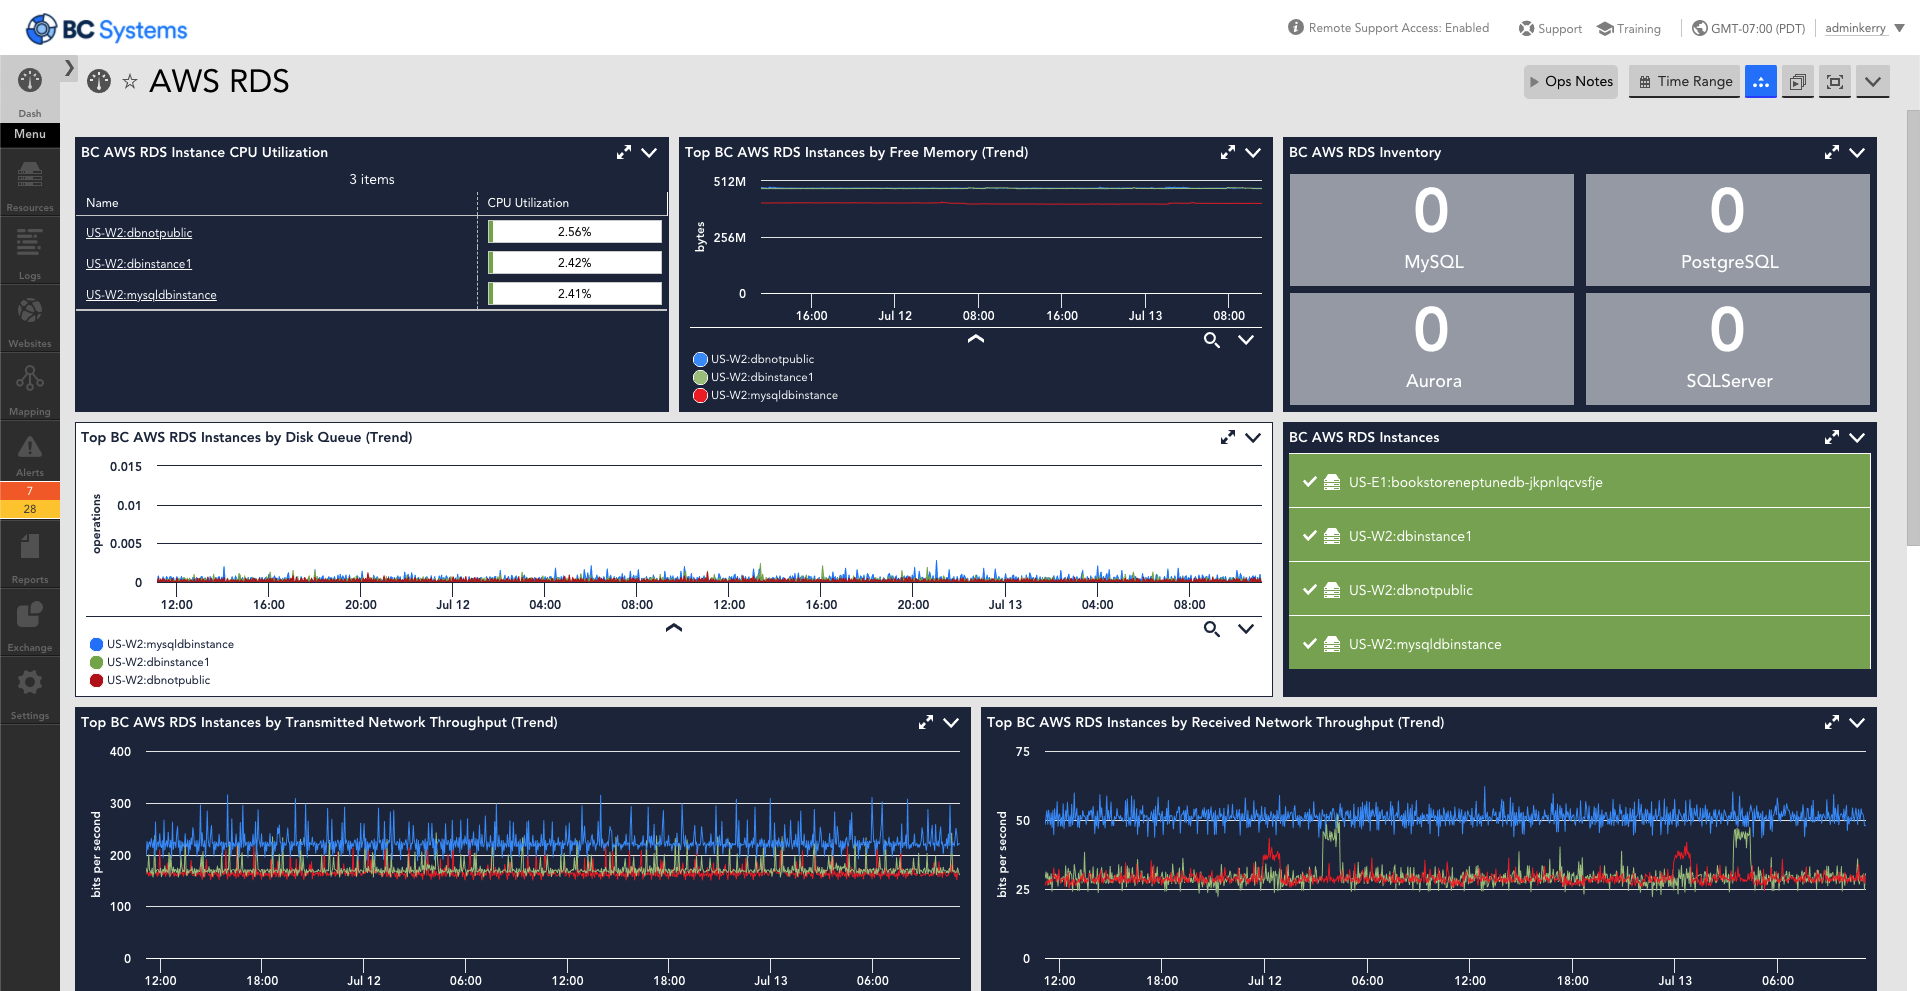
PaaS MS SQL Monitoring

LogicMonitor automatically discovers MS SQL instances in PaaS environments. Get the same extensive monitoring metrics and alerts as an on-premise instance.

Setup:

Unlike other monitoring systems, no configuration is required. Simply enter a hostname, and LogicMonitor determines whether the system is a Windows server; 32 bit or 64 bit (and applies appropriate memory thresholds for alerting); discovers all interfaces, physical drives, logical file systems, and also finds all instances of SQL server on that host.

Similar & Related Integrations

Database Monitoring

MySQL

Reddis

Other Resources

Case Study –

https://www.logicmonitor.com/support/monitoring/applications-databases/microsoft-sql-server/

LogicMonitor’s unique hosted monitoring service provides full Microsoft SQL Server monitoring, complete with best practices alerts and thresholds distilled from years of real life datacenter experience. Unlike other monitoring systems, no configuration is required. Simply enter a hostname, and LogicMonitor determines whether the system is a Windows server; 32 bit or 64 bit (and applies appropriate memory thresholds for alerting); discovers all interfaces, physical drives, logical file systems, and also finds all instances of SQL server on that host.

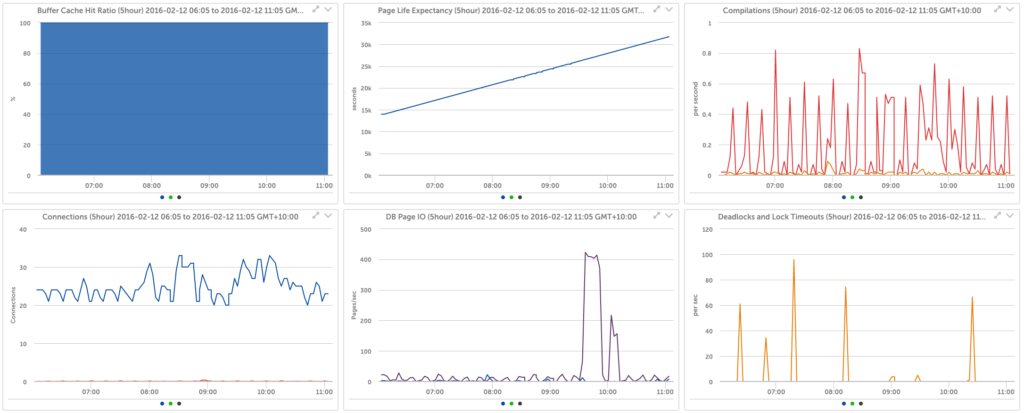
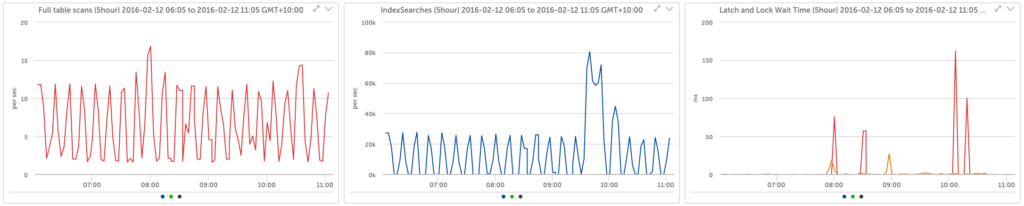
For each instance of SQL server found, LogicMonitor’s SQL Server monitoring system automatically monitors, trends, and alerts on many key performance indicators, allowing you to see at a glance how your servers are running. Predefined alert thresholds provide recommendations about settings that may need tuning, or indications of SQL that may need optimization.

Further, while graphing SQL Server (and global server) performance metrics over time is essential for monitoring the health of your database, LogicMonitor also automatically monitors the metric that matters most – query response time – and alerts through escalation lists if performance or availability degrades past thresholds.

Like all devices monitored by LogicMonitor, the configuration is automatically kept up-to-date, so, if a new SQL server instance is started on a host, LogicMonitor automatically discovers it and start monitoring it. Eliminate the chance of your customers knowing about outages before you do. Get SQL Server monitoring that frees up time, and keeps up with your dynamic environment – LogicMonitor.

Available LogicModules

Test simple SQL query execution

  • Query Response Time

Monitors state of SQL Server services

  • State
  • Status

Windows host system uptime via WMI

  • System Uptime

TCP stats via WMI

  • Connections
  • TCP Failed Connections
  • TCP retransmissions
  • Segments per second

Windows UDP stats via WMI

  • UDP Error Rate
  • UDP Rate
linkedin icon twitter icon facebook icon github icon
  • Platform
    • Integrations
    • Security
    • Platform Demo
  • Pricing
  • Why LogicMonitor
  • Case Studies
  • Support
    • Professional Services
    • Developer Documentation
    • Academy
    • Release Notes
  • About us
    • Leadership
    • Employee Spotlight
    • Press
    • Careers
    • Diversity & Culture
    • Contact / Locations
    • Events
  • Resources
  • Blog
  • Partner Program
  • Community
linkedin icon twitter icon facebook icon github icon
  • Privacy Policy
  • Integrity & Transparency
  • Terms of Use
© Copyright 2022 LogicMonitor Inc.
We use cookies to provide and improve our services. By clicking "Accept all", you consent to use of all cookies.
Cookie settings ACCEPT ALL
Manage consent

Privacy Overview

This website uses cookies to improve your experience while you navigate through the website. Out of these cookies, the cookies that are categorized as necessary are stored on your browser as they are essential for the working of basic functionalities of the website. We also use third-party cookies that help us analyze and understand how you use this website. These cookies will be stored in your browser only with your consent. You also have the option to opt-out of these cookies. But opting out of some of these cookies may have an effect on your browsing experience.
Necessary
Always Enabled
Necessary cookies are absolutely essential for the website to function properly. These cookies ensure basic functionalities and security features of the website, anonymously. These include the Qualified chatbot, the Marketo cookie for loading and submitting forms on the website and page variation testing software tool.
Analytics
Analytical cookies are used to understand how visitors interact with the website. These cookies help provide information on metrics the number of visitors, bounce rate, traffic source, etc.
Save & Accept