

PostgreSQL
With LogicMonitor, you can be comprehensively monitoring all your PostgreSQL databases in minutes. No scripts to install, no libraries to configure, no need to figure out what to monitor. LogicMonitor will automatically discover your PostgreSQL databases and report all the significant metrics, while simultaneously monitor your entire server’s health and performance.
LogicMonitor will let you easily answer questions like:
- Is my database getting slower over time?
- Is autovacuum working correctly? Am I in danger of transaction wraparound?
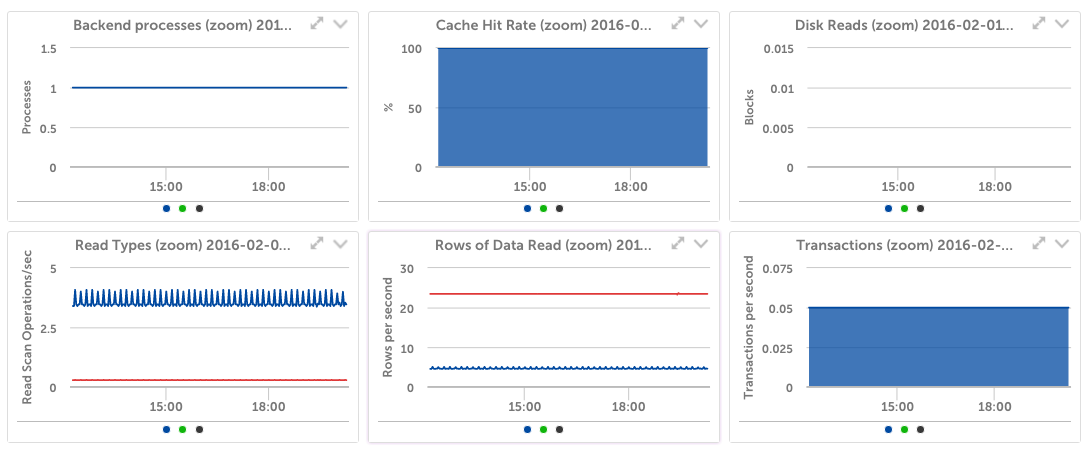
- What is the cache hit rate? DB disk reads per second?
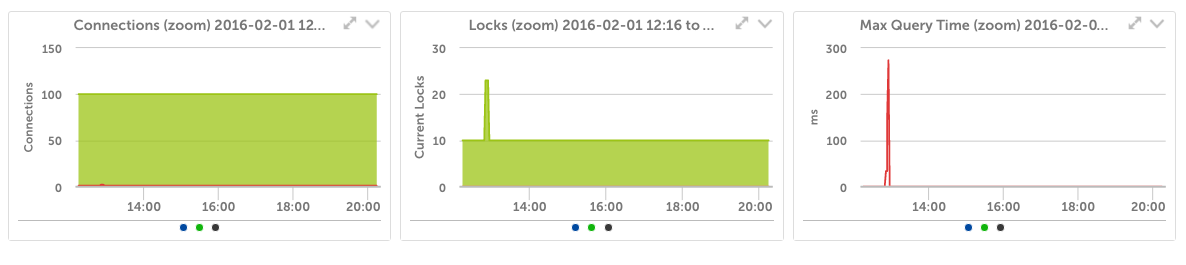
- How close am I to the maximum connections?
- Why did my disk activity increase after the last release?
To fully monitor PostgreSQL databases, all you need do is enter the hostname. That’s it. LogicMonitor will discover the device type, and, if it’s a windows or linux server running PostgreSQL, find the databases, all the drives, file systems, interfaces, etc. Intelligent alert thresholds will be set, alerting you to any issues in hardware, performance or configuration. All with no configuration on your part.
You can easily tell LogicMonitor to monitor the output of any query, extracting business and application specific monitoring and trending. Want to track dollars per minute? Customer transactions per hour? It’s easy with LogicMonitor.
Eliminate the chance of your customers knowing about outages before you do. Get monitoring that frees up time, and keeps up with your dynamic environment – LogicMonitor.
