The Java Management Extensions (JMX) framework is a well-known tool for any experienced Java developer. The purpose of the JMX framework is to simplify the management of local and remote Java applications while providing a user-friendly interface.
The Java Management Extensions (JMX) framework is a well-known tool for any experienced Java developer. The purpose of the JMX framework is to simplify the management of local and remote Java applications while providing a user-friendly interface.
The primary advantages of the JMX framework are that it’s highly reliable, scalable, and easy to configure. However, it’s also known for introducing the concept of MBeans, which unlocks the capacity for real-time Java application management. Here’s a closer look at the JMX framework and JMX monitoring.
Since Java 1.5, the Java Management Extensions (JMX) framework has been widely adopted as a user-friendly infrastructure solution to help manage both remote and local Java applications. Since JMX introduced the concept of MBeans, it helped to revolutionize Java application management and bring real-time management tools into the picture.
The features of JMX include the ability to:
Easily manage Java apps and services without making heavy investments of time or resources. Since JMX needs only a core managed object server, you can manage your Java apps without really impacting how they are designed.
Scale your management architecture as needed, without unnecessary complexity. Once you have set up the JMX agent service, it will run independently. Through this component-based approach, you can scale your JMX solution almost infinitely with hardly any changes necessary to the program itself.
Leverage flexible and dynamic solutions to help you stay on top of future concepts. With the ability to use emerging technologies, you can stay ahead of the competition without completely reworking your solution every time a new approach or technology is released.
Focus on managing your apps and services without a lot of legwork. You can certainly utilize JMX within a distributed environment, but the APIs make it simple to add management tools for your services, applications, systems, and networks.
As you can see, there are many reasons to utilize JMX if you’re currently working with Java applications. However, one of the best features of JMX is known as JMX monitoring. So, let’s take a closer look at how you can leverage it.
What Is JMX Monitoring?
The purpose of the JMX framework is to support monitoring and management initiatives for Java applications. By creating a generic system for monitoring Java applications, JMX monitoring unlocks some fundamental tools, such as notifications that can alert a team when an app needs attention or when the state of an application changes.
In addition to notifications, JMX monitoring can also help improve observability by exposing run time metrics and revealing resource utilization and allocation. One of the most crucial components to understanding JMX monitoring is the MBeans that help developers recognize and organize resources on their Java Virtual Machines (JVMs).
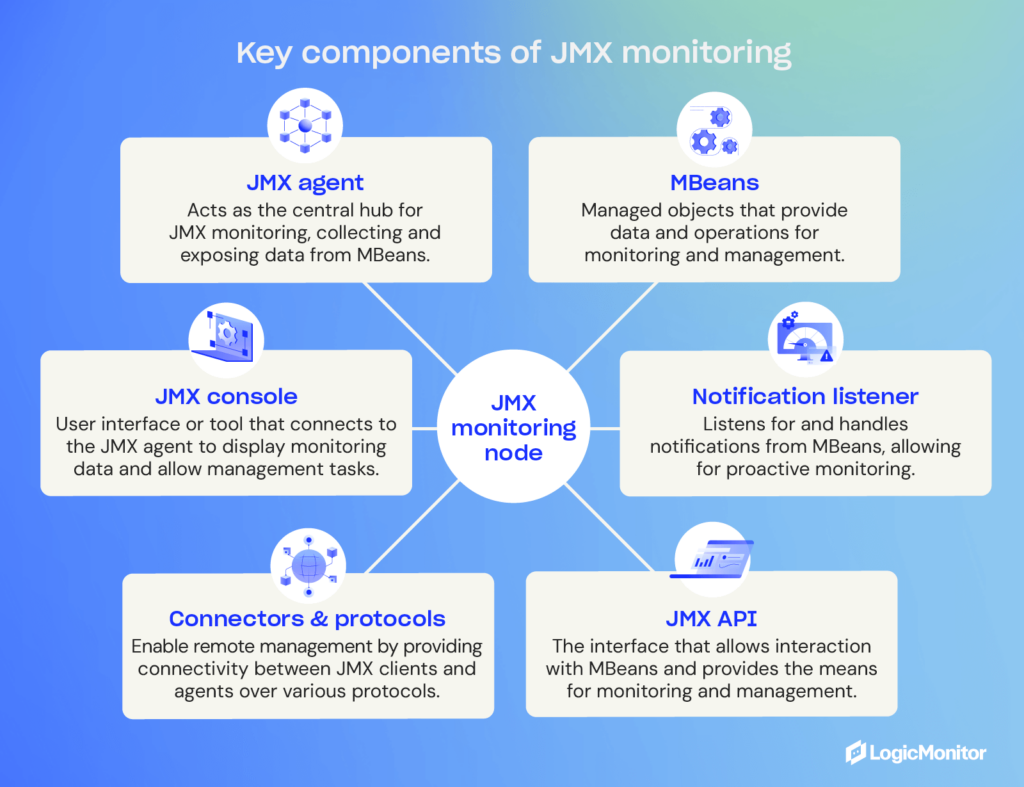
Overall, there are three tiers of components involved in JMX monitoring:
The probe or instrumentation level is made up of MBeans wrapped around individual resources.
The agent level consists of the MBean Server that exposes MBeans to applications on the next layer.
The management level is where the connectors exist that allow your remote applications to access the MBean Server for monitoring and management purposes.
With these things in mind, here’s a more thorough explanation of how MBeans work and what developers can do with them to improve the monitoring and management of their Java applications.
What Are MBeans?
Managed Beans, or MBeans, form the foundation for JMX monitoring. The purpose of an MBean is to represent a resource within a Java Virtual Machine (JVM) to make it easier to configure and utilize. Within the JMX console, developers can expose a resource/MBean using a JVM port. From the console, developers can also group your MBeans into domains to help them easily track where all of their resources belong.
When looking at a Java Virtual Machine (JVM), you’ll generally see multiple domains, each with many MBeans assigned to it. For instance, a Java application using tomcat might have domains named Catalina and Java.lang. The former would include all resources (MBeans) for the Apache tomcat container known as Catalina, and the latter would contain all of the MBeans for the JVM run-time.
Depending on how a team manages things, they can choose to create custom domains for individual applications. This flexibility is important because today’s applications have very different requirements, with some requiring only a small footprint and others needing significant resources. While teams can optimize applications themselves during development, optimizing a JVM run-time and container is often handled after the fact.
When it comes to run-time and container optimization for Java apps, many developers might already be familiar with how to alter heap size or garbage collection, but MBeans can also play a role by helping them to allocate resources where they’re needed most.
How Is Data Collected?
Now that you understand the big picture overview of how JVM monitoring works and what MBeans serve to do, it’s also worth explaining how data is collected within Java Virtual Machines (JVMs).
The technical explanation involves some mostly unseen components, including MBeans and an MBean Server. The MBeans themselves take on the role of Java wrappers for components, apps, devices, and services within your network. Meanwhile, the MBean Server is where you can find and manage the resources that the MBeans represent.
Therefore, the MBean Server is the central focus of your JMX monitoring endeavor. If you want to get technical, a JMX agent consists of the MBean Server and the services necessary to handle the MBeans, such as an application performance monitoring (APM) solution. This setup keeps your resources independent of whatever infrastructure you use to manage them, which provides added flexibility.
If you’re using remote management tools, there are standard connectors (known as “JMX connectors”) that you can use to connect things together regardless of communication protocols. This means that you can use JMX connectors to use systems and apps that are not compatible with JMX specifically, as long as they support JMX agents.
Comparing JMX Monitoring Solutions
Once JMX agents are in place, you’re one step closer to easily managing and monitoring your Java applications. However, another important part of the process is deciding which monitoring solution you wish to use. Some of the most popular include:
JConsole: Works alongside Java Management Extensions for both remote and local applications but is more ideal for development and prototyping than live deployments due to its intense resource consumption. Still, JConsole provides a wealth of information, including uptime, live threads, peak, etc.
JMX Console: This management console is used by JBoss and allows developers to tap into the raw data produced by MBeans and unlocks the option to start or stop components and complete simple tasks. Keep in mind that JBoss is an open-source middleware solution provided by Red Hat, but a paid subscription is available for extra documentation and support.
JManage: If you’re working with distributed applications, JManage is an open-source solution that’s worth considering, and it offers both web-based and command-line interface tools. It also supports an SNMP network along with JMX. The team behind JManage strives to offer a solution suitable for managing entire production environments.
ManageEngine Applications Manager: If you’re interested in an on-premises paid software package, ManageEngine is comprehensive enough to enable entire IT departments and DevOps teams to implement JMX monitoring on any Windows or Linux server. A professional and enterprise edition is available, depending on a client’s budget and requirements.
AppDynamics: Another paid solution, AppDynamics can provide additional flexibility since it is web-based. This platform is compatible with MBeans and can compile detailed activity reports for all your Java apps. Multiple tiers are available to fit various business sizes. This platform is part of the Cisco corporation and is widely trusted by enterprises.
LogicMonitor: We use LogicMonitor to monitor our own infrastructure using JMX metrics. Since it’s so customizable, we’re able to track individual processes for particular microservices to get an overall idea of the service’s health and performance. It can be really useful for knowing when things go wrong (hello alerts!) and for helping unlock bottlenecks (hello dashboards!).
Depending on your needs and preferences (e.g., on-premises versus web-based or open-source versus paid), there are several other JMX monitoring solutions on the market. You do your research to make sure that investing in this area is worthwhile and that you know what you want to achieve going forward.
Why Should I Monitor Java Applications?
There are countless reasons to monitor your Java applications, but the most significant advantage is unlocking a heap of performance metrics that can help you fine-tune your JVMs and applications to make sure you’re making the most of all resources available to you.
While many developers are familiar with how to configure garbage collection or other settings to help boost the performance of their Java apps, learning to use the JVM framework will take them that much farther when it comes to optimization.
If you’re on the fence about using JVM monitoring to keep tabs on your Java applications, here are some practical reasons and considerations to keep in mind:
Through monitoring, you can identify issues and potential issues sooner, giving you the best opportunity to correct them before they harm your end-users.
By revealing the number of resources being consumed by your applications and understanding specific metrics and usage patterns, you can help avoid downtime and delays by allocating more resources when and where they’re needed.
In the case of applications with a smaller footprint that don’t require a lot of resources, you can improve resource utilization across the board by taking unused resources away and allocating them elsewhere.
The right metrics can help reveal bottlenecks and room for improvement, allowing you to speed up applications and improve the end-user experience.
Overall, there are countless reasons to pursue Java application monitoring and very few reasons not to. Especially when using JMX monitoring, which is relatively easy to use and implement, your business is likely to notice far more improvements and advantages than it will negative impacts on staff or internal resources.
Why Is JMX Monitoring Important for DevOps?
DevOps teams rely on powerful monitoring tools to better understand how development work behind-the-scenes impacts operations and vice versa. Monitoring tools like JMX can reveal opportunities to boost operational performance by re-evaluating the development processes that negatively impact an application.
Likewise, JMX monitoring can reveal information to the operational team about where future development projects may be necessary or tell the development team how operations are utilizing (or not utilizing) an app. Altogether, JMX monitoring provides numbers that increase observability and helps DevOps work together to achieve better outcomes.
Conclusion
Fine-tuning Java performance has long been a focus of Java developers everywhere, but there are few approaches that don’t require heavy time and resource investments. That’s why combining JMX with the correct monitoring tool is one of the easiest ways to give your team a headstart on understanding and improving the performance of your Java apps.
Whether you’re hoping to better allocate resources to help you keep scaling up, set up notifications to minimize negative end-user experiences, or keep an eye on the numbers to ensure continued success, JMX monitoring offers a suite of tools that can help you get there with ease.
If you are running Java applications, there are a few reasons not to use JMX monitoring. Thanks to its ease of use and plentiful documentation, your team will likely find that implementing and utilizing JMX monitoring is far easier than any manual processes you may already have in place — and your results will improve ten-fold.
FAQs
What’s the difference between JMX monitoring and general application monitoring?
JMX monitoring focuses on Java-specific runtime data, like memory usage, threads, and MBeans activity inside a Java Virtual Machine. General APM tools monitor broader application behavior across multiple languages, user transactions, and infrastructure.
Can JMX monitoring safely be used in production environments?
Yes. JMX monitoring is production-ready when configured securely. Tools like LogicMonitor or AppDynamics are designed for minimal overhead, while exposing valuable performance metrics without impacting the app’s behavior.
How do I secure remote JMX connections?
Secure JMX with SSL/TLS for encryption, require authentication (via access files or Java security managers), and limit access through firewalls or VPC rules. This ensures Java Virtual Machine telemetry is protected against unauthorized access.
Is JMX monitoring helpful for containerized Java apps?
Absolutely. JMX helps surface MBeans and runtime data inside containers by providing visibility that’s often missing in containerized Java Virtual Machine deployments. Many tools support collecting JMX data from containers via agents or sidecars.
How can JMX monitoring help reduce infrastructure or cloud costs?
By analyzing performance metrics, you can identify over-provisioned JVMs, reduce unnecessary resource allocations, and tune configurations to gain better efficiency and cost savings.
What’s the main value of JMX monitoring for DevOps teams?
For DevOps, JMX exposes JVM health and runtime metrics that can feed into CI/CD pipelines, dashboards, and alerts. This helps you align code performance with operational goals and detect problems earlier.
What’s a key limitation of relying only on JMX monitoring?
JMX focuses solely on Java Virtual Machine internals. It won’t monitor non-Java services, databases, or external APIs, so it’s best paired with full-stack observability tools for a complete picture.
By Dan Ha
Dan Ha is a senior growth marketing manager at LogicMonitor with over 10+ years of expertise in organic strategies for B2B SaaS. Based in the SF Bay Area, he’s passionate about making complex topics accessible and exploring how technology shapes our daily lives.
Disclaimer: The views expressed on this blog are those of the author and do not necessarily reflect the views of LogicMonitor or its affiliates.