Enterprise Monitoring

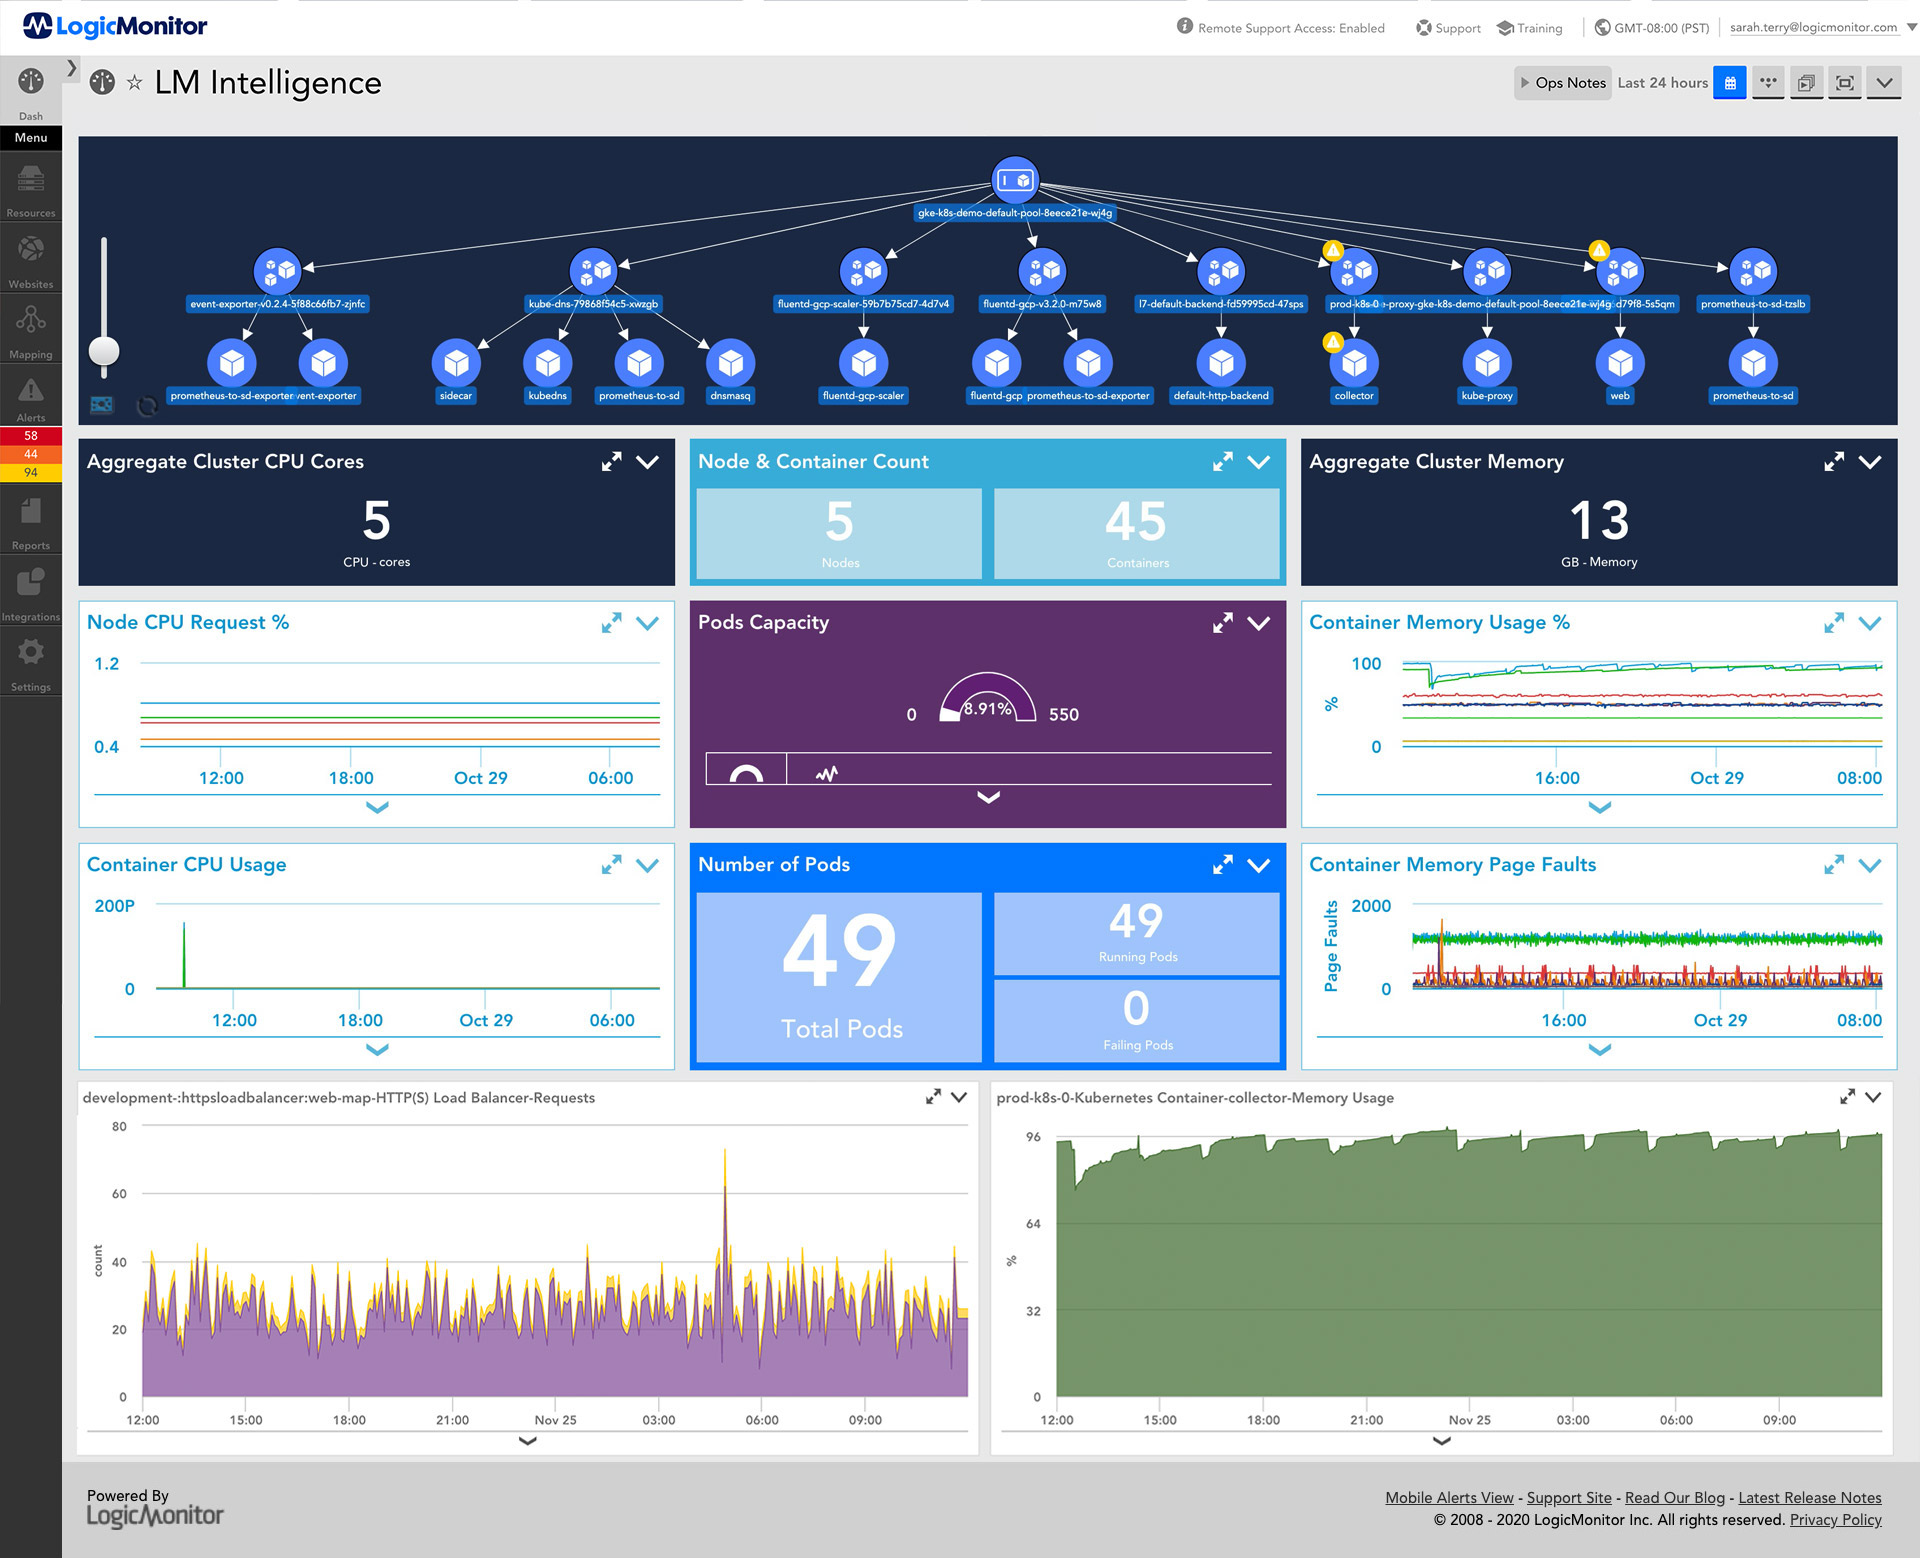
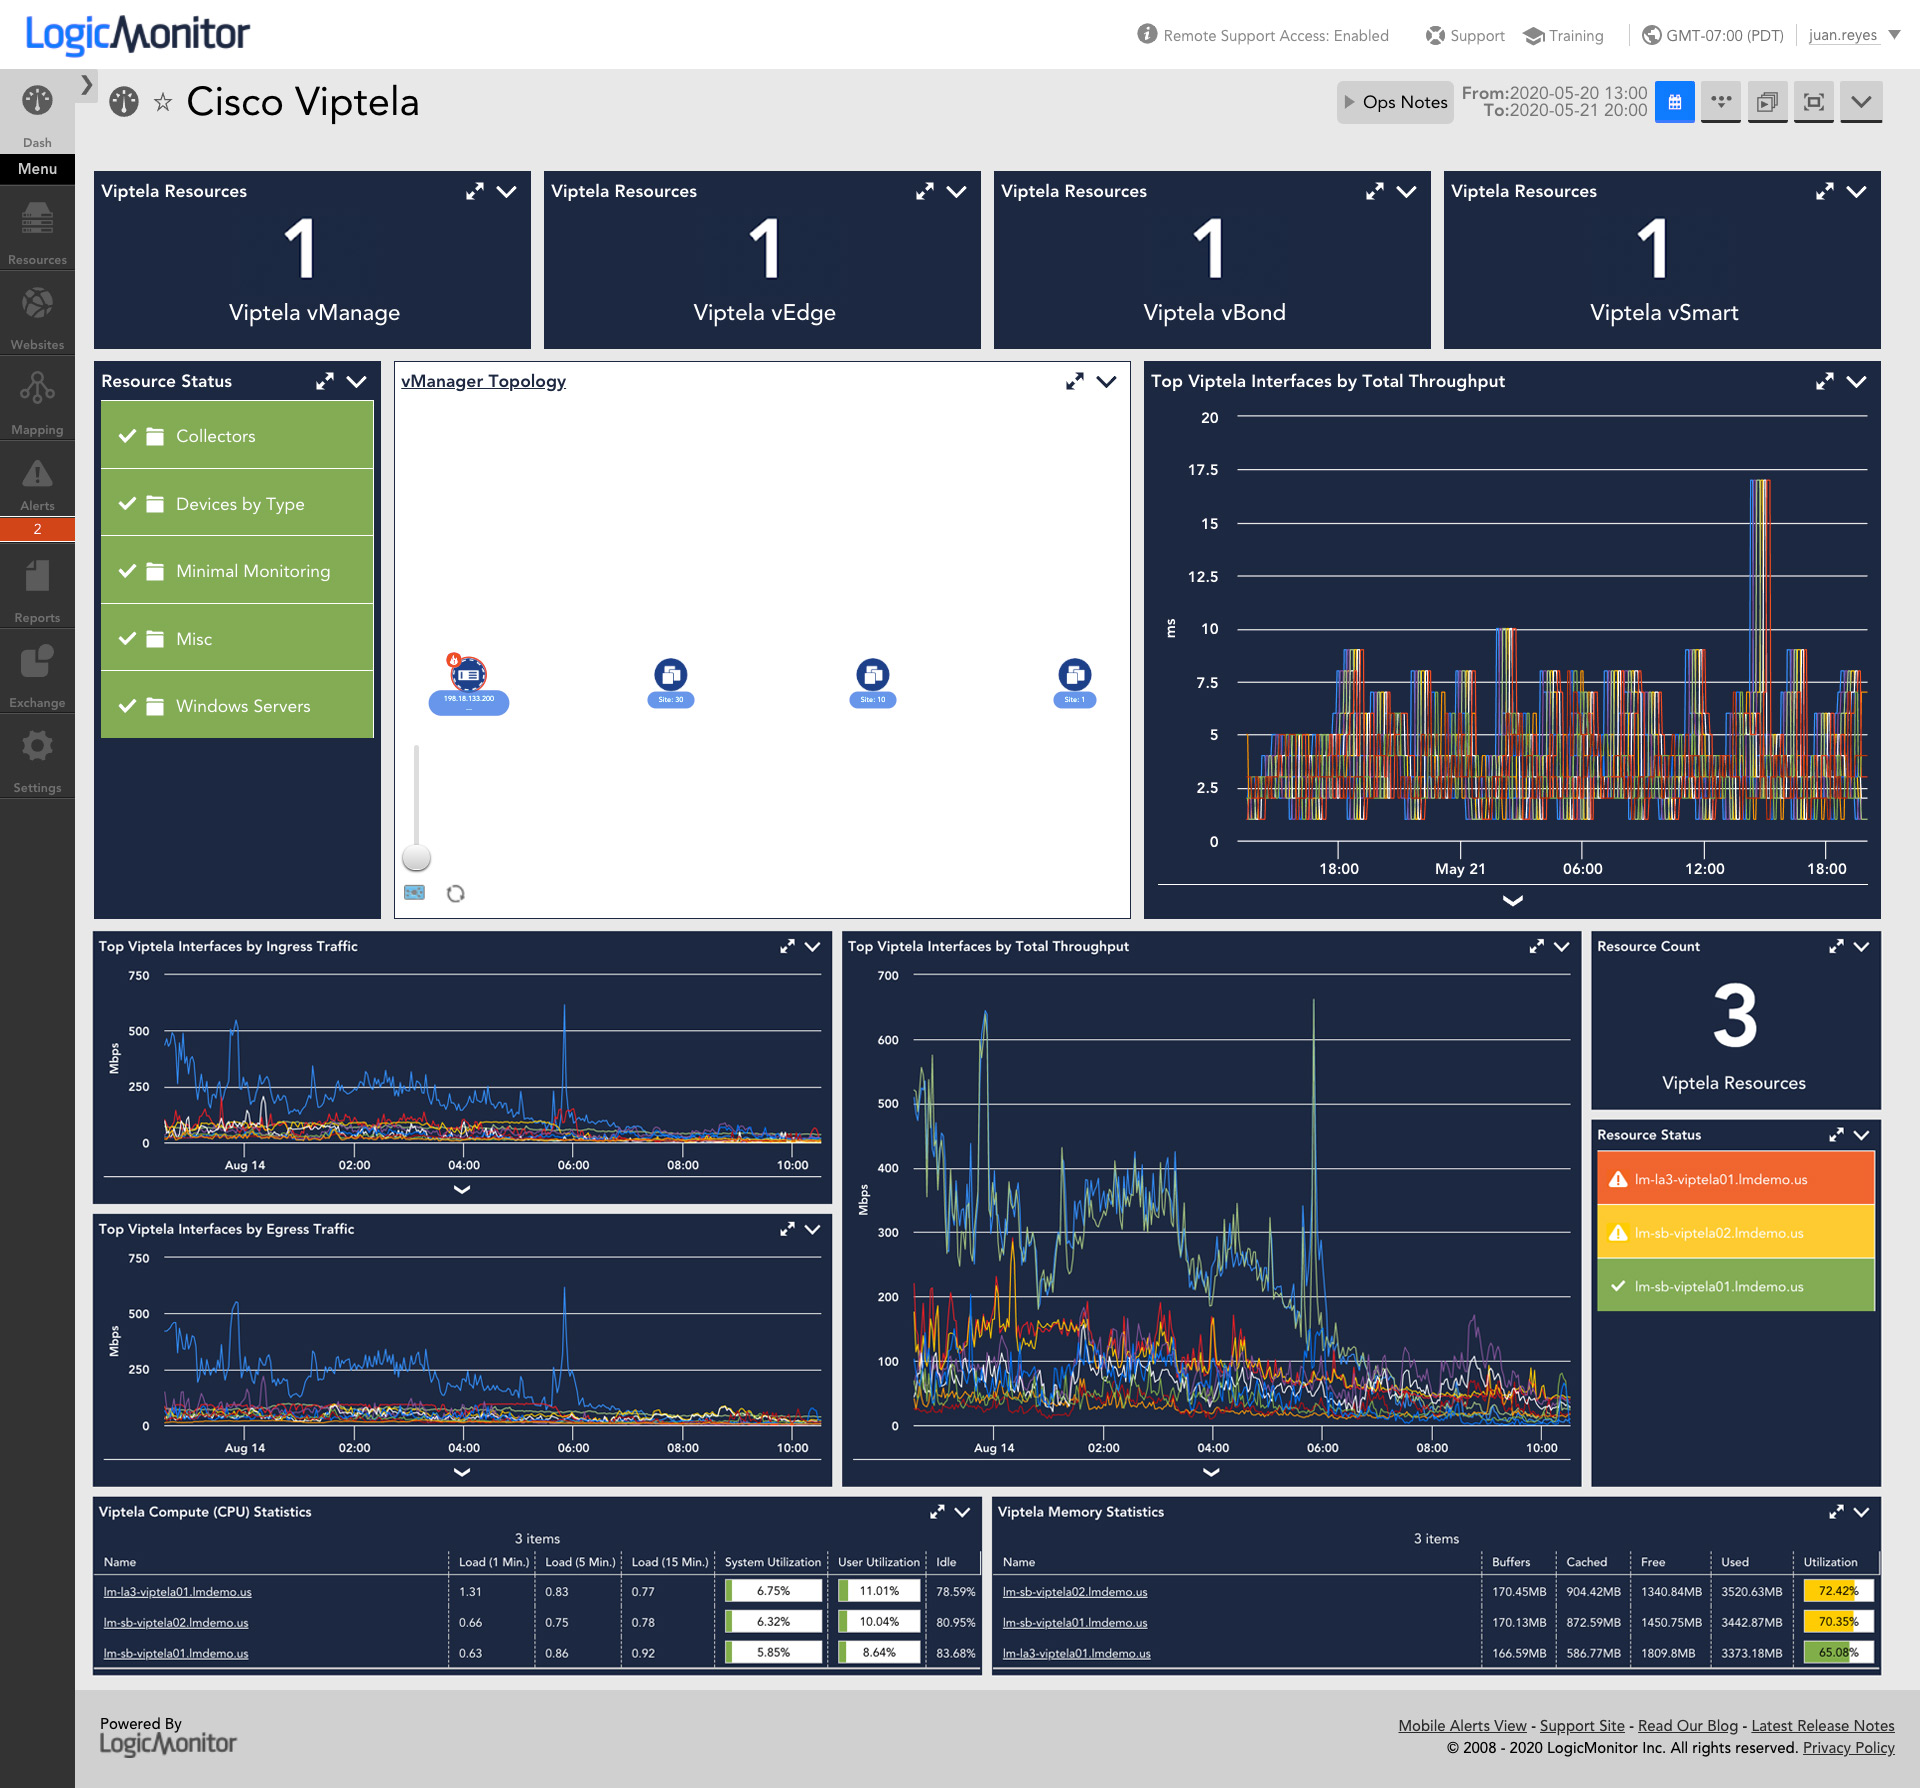
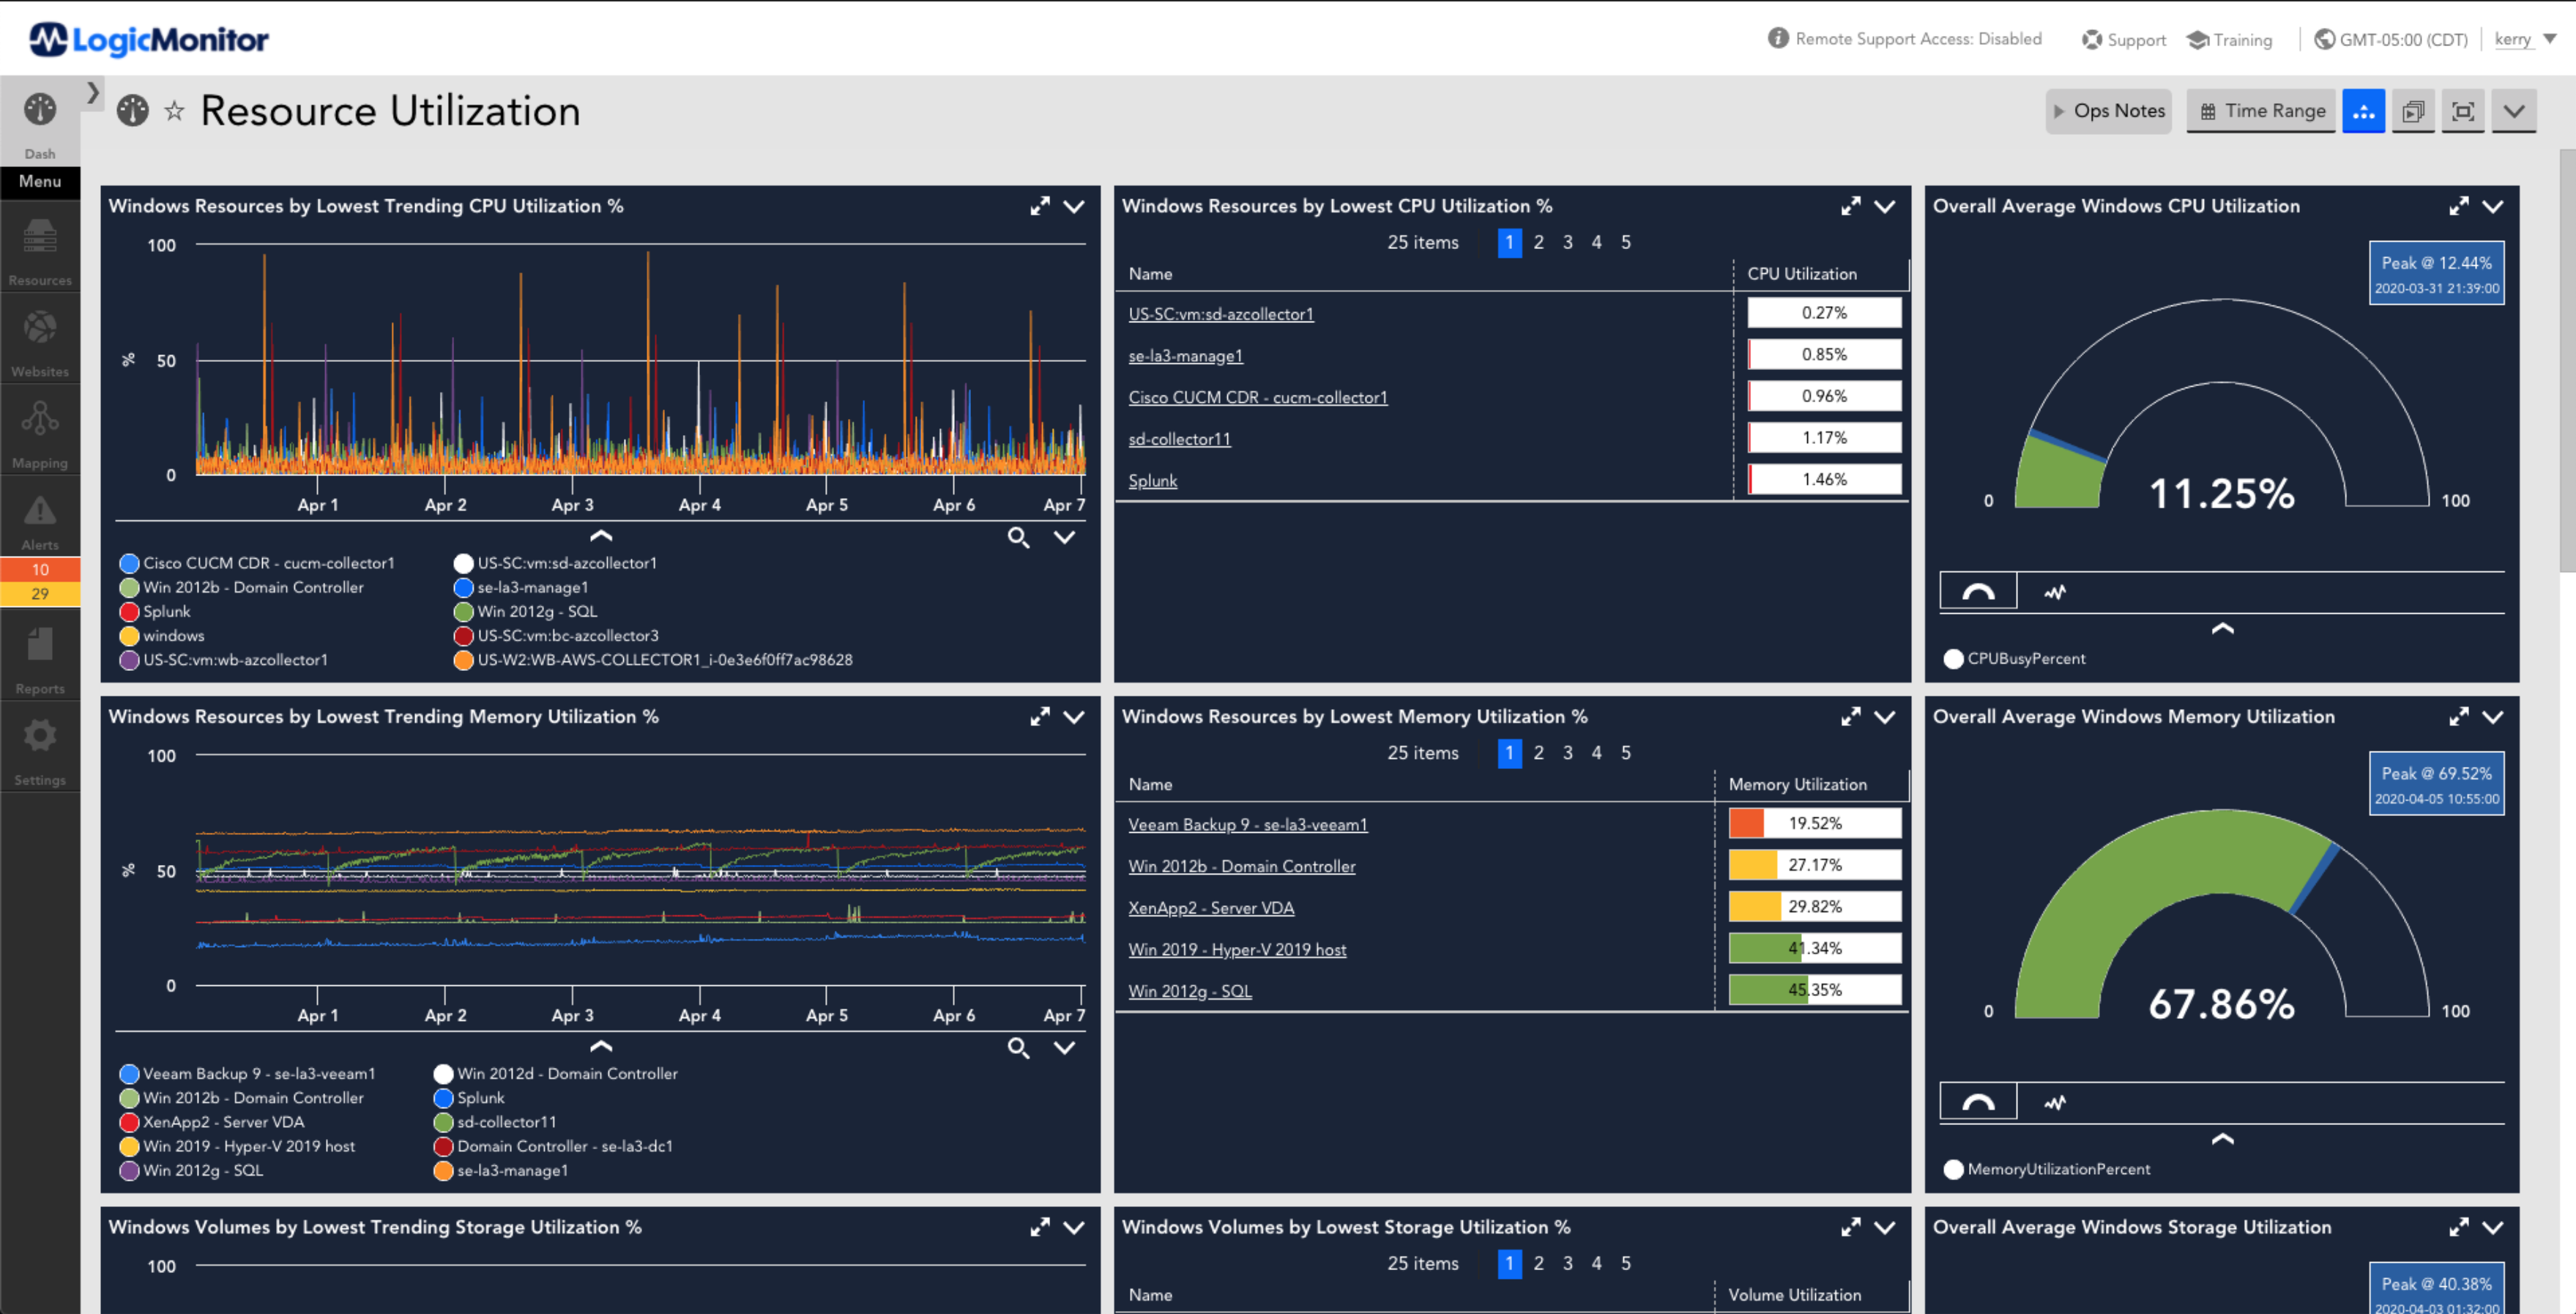
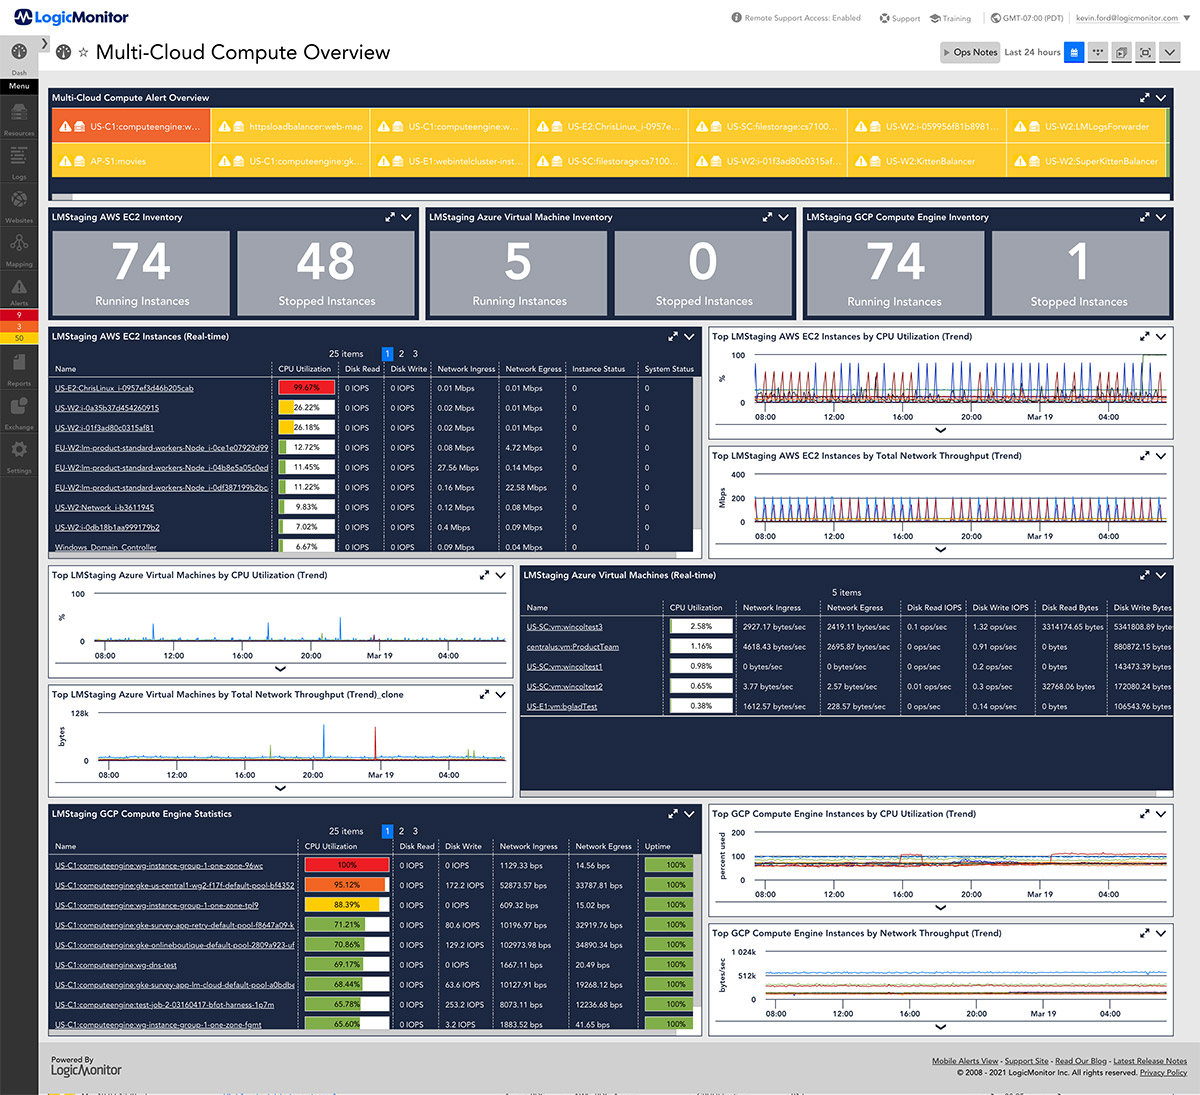
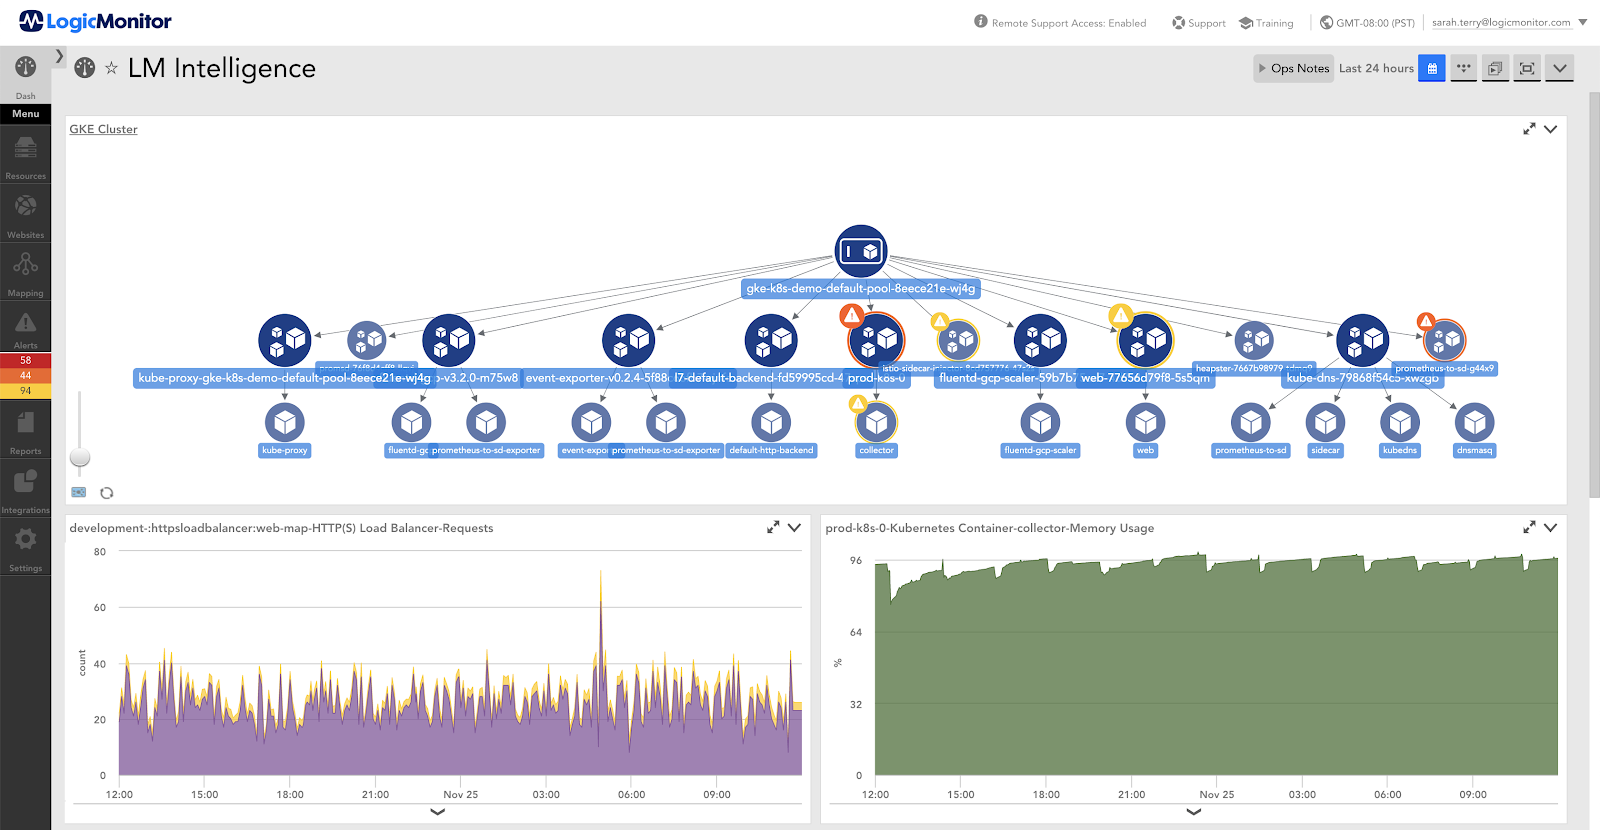
Partnering with LogicMonitor allows you to go beyond traditional uptime monitoring and achieve real-time observability into IT infrastructure. Reduce mean time to resolution and accelerate development with monitoring intelligence for enterprise teams.

"LogicMonitor is a valuable partner, constantly innovating and adapting to our business needs."

"LogicMonitor is a valuable partner, constantly innovating and adapting to our business needs."

"LogicMonitor is a valuable partner, constantly innovating and adapting to our business needs."

Let’s get started

Fill out the form below to get started

"LogicMonitor is a valuable partner, constantly innovating and adapting to our business needs."

"LogicMonitor is a valuable partner, constantly innovating and adapting to our business needs."

"LogicMonitor is a valuable partner, constantly innovating and adapting to our business needs."

Enterprise Observability Made Simple

Gain visibility into complex enterprise environments, including networks, cloud, containers, servers, and more within a single pane of glass. Enterprise customers have exclusive access to LogicMonitor’s AIOps capabilities that help prevent system outages and optimize service delivery.

  • Monitor on-prem and cloud-based infrastructure in the same platform with automated deployment and configuration
  • Reduce MTTR with root cause analysis
  • Diminish noisy alerts with dynamic thresholds
  • Illuminate patterns with rich visualizations and topology
  • Enable automation with integrations for BigPanda, Chef, Puppet, and more.
LM Intelligence Enterprise performance monitoring dashboard showcasing AIOps capabilities of LogicMonitor

Seamless integrations your teams rely on

Integrations_Navy__Servicenow
Integrations_Navy__Terraform
Integrations_Navy__VMware

No network is too complex

Enterprise infrastructure includes a combination of network technologies, so we’ve made it easy to monitor complex networks (with rich visualizations, topology, and root cause analysis) right out of the box. With support for next-gen (software-defined) and traditional network infrastructure in the same platform, LogicMonitor helps you turn network monitoring into network intelligence.

Cisco Viptela dashboard

Rapidly deploy and optimize servers

Server monitoring requires more than simple CPU and memory alerting, but shouldn’t need strenuous manual configuration. With LogicMonitor, enter an IP address or hostname, and setup is complete. LogicMonitor will automatically detect, monitor, and alert on cloud, on-premise, and virtualized server environments generating actionable data that helps guide IT operations.

Monitor your entire stack in one place.

Eliminate tool sprawl with deeper insights into the health and performance of your cloud and on-prem infrastructure within a single platform. Make hybrid monitoring a breeze with support for servers, databases, cloud, containers, networks, applications and more. Our library of over 2000+ integrations allows you to optimize performance for your entire IT stack in minutes.

multi cloud overview dashboard showing GCP and AWS performance inside of LogicMonitor

WHY LOGICMONITOR

Enrich IT operations with machine learning and AI

LogicMonitor’s Early Warning System (AIOps) will detect the warning signs and symptoms that precede issues, such as patterns or anomalies in alerts or performance data, and warn users accordingly. These early warnings will be able to trigger actions, such as integrations and custom scripts, to prevent issue occurrence. By warning users sooner, this Early Warning System will help enterprises prevent outages, saving them time, money, and avoid negative impact on their brands.

LM Intelligence Topology map and dashboard

From our customers

IT leaders love LogicMonitor

Real results. Real voices. See how IT leaders use the LM Envision platform, including Edwin AI, Service Insights, and more, to reduce alert noise, resolve issues faster, and cut MTTR across hybrid environments.

"Edwin AI cut noise by 90% & ITSM incidents by 76%, enabling better customer service."

Joshua Powell
Managed Services Lead of Nexon
Nexon

"The single pane of glass across all of our regions enables us to act more proactively."

Dominik Hunn
Systems Engineer of Franke Group
Franke Group

"Edwin AI delivered value within an hour of implementation."

Kris Manning
Global Head of IT Networks of Syngenta
Syngenta

"Capital Group has 1,000+ alerts/ day. LogicMonitor will eliminate that noise."

Shawn Landreth
VP of Networking and Reliability Engineering of Capital Group
Capital Group

"LogicMonitor helps us succeed by being a true partner."

Andrea Curry
Director, Observability & Scheduling of McKesson
McKesson

"LogicMonitor is a valuable partner, constantly innovating and adapting to our business needs."

Rafik Hanna
SVP, Topgolf Technologies of Topgolf
Topgolf

One platform for unified observability

Metrics icon

Metrics

A single platform for ITOps and DevOps eliminates data silos and tracks metrics that matter. Built with hybrid infrastructure in mind, a vendor-neutral approach helps IT teams better understand the user experience and accelerate business transformation.

Logs icon

Logs

Log intelligence at scale – instant access to contextualized and correlated logs and metrics in a single, unified cloud-based platform. With tiered retention options, including unlimited retention, and hot storage to optimize data hygiene and internal compliance initiatives.

Traces icon

Traces

Never miss an application error, improve code quality, and diagnose and fix issues faster. Gain insight into the performance of the entire app stack, from code to cloud, to ensure a flawless customer experience in agile environments.

Ready to level up?

Get full visibility, instant troubleshooting, and proactive alerting—all in one platform.