You can automatically track your Amazon Web Services (AWS) CloudWatch custom metrics in LogicMonitor Cloud by enabling Active Discovery in a DataSource. Active Discovery regularly checks for changes in your monitored environment and updates the relevant resource properties. For more information, see “What is Active Discovery?“
Getting Metrics from AWS CloudWatch
To retrieve the AWS CloudWatch custom metrics, the LM Cloud DataSource needs to call AWS CloudWatch ListMetrics with the following request parameters:
| Parameter | Description |
| namespace | The name space to filter against. |
| metric name | The name of the metric to filter against. |
| dimensions | The list of dimensions to filter against. Each dimension contains a name and value. |
The results returned by ListMetrics are not filterable by time and their content depends on the metrics available based on AWS CloudWatch’s retention for metric data:
| Frequency | Retention Period |
| Data points with a period of less than 60 seconds (high-resolution custom metrics) | 3 hours |
| Data points with a period of 60 seconds (1 minute) | 15 days |
| Data points with a period of 300 seconds (5 minutes) | 63 days |
| Data points with a period of 3600 seconds (1 hour) | 455 days (15 months) |
CloudWatch Metric Timestamps Delay
When receiving metrics from AWS CloudWatch you will observe a discrepancy in the timestamps for when the metric happens, when it is published to AWS CloudWatch, and when it is ingested by LogicMonitor. This delay is illustrated in the following chart:
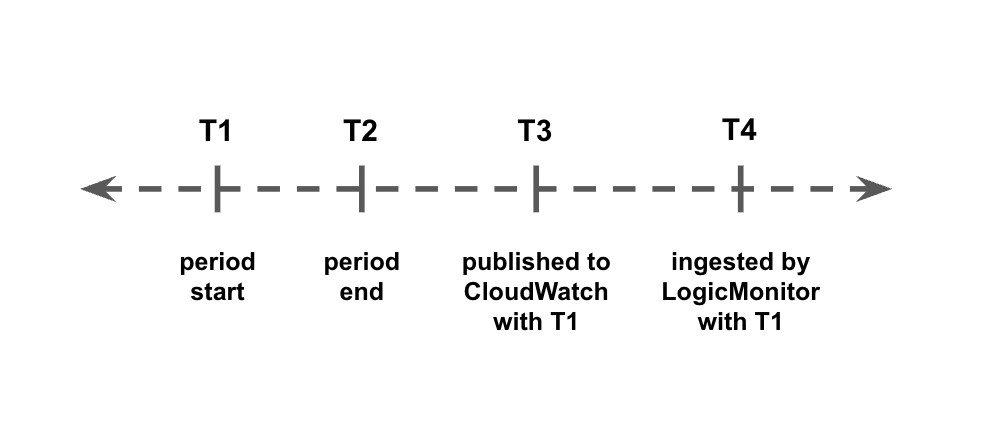
- The time period between T2 and T3 is a delay (typically between 2 and 3 minutes) between when the metric occurs and when it is published to AWS CloudWatch. You cannot control this delay.
- The time period between T3 and T4 is between 0 sec and the DataSource polling interval. You can control this time length by adjusting the polling interval.
Enabling Active Discovery
To enable Active Discovery, complete the following steps:
1. Navigate to Settings > LogicModules > DataSources.
2. From the Add drop-down list, select “DataSource”.
3. Enter the details in the Name, Displayed as, and Applies to fields.
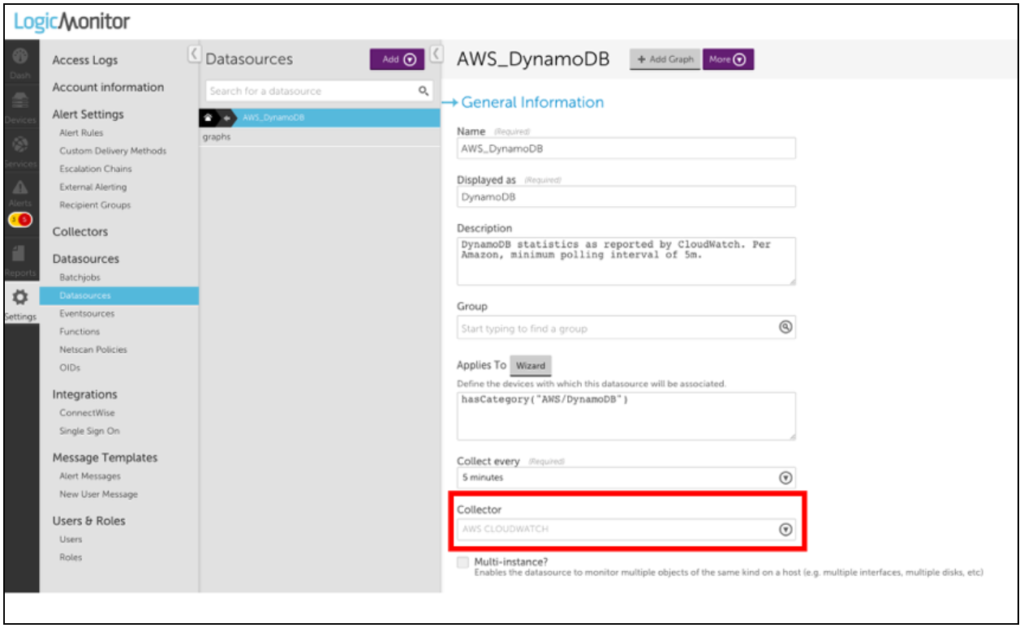
4. In the Collector field, select the “AWS CLOUDWATCH” option.
5. Enable Multi-instance and Enable Active Discovery options.
6. Under the Active Discovery options, in the Discovery Method field, select “AWS CLOUDWATCH”.
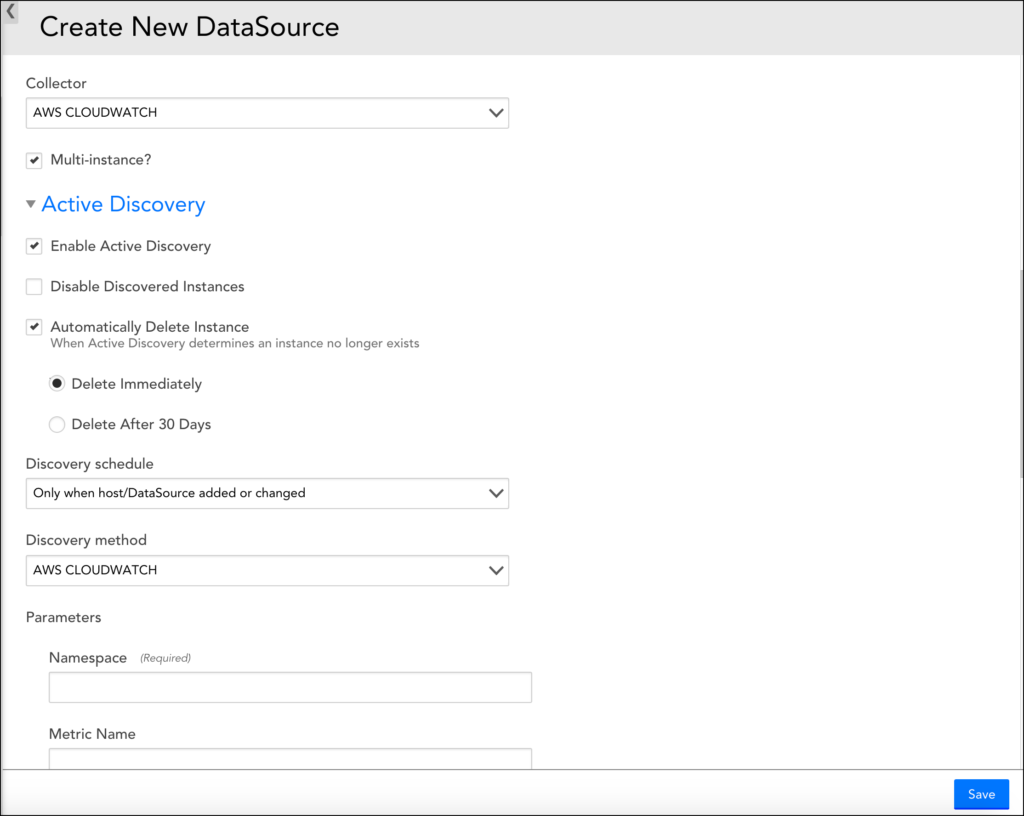
7. Set the following parameters:
| Parameter | Description |
| Namespace | (Required) The namespace to filter the metrics. |
| Metric Name | (Optional, available since version 136) The name of the metric to filter against. Use this to monitor a single specific metric. |
| Device Dimension Name | (Required) The Cluster or Domain Dimension Name to filter the metrics against the device. The value is read from the AWS Properties and is case sensitive. You will need to specify which LogicMonitor property matches this in Device Dimension Value. Example: DomainName. |
| Device Dimension Value | A wildcard value from the instance’s LogicMonitor properties. Example: ##system.aws.DomainName## |
| Instance Dimension | (Required) The name of the dimension used to discover the nodes/instances. For example, “NodeId” adds the AWS NodeId in the metric path. |
| Metrics Period | (Optional) Specifies how often the metrics we are trying to pull are published. If blank, it shows all metric periods. |
The following is an example of a metric path:
AWS/ES>DomainName:##system.aws.DomainName##>NodeId:##WILDVALUE##>CPUUtilization>Maximum
When instances are found, the path translates to:
AWS/ES>DomainName:testdomain>NodeId:TeSt1234>CPUUtilization>Maximum
To monitor Amazon Connect service integrations, you need to add the AWS Connect DataSource to your LM portal account and add AWS Connect instances.
Add the AWS Connect DataSource
The AWS Connect DS gathers metrics reported by AWS CloudWatch for each monitored AWS Connect instance.
To add the AWS Connect DataSource to your LM account:
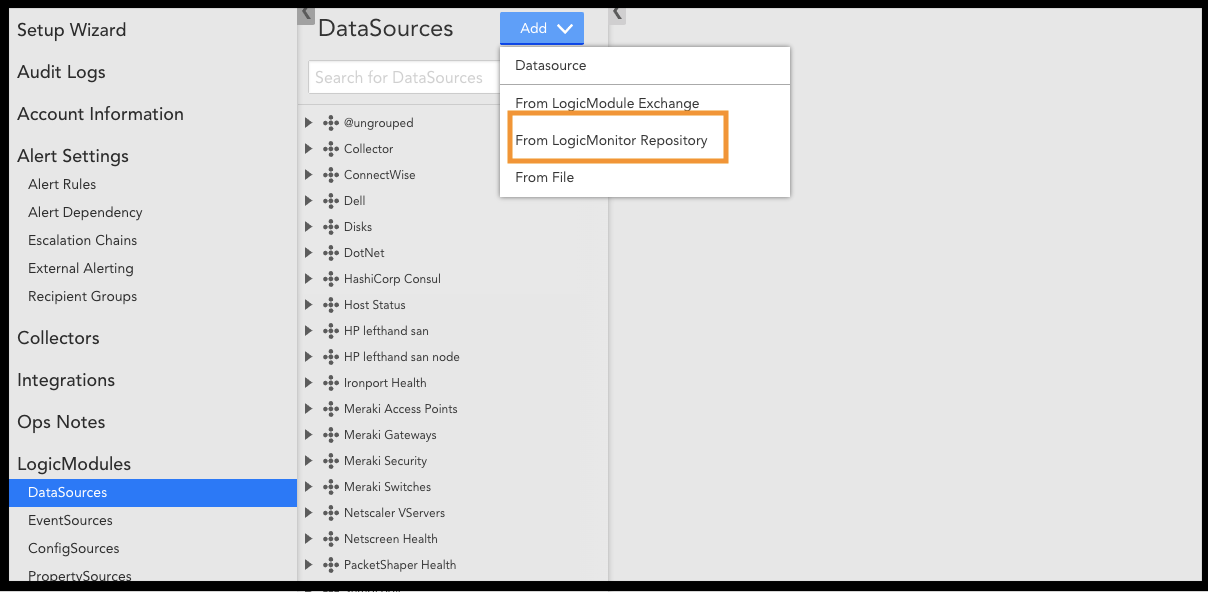
1. Navigate to Settings | LogicModules | DataSources.
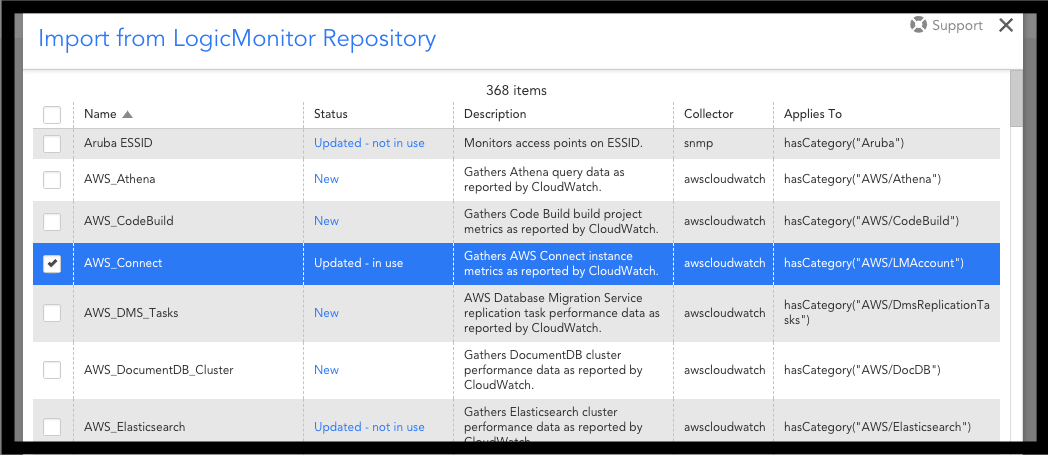
2. Click Add and select “From LogicMonitor Repository”.
3. In the “Import from LogicMonitor Repository” dialog, enter the Server name and your credentials to access the repository. Then click OK.
4. From the list of LogicModules, select “AWS_Connect”.
Add Amazon Connect Instances
Because Amazon Connect does not provide Auto Discovery, you will need to manually add each Amazon Connect instance.
To add an Amazon Connect instance:
1. Navigate to your AWS Account instance under Resources. This will be labeled: “<AWS Account Name> Account”.
2. In your account page, click the arrow next to Manage to select “Add Monitored Instance”.
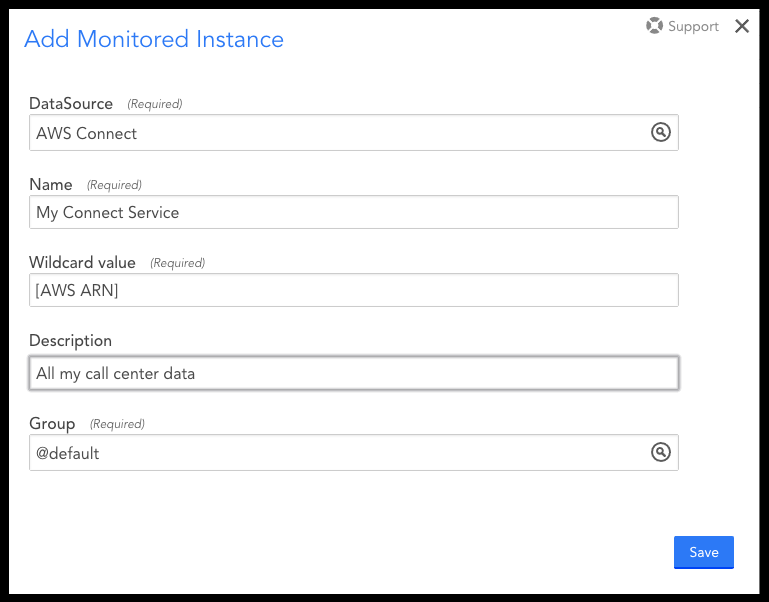
3. Under DataSource, search for “AWS Connect”.
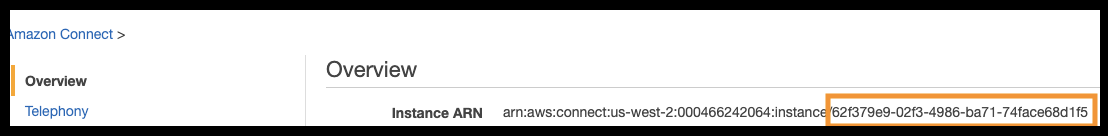
4. Under Wildcard value, enter the GUID part of the AWS ARN related to your Amazon Connect instance.
5. Save your settings.
You will start to see data from the monitored instance.
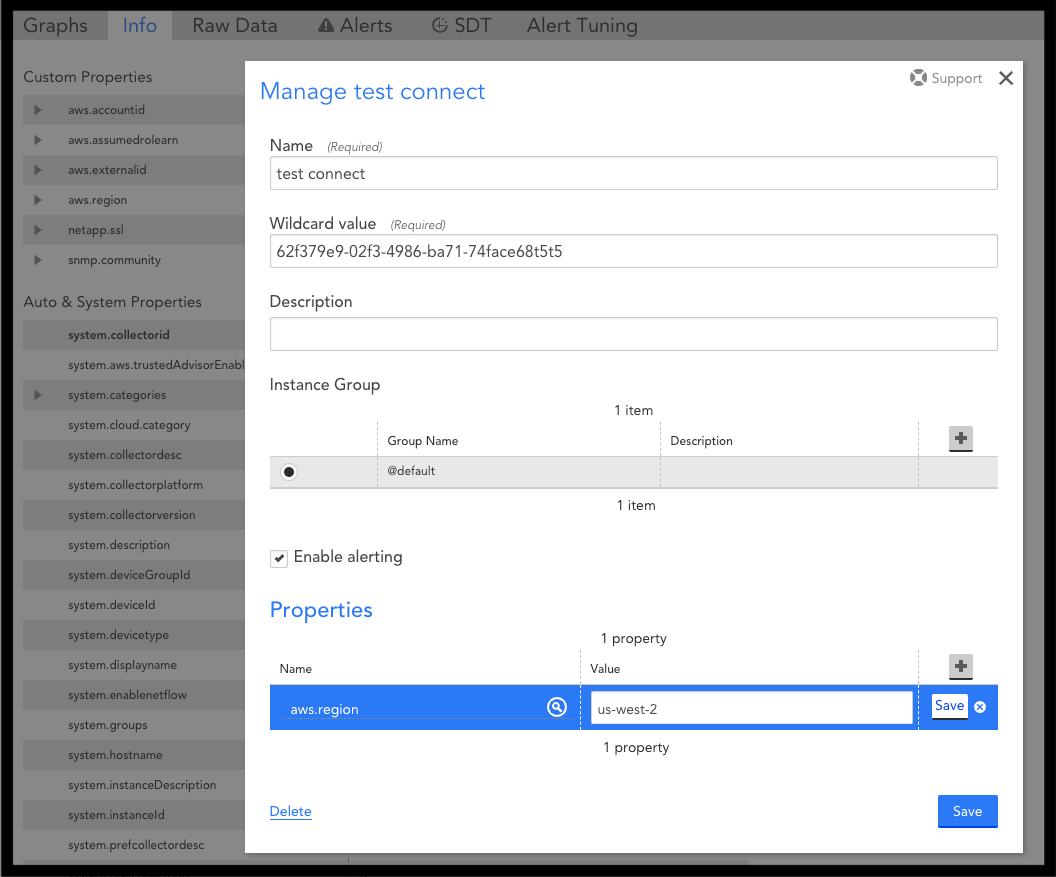
6. On the Info tab of your instance, add the AWS region of your Connect Instance as a property named aws.region to ensure the correct region is used to pull information for your Connect instance.
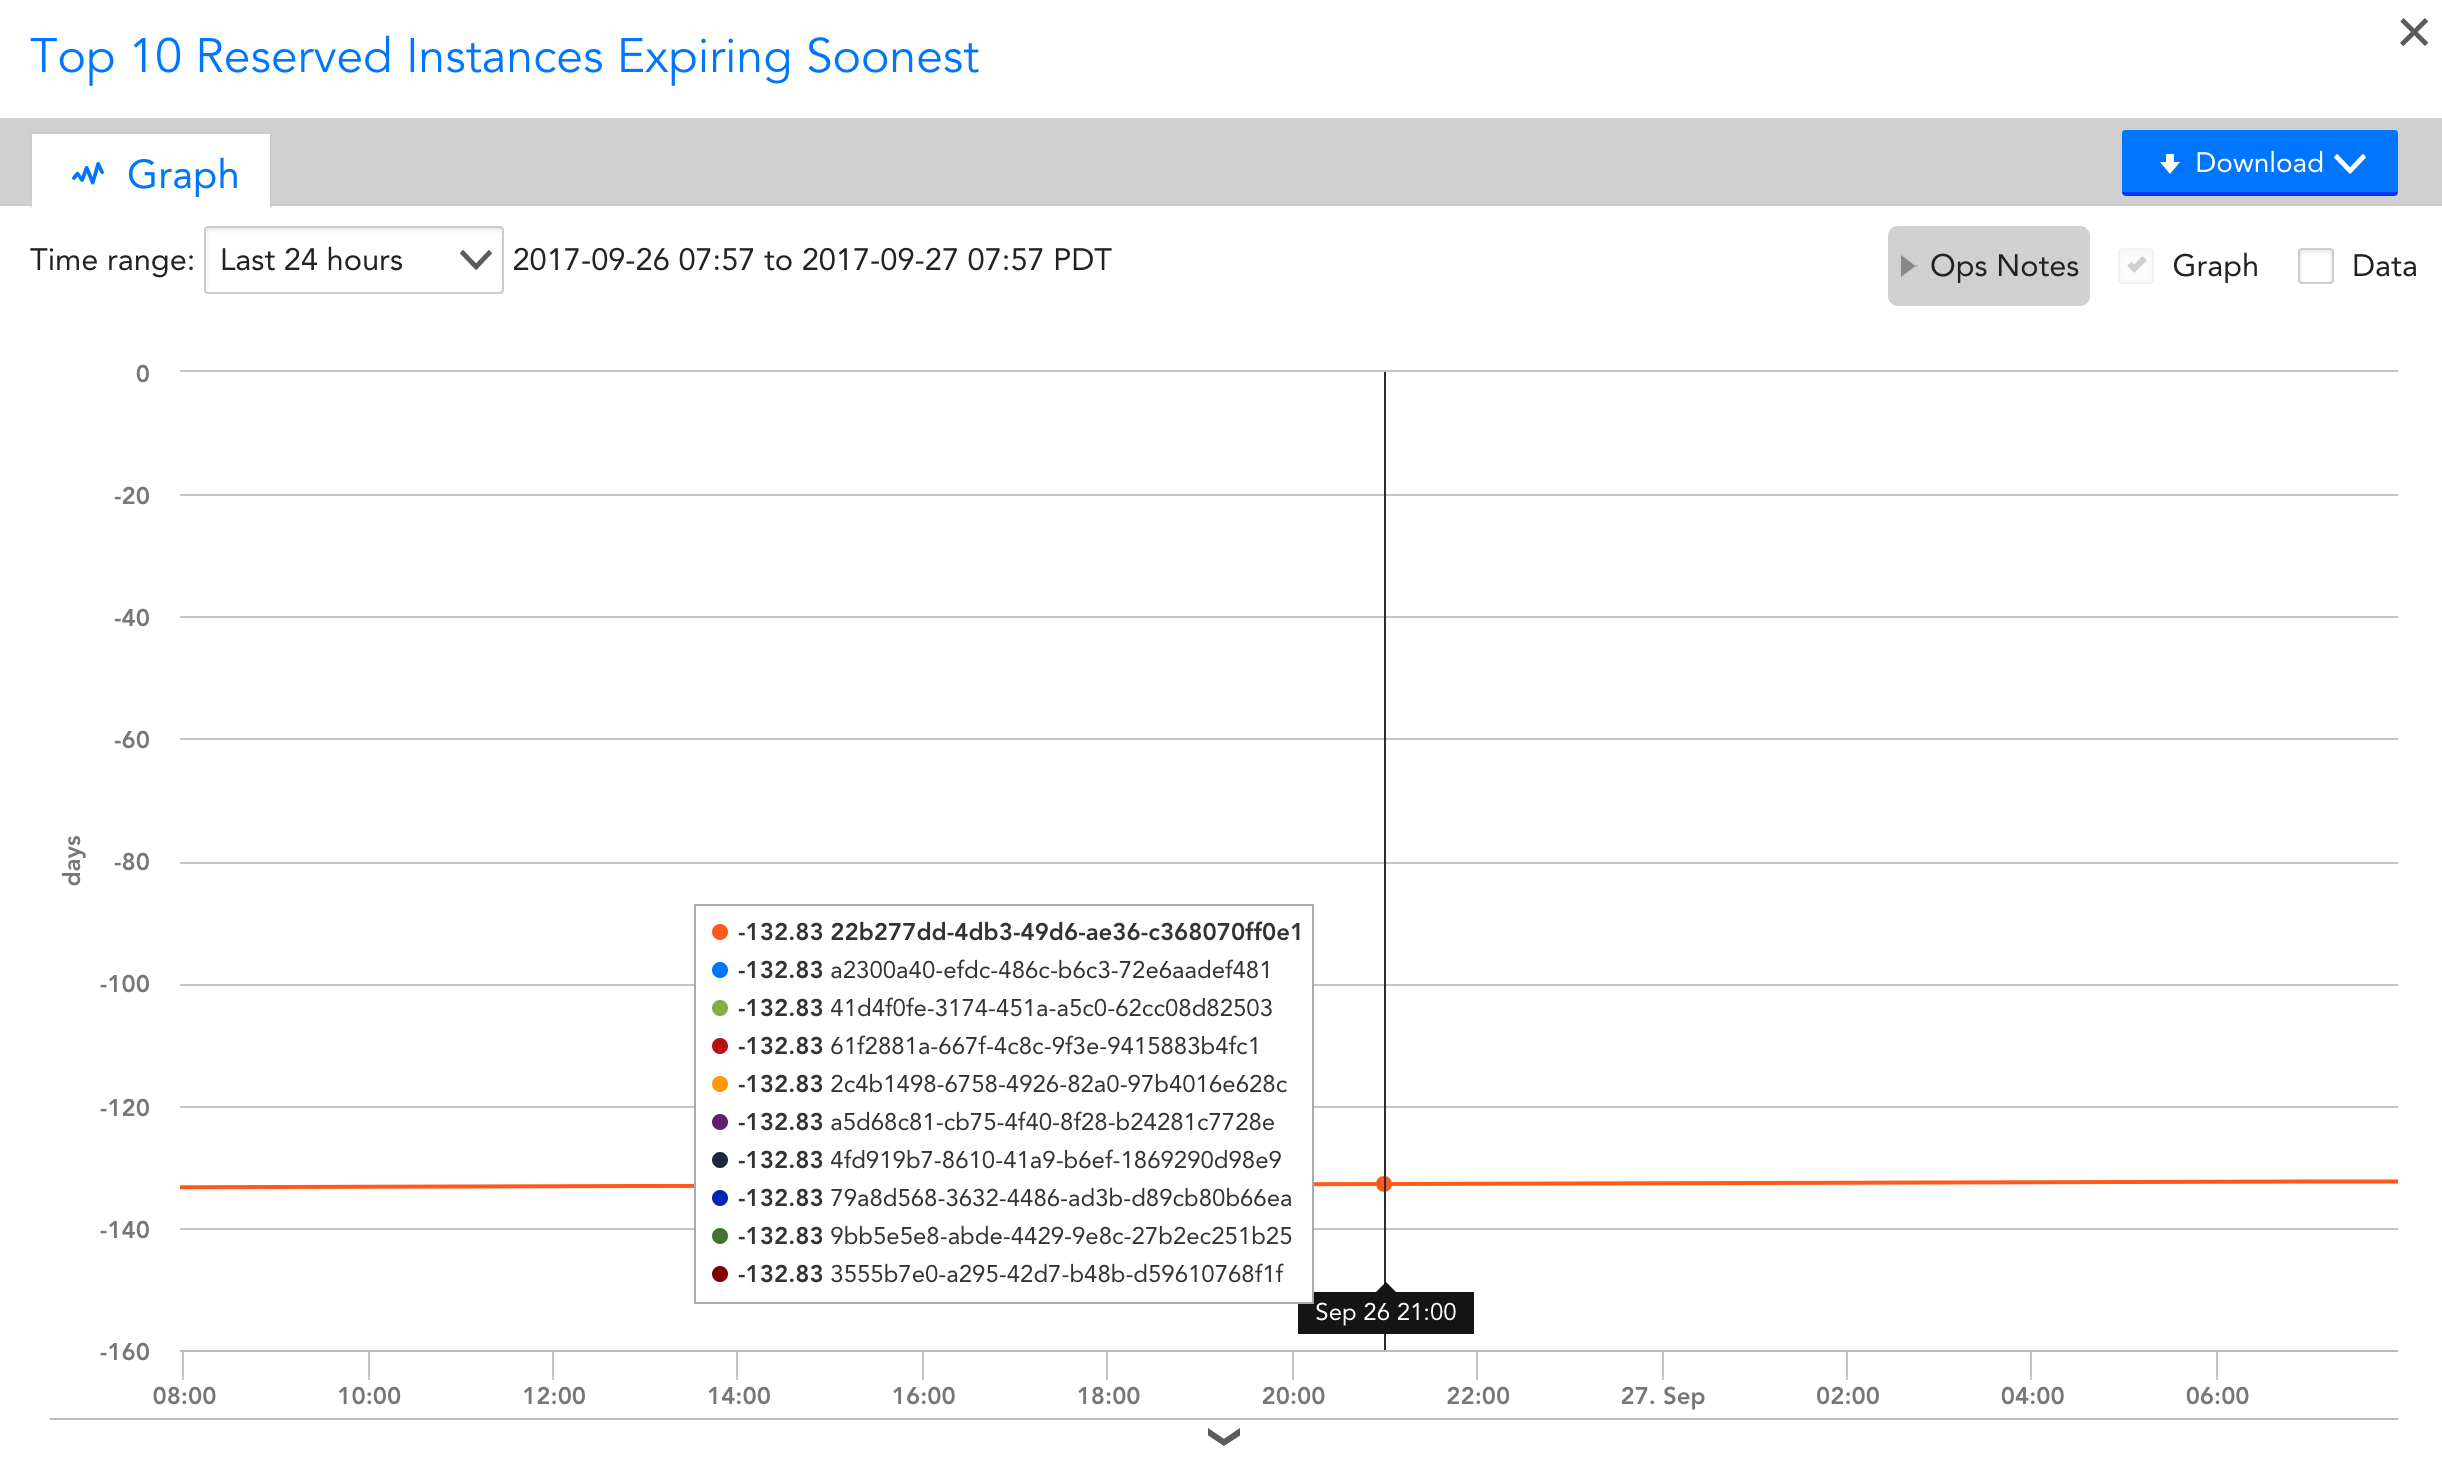
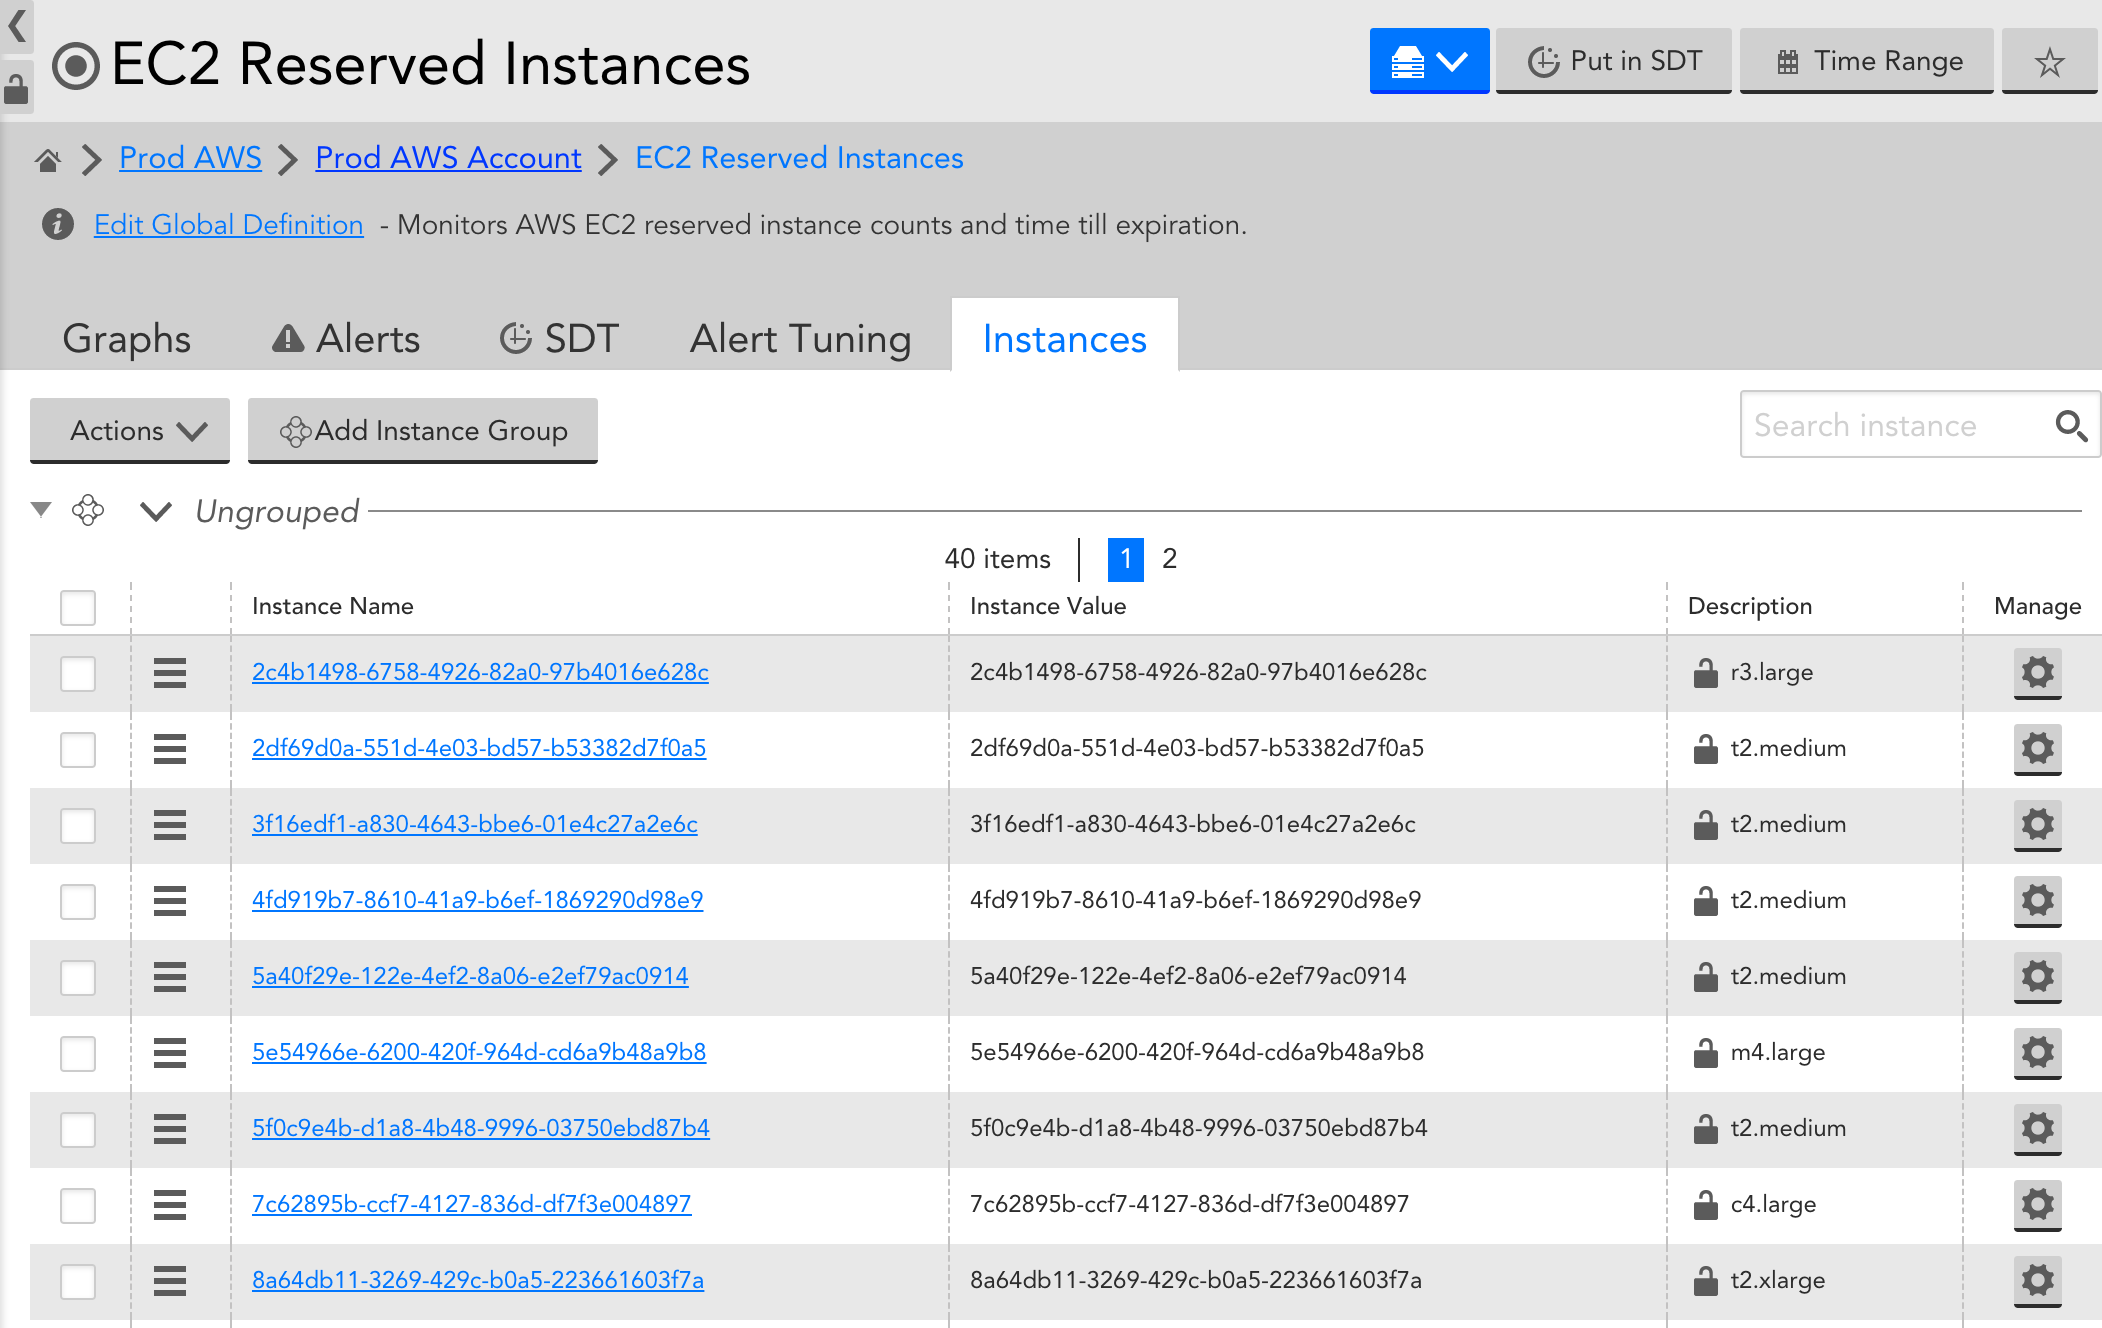
AWS Reserved instance offers can be a great way to save money, but it can be challenging to keep track of all of the expiration dates when you’re managing multiple offers. While an expired offer likely won’t impact performance of your cloud infrastructure, it can have significant effect on your bill.
With LogicMonitor’s EC2 Reserved Instances DataSource (AWS_EC2_Reserved_Instance) you can see all of your reserved instance offers, when they expire & what types of instances they apply to. All offers will be auto discovered as instances, with offer id as instance name and offer type as description, and time until expiration will be monitored and graphed.
LogicMonitor automatically discovers AWS and Azure resources for desired services and regions when you add your AWS and Azure environments for monitoring. By default, resources are added with the following naming scheme:
- AWS: Region:resourceName:resourceID (e.g. US-E1:ProdApp1:ib36178943)
- Azure: Region:serviceName:resourceName (e.g. US-E1:vm:ProdApp1)
You may want to change how resources are named when LogicMonitor discovers them. Such a rename option is available for AWS EC2 Instances and Azure VMs. When you add your AWS or Azure environments into LogicMonitor for monitoring, a ‘Rename Discovered Devices’ field is present for the EC2 service options for AWS, and for the VM service options for Azure. This field allows you to choose how discovered EC2 instances and VMs are named in LogicMonitor:
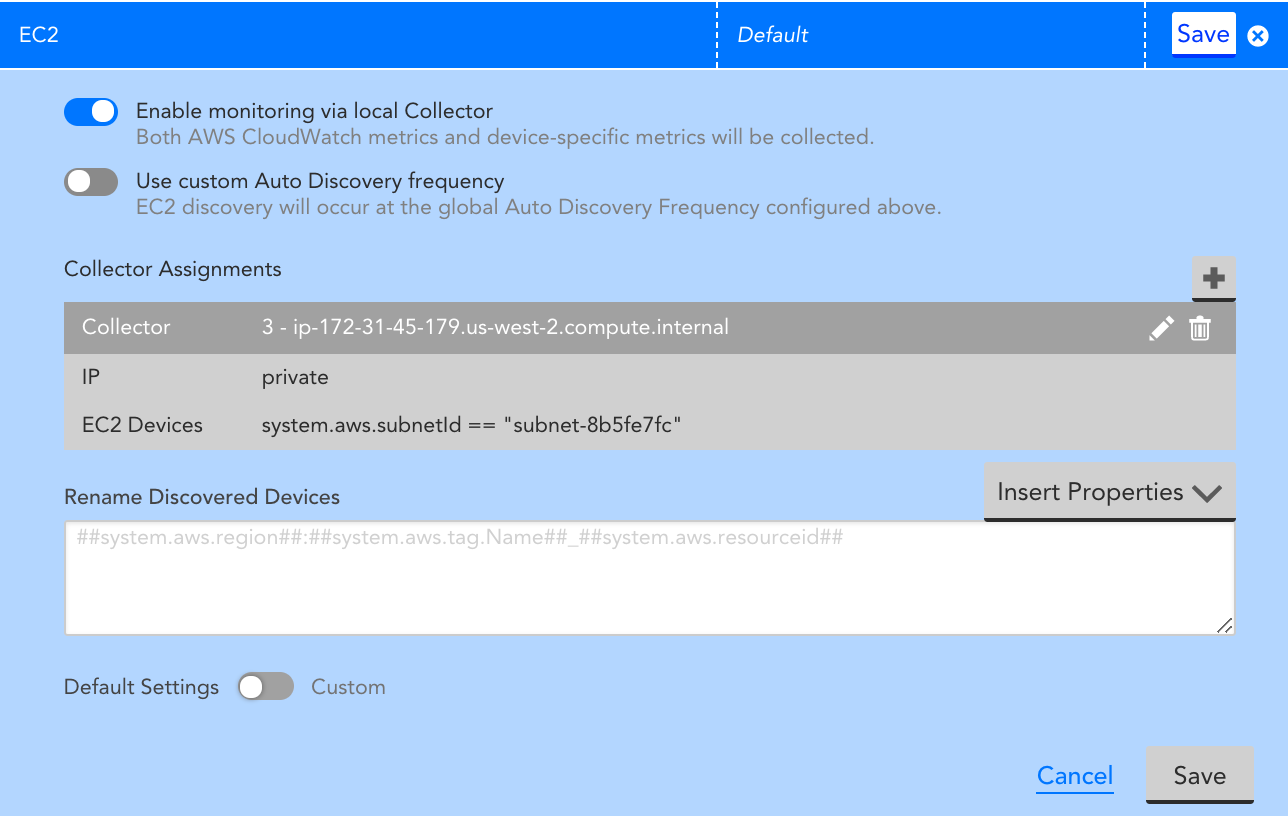
If left empty, EC2 instances and VMs will be named per the naming convention above (and as spelled out in grey placeholder text). Else, EC2 instances and VMs will be named per the tokens entered in the Rename Discovered Devices field. Currently, the following tokens can be used for renaming EC2 instances and VMs (any other tokens will not work):
AWS EC2 Instances:
· Name: system.aws.tag.Name property in LogicMonitor
· Region: system.aws.region property in LogicMonitor
· Instance ID: system.aws.resourceId property in LogicMonitor
· Custom Tag: system.aws.tag.KEY property in LogicMonitor, where KEY should be replaced with the tag key
Azure VMs:
· Name: system.azure.resourceName property in LogicMonitor
· Region: system.azure.region property in LogicMonitor
· VM ID: system.azure.vmId property in LogicMonitor
· Subscription ID: system.azure.subscriptionId property in LogicMonitor
Note: The Rename Discovered Devices field only applies to the naming of resources that have not yet been discovered, and will not change the naming of existing resources in monitoring.
You can customize the CloudWatch DataSources if you cannot find the desired metrics via LogicMonitor’s CloudWatch coverage and LogicMonitor’s Collector. Some of the ways you can customize CloudWatch DataSources include:
- Adding or modifying dimensions for the metrics collected: You can easily add the dimensions to the metric paths for existing DataSource definitions. In some cases, where dimension values are dynamic and not static, an Active Discovery method is the most efficient way to “discover” the dimension values as instances and monitor the associated metrics. For more information, see What is Active Discovery?
- Adding new metrics to be collected: If you publish your custom metrics to AWS CloudWatch, you can quickly modify existing LogicMonitor AWS DataSources or create new AWS DataSources to collect these metrics.
Prerequisites
- An AWS account that is integrated with LogicMonitor. For more information, see AWS environment to LogicMonitor.
Customizing AWS CloudWatch DataSources
To add dimensions to a new or an existing DataSource, complete the following steps:
1. Navigate to Settings > LogicModules > DataSources and search for AWS Datasources.
Note: Most of LogicMonitor’s AWS Datasources are already configured to query the CloudWatch API. If the Collector field has a value of AWS CLOUDWATCH, then you can easily modify or clone it to collect your custom metrics.
2. Select the datapoint for which you want to collect the custom data.
Note: You must select Normal datapoints to add dimensions.
3. Click the Settings icon, next to the selected datapoint.
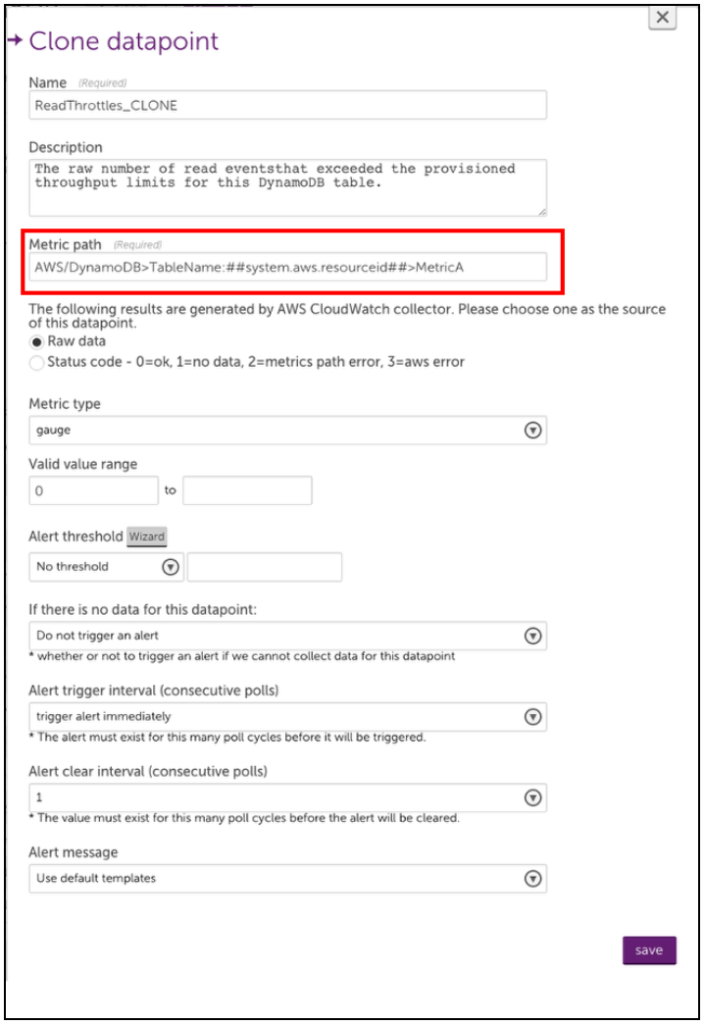
4. On the Edit Normal Datapoint dialog box, click Clone.
5. Rename the cloned datapoint and edit the metric path.
The syntax for the Metric path is:
Namespace>Dimensions>Metric>AggregationMethod
Where Dimensions should be one or more key-value pairs in this format:
DimensionName1:DimensionValue1>DimensionName2:DimensionValue2
Note: Because spaces are allowed in CloudWatch metric names, white spaces in the metric path will be interpreted by LogicMonitor as a space in the specified name. Avoid using spaces where they aren’t included in your CloudWatch metrics. Also, some metrics may not have an aggregation method or may only expose certain aggregation methods. The easiest way to ensure that you construct the metric path correctly is to use an AWS tool such as the AWS CLI to list metrics. After doing so, you can edit the Metric Path for a cloned or new datapoint.
Note: You can use an equal sign “=” to delimit the key-value pairs when the metric path in AWS CloudWatch contains a colon “:”.
For example, you can define the metric path for an AWS SES datasource with:
AWS/SES>ses:configuration-set=##system.aws.resourceid##>Send>Average
6. Save your new datapoint and then save the DataSource. LogicMonitor will automatically begin collecting this data for any AWS device that the edited DataSource is applied to.
Note: You can define custom AWS Cloudwatch metrics that include “greater than” and “less than” characters in the metric path. But because the “>” character is interpreted as a dimension separator, you need to substitute the “” characters with “[[” and “]]” respectively. For example, the metric path cloudwatch>path should be entered as cloudwatch]]path within LogicMonitor.
Example 1
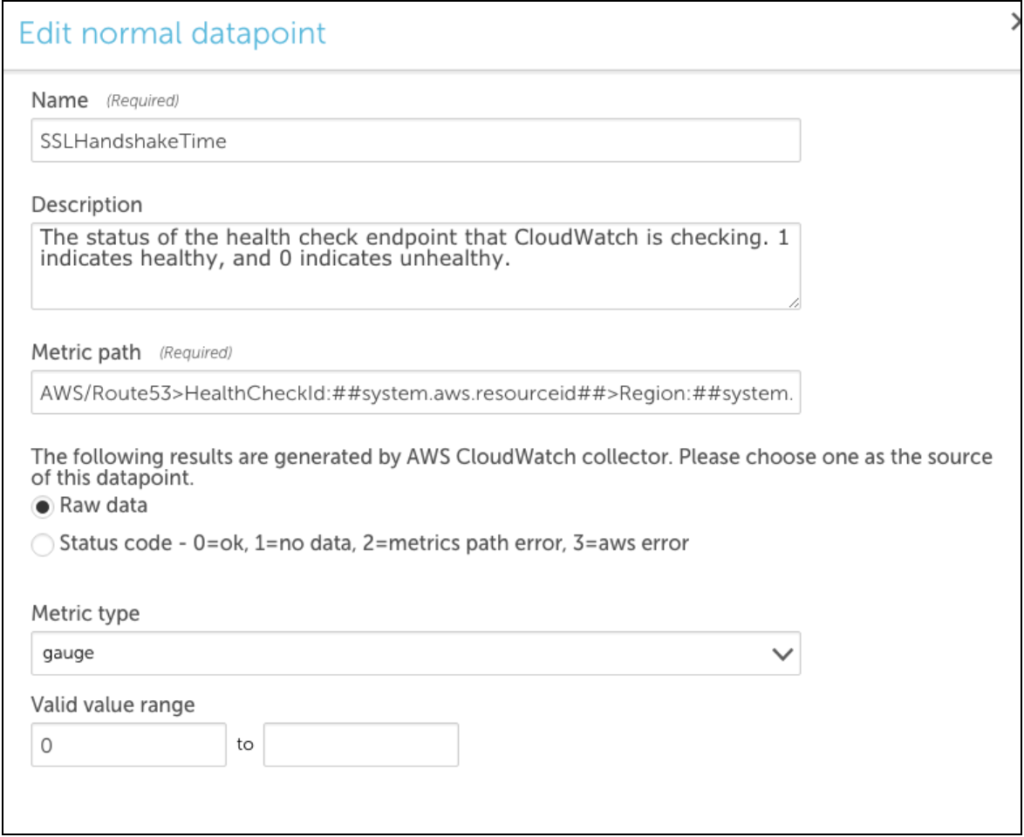
The following example illustrates adding a datapoint to the AWS_Route53 DataSource to monitor SSLHandshake Time. This is not a custom CloudWatch metric, this was recently introduced by AWS and will be added automatically to the AWS_Route53 DataSource. However, the process for editing or adding the datapoints to AWS DataSources is illustrated.
A list-metrics with the AWS CLI displays the following:
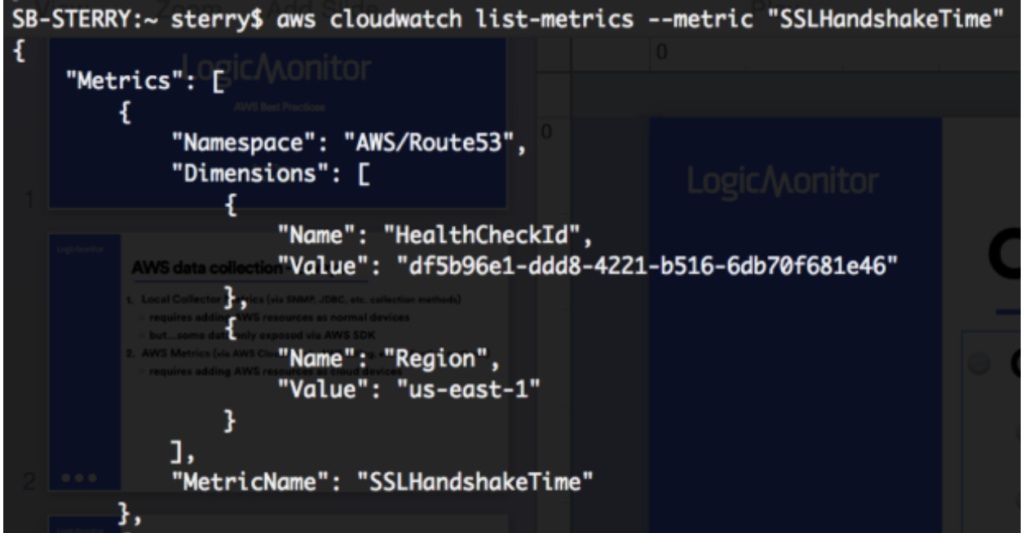
You can clone an existing datapoint for the AWS_Route53 DataSource and change the metric path to the following:
AWS/Route53>HealthCheckId:##system.aws.resourceId##>Region:##system.aws.region##>SSLHandshakeTime>Average
Example 2
The following example illustrates how to create a multi-dimensional DataSource using the Active Discovery method. Two dimensions are required, viz the device dimensions and the instance dimensions.
The device dimension specifies under which device the instances are displayed in LogicMonitor.
For example: If you are creating a multi-dimensional S3 bucket DataSource. You must enter BucketName and ##system.aws.resourceid## for Device Dimension Name and Device Dimension Value fields respectively.
The instance dimension discovers instances and will always contain ##wildvalue## value in the metric path. So, for S3 bucket DataSource example, you will enter StorageType in the Instance Dimension Value field.
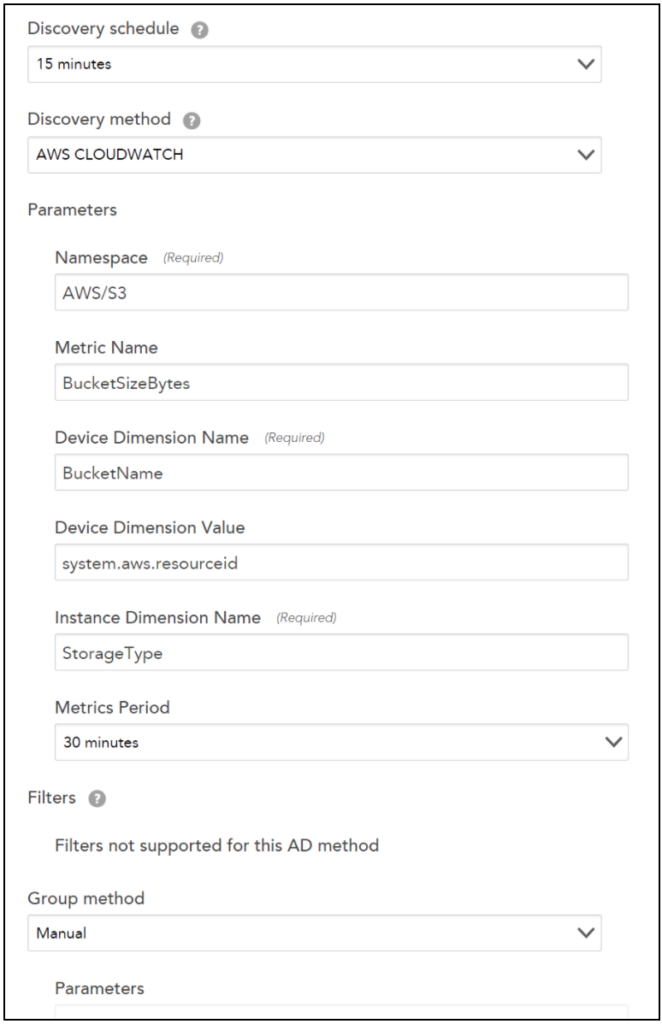
Note: For editing the metric paths for datapoints that are using the Active Discovery method, a standard metric path is followed for Cloudwatch in LogicMonitor:
Namespace>Dimensions>Metric>AggregationMethod
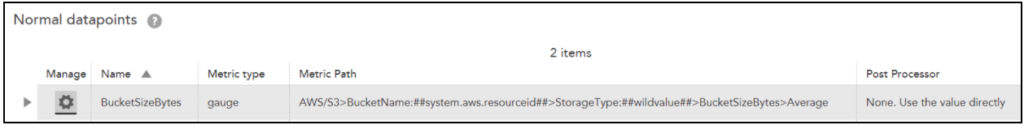
Let’s continue with the S3 bucket DataSource example. Following will be the metric path:
AWS/S3>BucketName:##system.aws.resourceid##>StorageType:##wildvalue##>BucketSizeBytes>Average
Troubleshooting
Typically, issues arise because of the following:
1. Incorrect Metric Path Syntax. Consider using a tool like the AWS CLI to confirm the syntax is correct.
Note: You can use the AWS CLI to verify the names of the metrics, dimensions, and aggregation types. For more information, see AWS services that publish CloudWatch metrics.
2. Incorrect Aggregation Method. Is the aggregation method you are trying to use valid for the desired Metric?
3. Insufficient Permissions. Sometimes, custom CloudWatch metrics can require permissions beyond what you may have provisioned to your LogicMonitor user.
You can identify which specific issue is occurring with the Poll Now functionality for your DataSource – you can find the Poll Now option on the Raw Data tab. On the Raw Data tab, the request that LogicMonitor makes to AWS for your DataSource, as well as any errors AWS returns is displayed.
LogicMonitor’s AWS DataSources leverage the CloudWatch API to collect data for your AWS resources. Depending on which AWS services and how many resources you monitor, you may see CloudWatch costs associated with LogicMonitor’s AWS Cloud Monitoring. LogicMonitor makes one API call per DataSource per Resource. Since the AWS charge is based on the number of datapoints the data is requested for, the CloudWatch costs are dependent on the number of datapoints, polling interval, and how many resources the DataSource applies to. For more information, see the Amazon CloudWatch Pricing information from AWS.
The CloudWatch DataSources poll every one to five minutes (60 min/hour, 24 hours/day, 30 days/month), depending on how often CloudWatch metrics are published for the particular service. You can estimate the costs that LogicMonitor contributes to your CloudWatch Costs (after you surpass the free tier). The following table displays example cost estimates for an AWS service contributed by LogicMonitor for a month:
| AWS Service | Number of Datapoints | Polling Interval (min) | Total Number of Metrics Request per Month (60 min/hour, 24 hours/day, 30 days/month) | CloudWatch Charge Rate | Estimated Additional Cost per Resource per Month |
| API Gateway | 7 | 3 | 100,800 | $0.01 per 1,000 metrics requested | $1.01 |
| CloudFront | 7 | 2 | 151,200 | $1.50 | |
| DynamoDB | 10 | 5 | 86,400 | $0.86 | |
| EBS | 8 | 5 | 69,120 | $0.69 | |
| EC2 | 11 | 5 | 95,404 | $0.95 | |
| EFS | 24 | 3 | 345,600 | $3.46 | |
| S3 | 3 | 1440 | 90 | $0.0009 |
Recommendations to Optimize CloudWatch Costs
The following table lists the recommendations to help manage the contributing costs from LogicMonitor for your CloudWatch costs:
| Recommendation | Description |
| (Applies to monitoring EC2 instances) Use Collector DataSources where possible | Install a Collector in your AWS environment and rely on Collector DataSources instead of the AWS_EC2 CloudWatch DataSource. Disabling monitoring for the AWS_EC2 DataSource reduces costs per instance per month in CloudWatch costs. Note: Any cloud resource monitored with a Collector counts towards a normal device license and not a cloud license. For more information, see Enabling Monitoring via Local Collector. |
| Increase polling intervals | You can increase CloudWatch DataSources polling intervals to poll less frequently, which reduces the number of CloudWatch API calls. Increasing the polling interval impacts alert evaluation. For example, if you change all polling intervals to every ten minutes, you may not know about a possible alert condition for longer. Polling intervals can be changed in the DataSource definition. For more information, see Creating a DataSource. |
| Determine which datapoints are meaningful to you | AWS DataSources can have over 20 datapoints (for example, EFS). If some of those datapoints are not meaningful, you can remove them from the DataSource definition, resulting in fewer CloudWatch API calls. You can clone the existing DataSource, set the appliesTo function to “false()” to prevent duplicated CloudWatch calls, and then remove the unwanted datapoints from the clone. This prevents your changes from being overridden when updating DataSource definitions. |
| Deselect AWS regions to monitor | Deselect the regions that you do not want to monitor. Note: Deselecting the AWS regions deletes the monitoring data. |
| Use tag filter | You can set up tag filtering to allow LogicMonitor to only discover AWS resources with a particular tag applied to them. |
If you use CloudFormation to create and manage entire ‘stacks’ of AWS resources, you should group the resources within each stack together in LogicMonitor. Grouping stack resources will make it easier to create properties, thresholds, SDTs, OpsNotes and more for all resources in the stack. In addition, consider creating a LogicMonitor dashboard for each of your CloudFormation stacks. A dashboard that displays the status and values of the resources within your stack will provide a general overview of the performance of your stack and will help you troubleshoot issues more quickly.
Create a dynamic group based on AWS tags
One way to achieve this grouping is to tag your resources in AWS and create a LogicMonitor dynamic group based on those tags. You can use AWS tags to create dynamic groups in LogicMonitor such that all AWS resources with a specific tag are placed in one group. To do this:
- Ensure that the resources in your CloudFormation stack are tagged
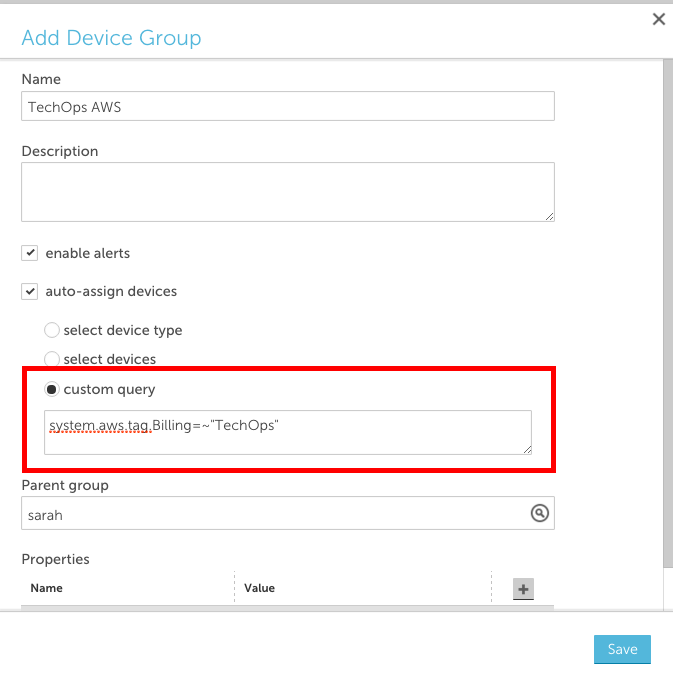
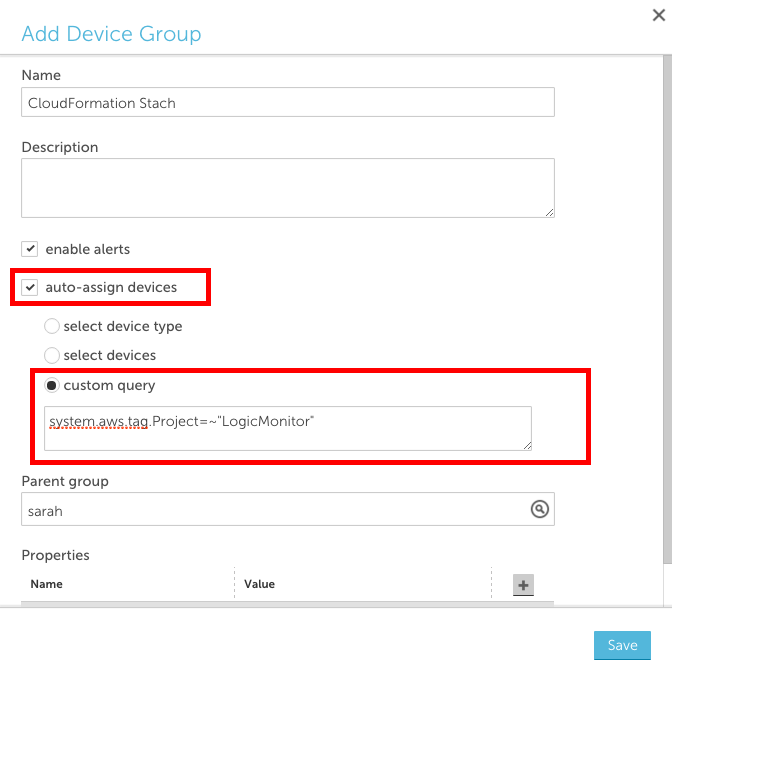
- Add a new device group and select the ‘auto-assign devices’ checkbox
- Enter a custom query to match your AWS tag in the following format: system.aws.tag.NAME=~ “VALUE”, where NAME and VALUE should correspond to the AWS tag name and value, respectively.
Create a dashboard for each stack
Consider creating a dashboard for each of your CloudFormation stacks with:
- one or more NOC widgets that display the status of each AWS resource within the stack
- an alert widget that only displays alerts that triggered for resources in the stack
- any relevant custom graph widgets or service status widgets for the AWS resources within the stack
When issues arise, a dashboard dedicated to your stack will allow you to see which components of the stack are performing as expected and which ones aren’t, enabling you to identify issues for the whole stack much more quickly.
Example
For example, consider the following CloudFormation stack:
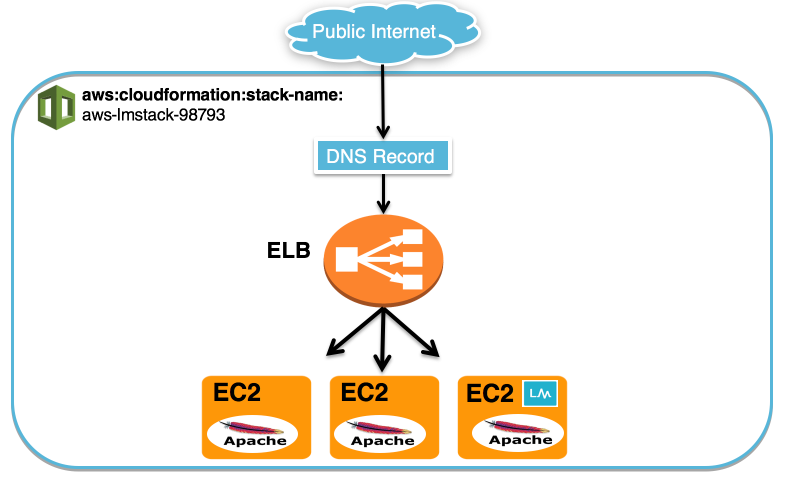
We used CloudFormation to create three EC2 servers, one ELB and a DNS record for our website. We installed Apache on the three EC2 servers and we also installed a collector on one of the EC2 servers so that we could monitor the instances using both LogicMonitor’s AWS monitoring functionality and a local collector.
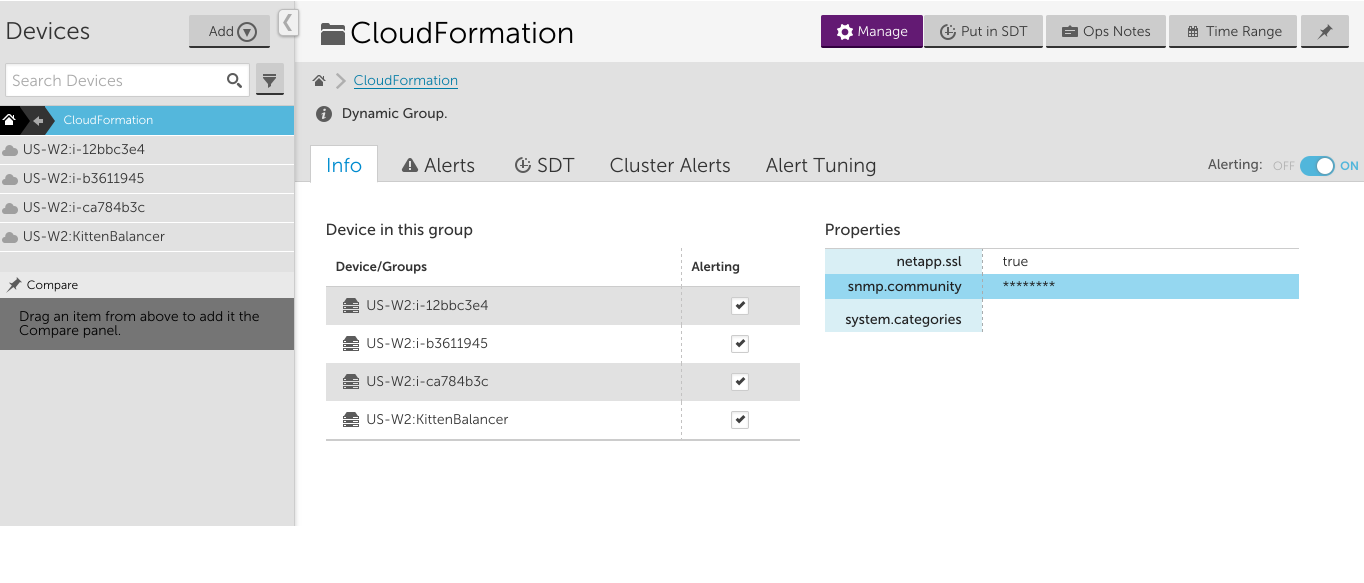
Each of the EC2 instances and the ELB have a tag added by CloudFormation with Name= aws:cloudformation:stack-name and Value=aws-lmstack-98793. Using LogicMonitor dynamic grouping functionality, we set up group that includes devices with that tag using the following custom query:
system.aws.tagaws:cloudformation:stack-name =~ "aws-lmstack-98793"By grouping the EC2 instances and ELB, we were able to set an snmp.community string property across all three EC2 instances. This would be tedious to do individually for each instance in a stack with a large number of resources. Additionally, grouping stack resources makes it easier to set alert thresholds or schedule an SDT during maintenance for the whole stack.
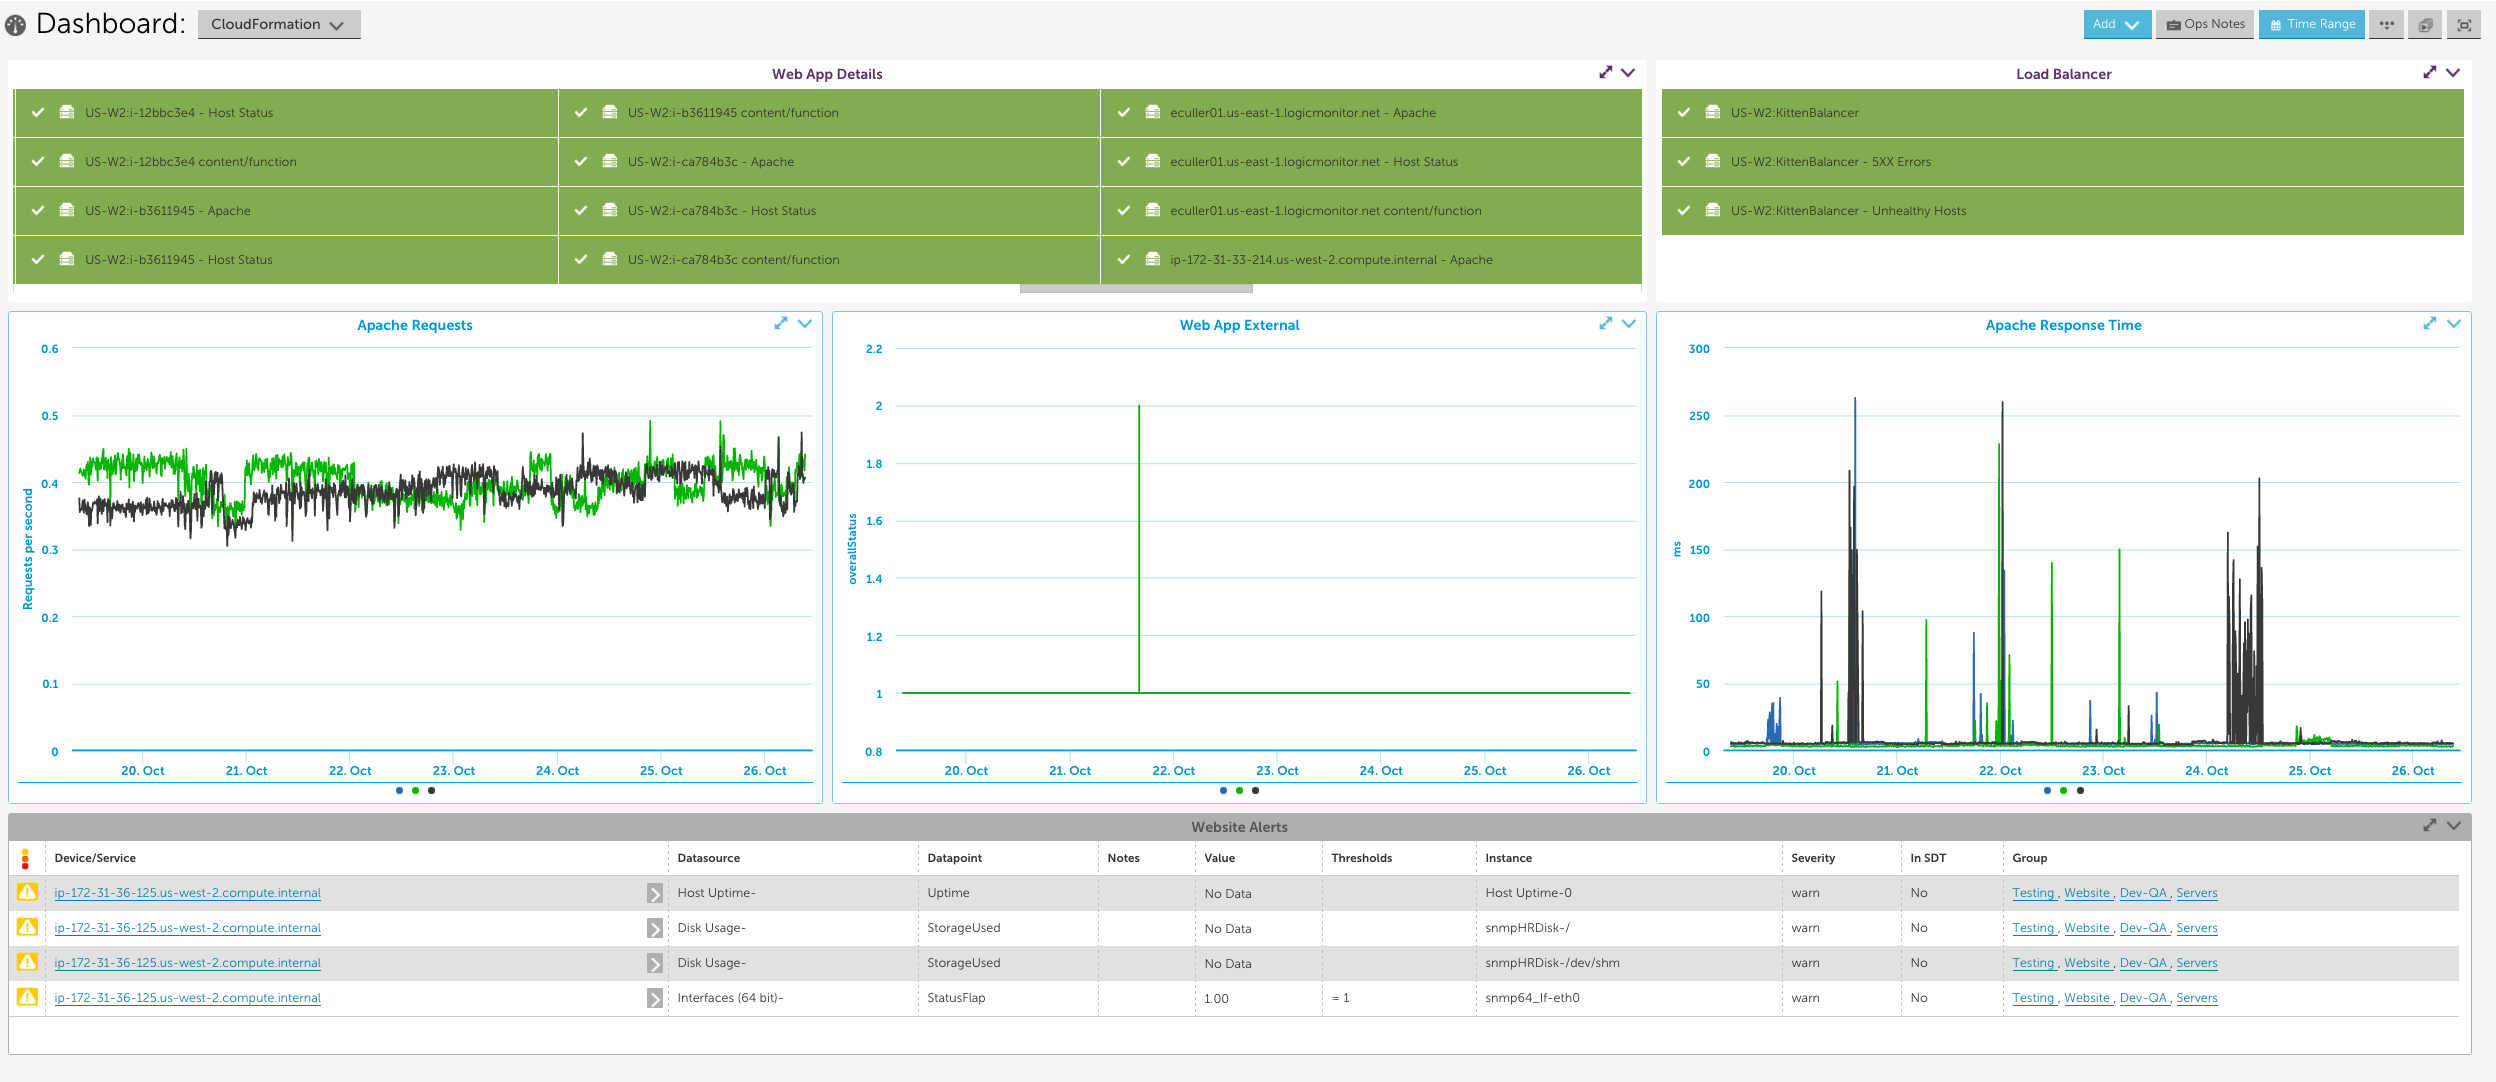
We set up the following dashboard to display the statuses of the EC2 instances, Load Balancer, and website service check, as well as the Apache metrics and any active alerts for our entire stack. Note that in order to monitor Apache using LogicMonitor’s Apache datasources you must install a collector in your local environment.
If your company uses AWS to host applications that support your day to day operations, you should ensure that you set up your monitoring in a way that helps you maximize the uptime of these applications. Specifically, consider the following recommendations:
1. Monitor the server side infrastructure components that your application is running on
Use LogicMonitor’s standard monitoring and AWS monitoring functionalities to comprehensively monitor the different behind the scenes cloud infrastructure components that your application relies on. This includes setting up monitoring for your EC2 instances, ELBs, S3 buckets and any other AWS backend resources your application uses. Comprehensively monitoring these components will enable you to quickly pinpoint the specific components that are causing problems when issues arise.
2. Monitor the middleware used to serve your application
This can usually be accomplished one of two ways:
- Using LogicMonitor’s AWS datasources to monitor the middleware for your cloud infrastructure. As an example of this, you could monitor your RDS MySQL databases utilizing LogicMonitor’s AWS RDS datasources.
- Installing a collector within your AWS environment and using LogicMonitor’s native datasources to monitor the middleware running on your cloud infrastructure. As an example of this, you could monitor your Apache web server by installing a collector on an EC2 instance in your AWS environment, adding your EC2 instances as devices to monitoring and applying LogicMonitor’s Apache datasources.
3. Monitor the application performance from the outside
Its a good idea to monitor what a customer would experience when interacting with your application. Typically, this includes using LogicMonitor’s services checks to monitor your application from outside of your AWS environment. As an example of this, you could perform custom checks on your website that look for the presence of specific text using LogicMonitor’s services. Monitoring your application from the outside ensures that you will be able to differentiate external factors that could potentially prevent outside users from being able to access your application from issues that are occurring within the infrastructure supporting your application.
4. Set up a dashboard that displays the status of each component of your application
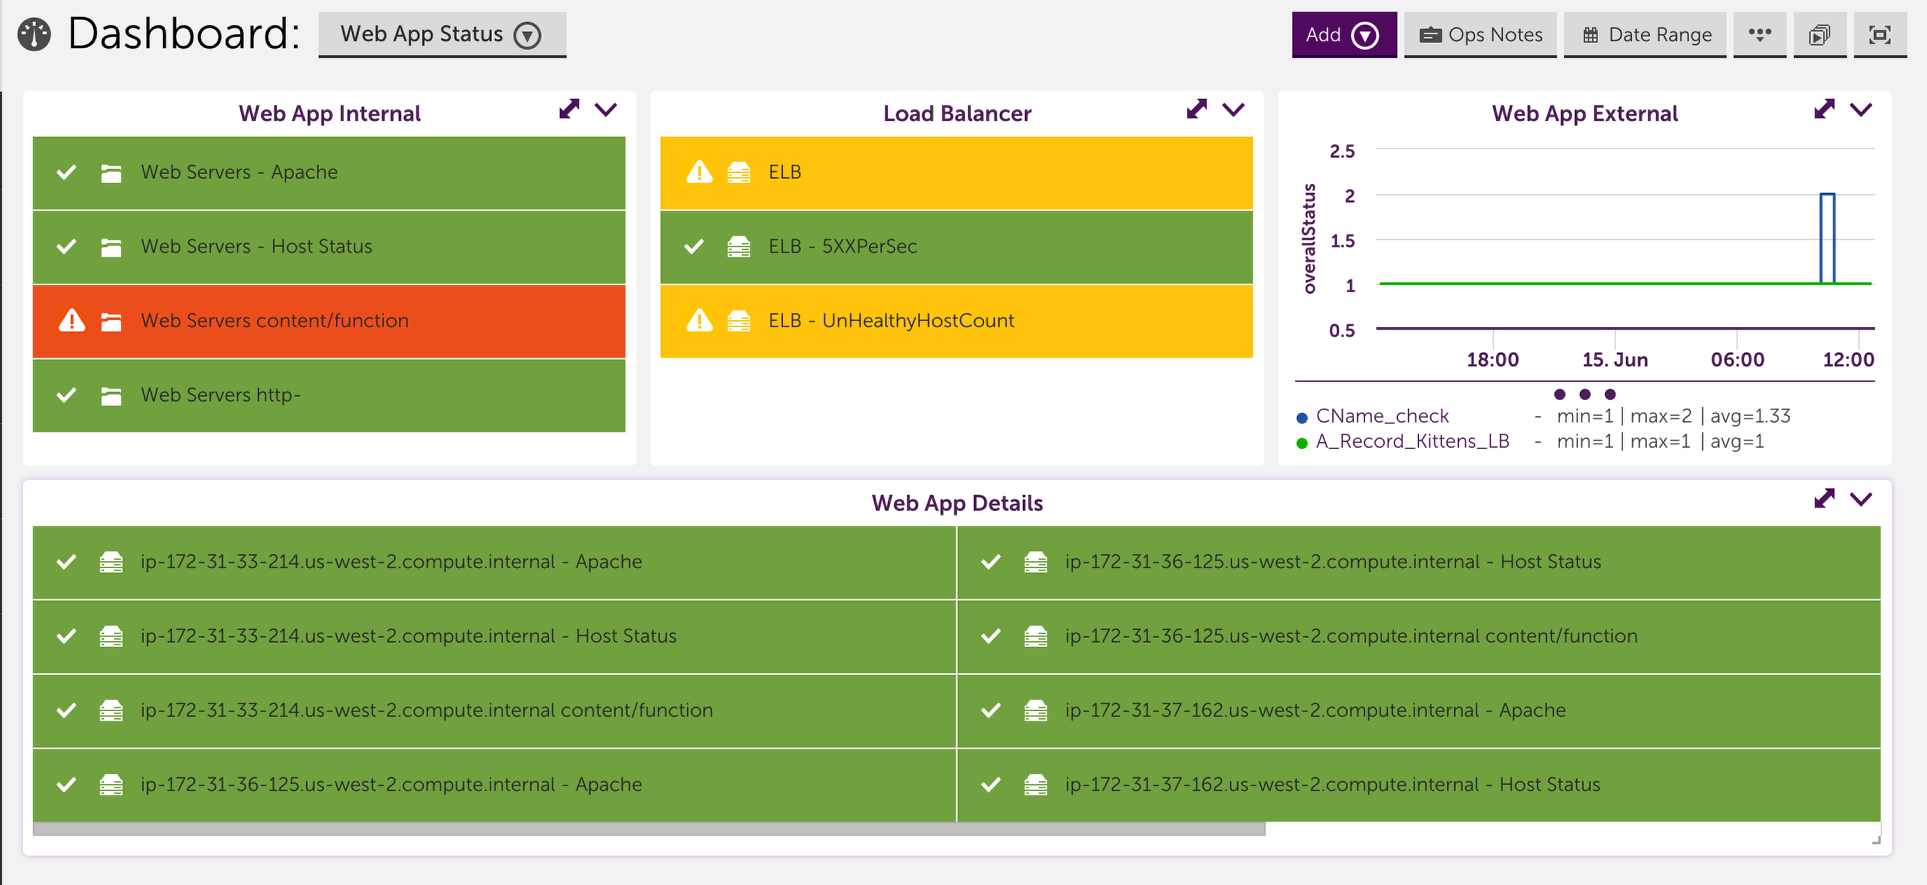
Consider setting up a dashboard that reflects your application. This includes setting up widgets to clearly show the status for each of the different monitored components of your application. A dashboard that is strategically set up to reflect your application enables you to look at alerts in the context of your application, allows you to compare which components are working and which aren’t and typically helps you quickly identify which component is causing the underlying issue. For example, the dashboard could include device NOC widgets that display the status of the backend infrastructure and middleware, and a service graph that displays front end performance checks:
Once you’ve added your AWS account to LogicMonitor, your AWS resources will be discovered and displayed in your LogicMonitor account. AWS resources will be displayed with a cloud icon in your device tree, and AWS groups will be displayed with the AWS cube icon. The total number of AWS resources in your account is displayed at the top of the device tree (this count does not include AWS resources added as regular LogicMonitor devices).

How does LogicMonitor discover the resources in my AWS account?
A LogicMonitor hosted collector will search for and discover AWS resources once every hour using our NetScan functionality. NetScan runs Resources will be discovered for each of the AWS Services you selected. After your AWS resources are selected, a NetScan will run according the the schedule specified in the ‘Auto-Discovery Frequency’ field in your AWS account configuration. You can force a NetScan to run and detect any new AWS resources in your account by selecting Run Active Discovery for your AWS Account group or any selected service in LogicMonitor and then selecting ‘save’.

Deleting AWS devices
Resources will only be discovered based on your selected service types, selected regions and any tag filters you have specified. There are a couple of ways to delete AWS devices:
- If you’d like to remove dead instances, make sure to select ‘Automatically delete terminated AWS resources’ for the desired AWS service and choose how quickly you’d like those instances to be deleted (immediately, 7 days, 14 days or 30 days). Note that currently the automatically remove dead instances functionality only applies to terminated instances (i.e. stopped instances will not be auto-deleted).
- If you’d like to remove non-dead instances you should manually delete the device and either uncheck that AWS service entirely, uncheck that AWS region entirely or add tag filters in LogicMonitor to ensure that instance is not re-discovered.
Notes:
- If you manually delete an AWS ‘device’ in LogicMonitor and don’t change the configuration for discovering instances in your AWS account, that instance will be re-discovered as a device.
- If you disable monitoring for a region or service in LogicMonitor, any existing AWS devices from that region or service will remain but won’t be monitored. You can remove them manually after de-selecting the region.
- If you choose to have a device removed from monitoring immediately, there may be up to a 10 minute delay for the deletion to take effect.
- Your devices can be deleted in increments of up to 100 devices at a time, with up to a 10 minute delay per increment.

Can I change the name for my AWS groups and devices in LogicMonitor?
It’s possible to rename AWS EC2 resources. See Renaming discovered EC2 instances.
For other AWS groups and devices, you cannot change their names in LogicMonitor. AWS devices and groups are named in the following format:
- Device groups: AWS Service name (e.g. EC2, S3, SQS, DynamoDB)
- Devices: region : instance name or id (e.g. US-W2:i-ca7777)
The way that LogicMonitor queries your AWS account for data relies on these naming conventions.
Managing alerts
LogicMonitor’s datasource developers set some default thresholds in the AWS datasource definitions. However, since thresholds set in a datasource definition apply globally to all customers, we can’t always set default thresholds that will work for everyone. We recommend that you set thresholds specific to your environment to ensure that your alerting implementation is sufficient and noise-free.
AWS Throttling
AWS has a maximum of 500 requests per second. If you customize an AWS datasource to have a smaller polling interval OR you have a large number of AWS devices we are collecting data for, this limit could be reached. If LogicMonitor receives a throttling message from AWS for your account, we will automatically begin making data requests less frequently but for more data (so you keep the data granularity).
You can filter which AWS resources are auto-discovered by LogicMonitor using tag filters. Once these AWS resources are discovered by LogicMonitor and added as cloud devices, any tags associated with those resources will be added as device properties.
Tags will be added and displayed as device properties in the following format:
system.aws.tag.NAME=VALUE
NAME and VALUE refer to the name and value of the tag, respectively.
Note: AWS tag filters are case sensitive.
For example, the following table displays how LogicMonitor property names correspond to an AWS tag name:
| LogicMonitor Property Name | AWS Tag Name |
| system.aws.tag.team | team |
| system.aws.tag.aws:cloudformation:stack-name | aws:cloudformation:stack-name |
Referencing Tags
You can reference these tags throughout your account (e.g. to create a dynamic group). For example, to create a dynamic group of AWS resources that have a specific AWS tag, use the following Applies To (custom query):
system.aws.tag.NAME=~“VALUE”