LogicMonitor DataSources that use the ‘Azure Monitor’ collection method can be customized to collect additional metrics, different aggregation methods, or metrics with specific dimensions. The JSON path field in each datapoint controls which parameters get passed by LogicMonitor’s Cloud Collector into the Azure Monitor API request.
For more information about Azure Monitor, see Azure Monitor documentation from Microsoft.
Requirements
- Add your Microsoft Azure environment to LogicMonitor. For more information, see Adding your Azure Environment to LogicMonitor.
- Install the Azure CLI. For more information, see How to install the Azure CLI from Microsoft.
Customizing the LogicMonitor Datapoint Definition
- Navigate to Modules > My Module Toolbox.
- Search for and view Azure DataSources.
- Locate and select the Azure API Management DataSource.
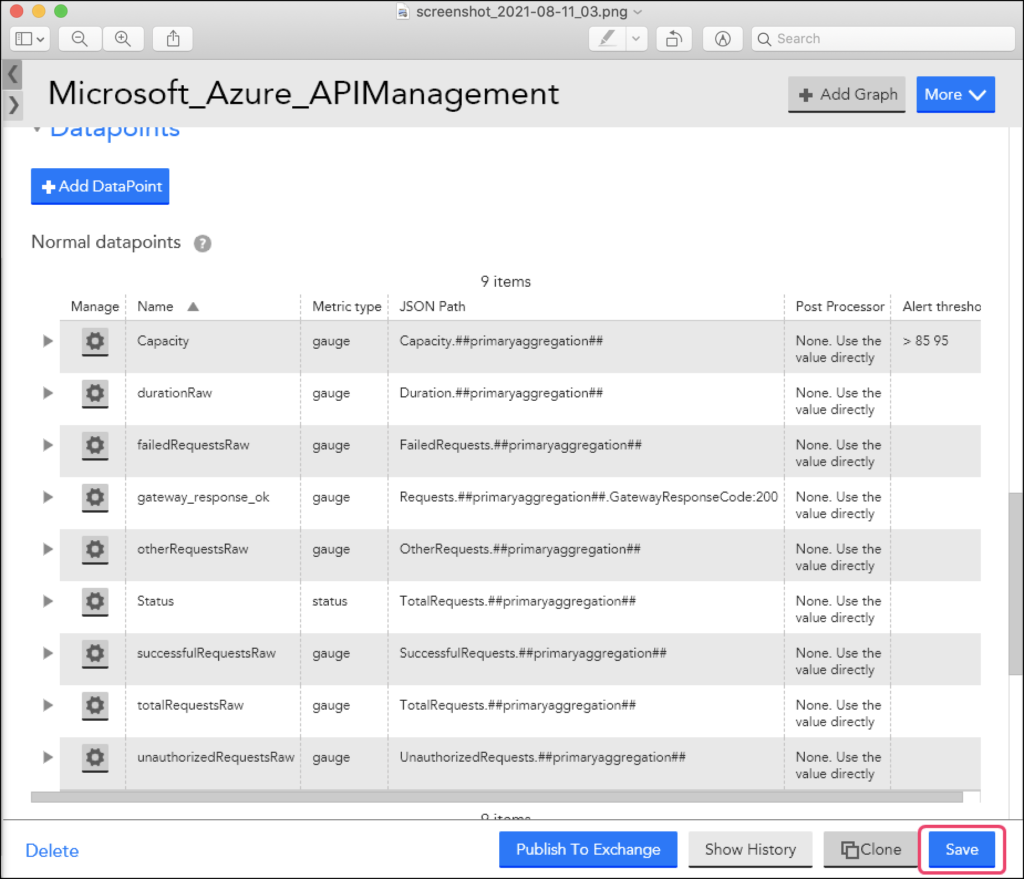
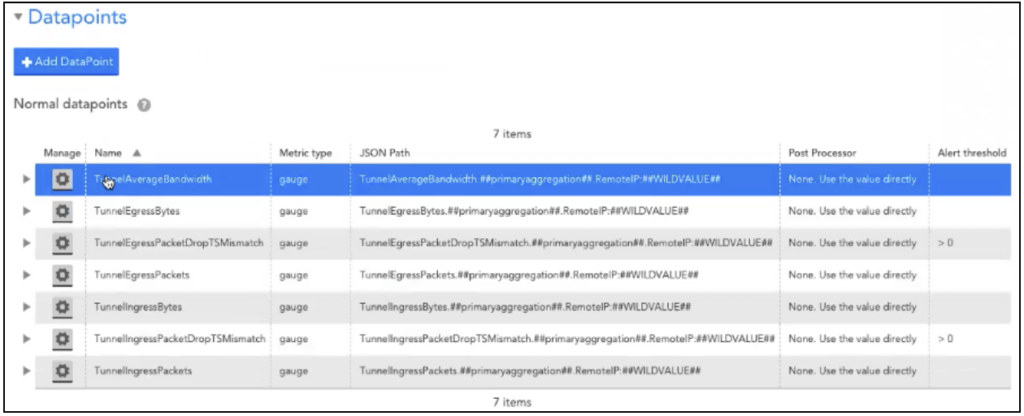
- Select the Datapoints tab.
- Select the Clone icon of an existing Normal Datapoint to create a new datapoint that you can edit and customize.
- On the Clone a Normal Datapoint pane, you can edit the Name, Description, and JSON Path.
Note: The JSON Path controls which parameters are passed by LogicMonitor’s Cloud Collector into the Azure Monitor API request. It uses the following format:metricName.aggregation.dimension - Select a Metric Type. The options are Gauge, Counter, or Derive. For more information, see Normal Datapoints. For a list of metrics that Azure Monitor supports, see for Supported metrics with Azure Monitor from Microsoft.
- (Optional) Add or edit static thresholds or dynamic thresholds.
- Save to save the new datapoint.
- To complete the update, save the LogicModule and provide an Update Reason.
JSON Path Values
The values in the JSON Path are as follows:
| Value | Required | Description | Example |
|---|---|---|---|
| metricName | Yes | Name of the Azure Monitor metric. For more information, see Supported metrics with Azure Monitor. | BytesReceived |
| aggregation | No | Aggregation method. | ##primaryAggregation##Note: ##primaryAggregation## can be used to dynamically pass in the Azure supported aggregation, as not all aggregations are supported for all metrics at all times. For a complete list of supported tokens, see Tokens Available for Data Collection. |
| dimension | No | Dimensions are name-value pairs that carry supplementary data, and may be configured when simple metric data is not sufficient. For more information, see Multi-dimensional metrics.Use the format: dimensionName:dimensionValue | GatewayResponseCode:200 |
Example
In the following example, the aggregation type available for the Requests metric is Total. So, the aggregation type Total will replace the token ##primaryaggregation## in the expression and give you the count of successful responses from the gateway.
Requests.##primaryaggregation##.GatewayResponseCode:200Dimensions in Metrics
Simple metric data such as request count does not provide sufficient context for the collected values. Dimensions are name-value pairs that carry supplementary data to describe the metric value.
For example, an Azure API Management service metric – FailedRequests supports the dimension Location. So with the Location dimension, you can view the failed requests across all the locations or for an individual location.
The Azure API Management (APIM) service is a hybrid,multi-cloud management platform for APIs across all environments. Azure Monitor provides several useful multi-dimensional metrics for the Azure API Management service.
Azure Multi-Dimensional DataSources
You can customize the Azure DataSources if you cannot find the desired metrics via LogicMonitor’s Azure Monitor coverage and LogicMonitor’s Collector. Some of the ways you can customize Azure Monitor DataSources include:
- Adding or modifying dimensions for the metrics collected: You can easily add the dimensions to the metric paths for existing DataSource definitions. In some cases, where dimension values are dynamic and not static, an Active Discovery method is the most efficient way to “discover” the dimension values as instances and monitor the associated metrics. For more information, see What is Active Discovery?
Adding Azure Multi-Dimensional Datasources
To add dimensions to the Azure DataSources, complete the following:
1. Navigate to Settings > DataSources > Add > DataSource. For more information, see Creating a DataSource.
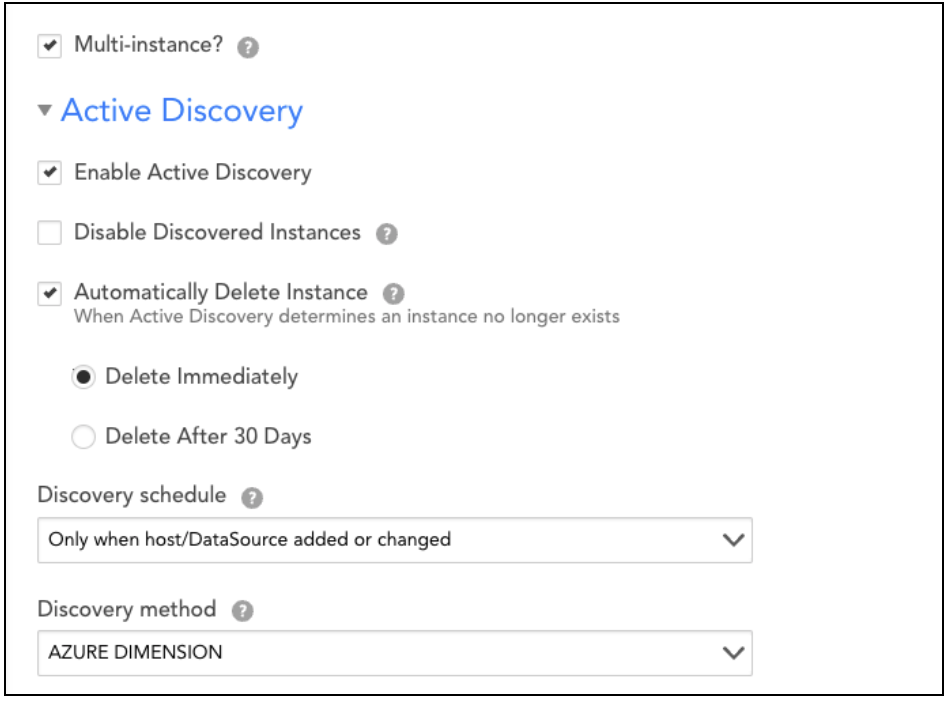
2. Enable the Multi-instance checkbox.
3. Enable the Active Discovery checkbox.
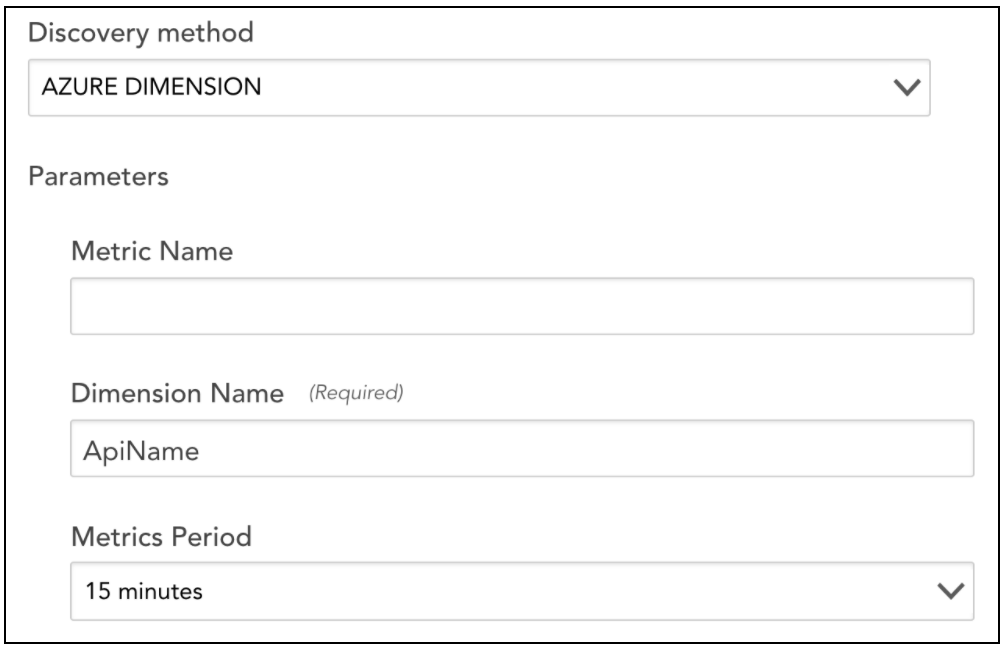
4. In the Discovery method field, select AZURE DIMENSIONS from the drop-down list.
5. Enter the required Dimension Name.
6. Select Add DataPoint.
7. On the Add Datapoint page, select Normal Datapoint.
8. Enter the details in the Name and JSON path fields.
The syntax for the JSON path is:
metricName.aggregation.dimensionName:##WILDVALUE##
Where
metricNameis the name of the Azure Monitor metricaggregationis the (optional) desired aggregation
Example
The following example illustrates how to create a multi-dimensional DataSource using the Active Discovery method.
For example: If you are creating a multi-dimensional Microsoft_Azure_VirtualNetwork DataSource, you must select Azure Dimensions in the Discovery Method field and add the required dimension name in the Dimension Name field.
So, for the Microsoft_Azure_VirtualNetwork DataSource example, you will enter RemoteIP in the Dimension Name field.
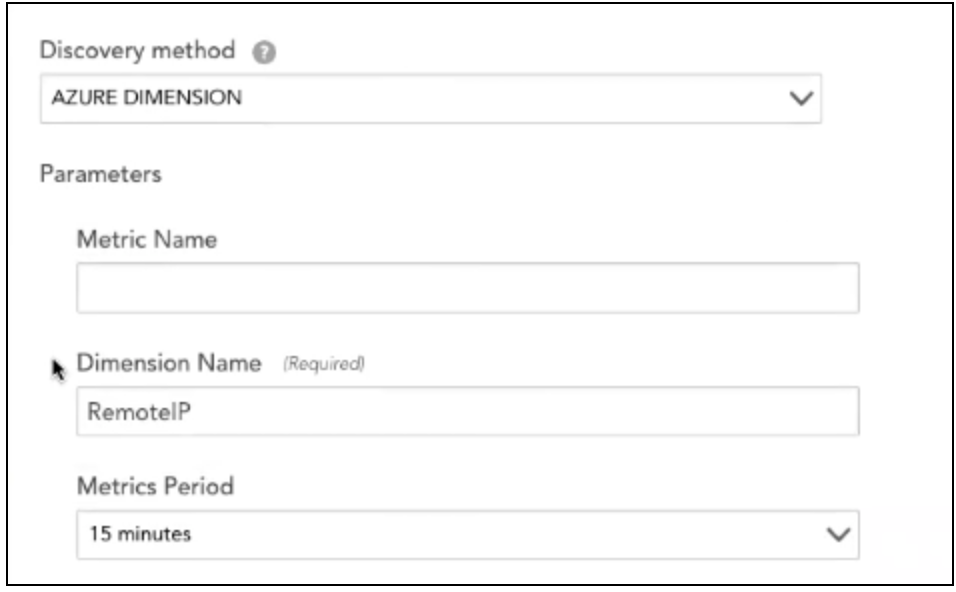
You can add all the required Datapoints related to the RemoteIP dimension. So with Azure Dimension, you can collect information for all the metrics grouped under a single dimension.
Note: For editing the JSON paths for datapoints that are using the Active Discovery method, a standard JSON path is followed for Azure Dimensions in LogicMonitor:
BgpPeerStatus.##primaryaggregation##.BgpPeerAddress:##WILDVALUE##
Note: You can also collect information for a single metric, add the <metric name> in the Metric Name field to collect information for the required metric.
Creating an Azure API Management Instance
To create an instance, complete the following steps:
- To create an Azure API Management instance, run the following Azure CLI commands:
  az group create --name apim-rg --location centralus

  az apim create --name lm-apim --resource-group apim-rg \
     --publisher-name LM --publisher-email [email protected] \
     --no-wait
Note: The Azure quickstart guide describes several other alternatives for creating an APIM instance such as the management portal, PowerShell, and ARM template.
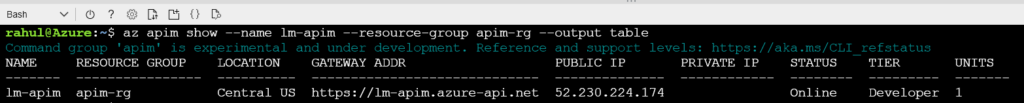
- Wait for 30 to 40 minutes to allow the Azure API Management service to be created and activated. Use the following command to record the current status of the API:
az apim show --name lm-apim --resource-group apim-rg --output table
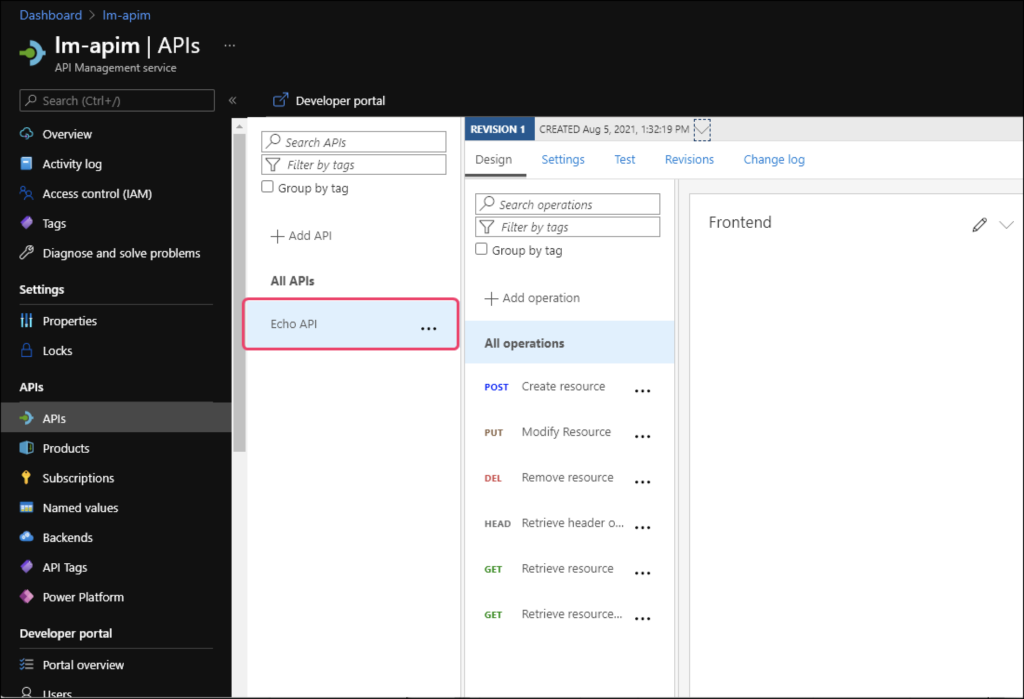
- On the Azure management portal, select the API Management service that you just created. You will find the Echo API, which is created by default when you create a new Azure API Management instance.
Note: You can use the Echo API to test the metrics.
Once you have created an instance, you can configure the APIM DataSource in LogicMonitor to ingest a multi-dimensional metric.
Inspecting the Metric
Now that you have an API Management instance and LogicMonitor recording the metrics, let’s generate some metrics from the API Management service.
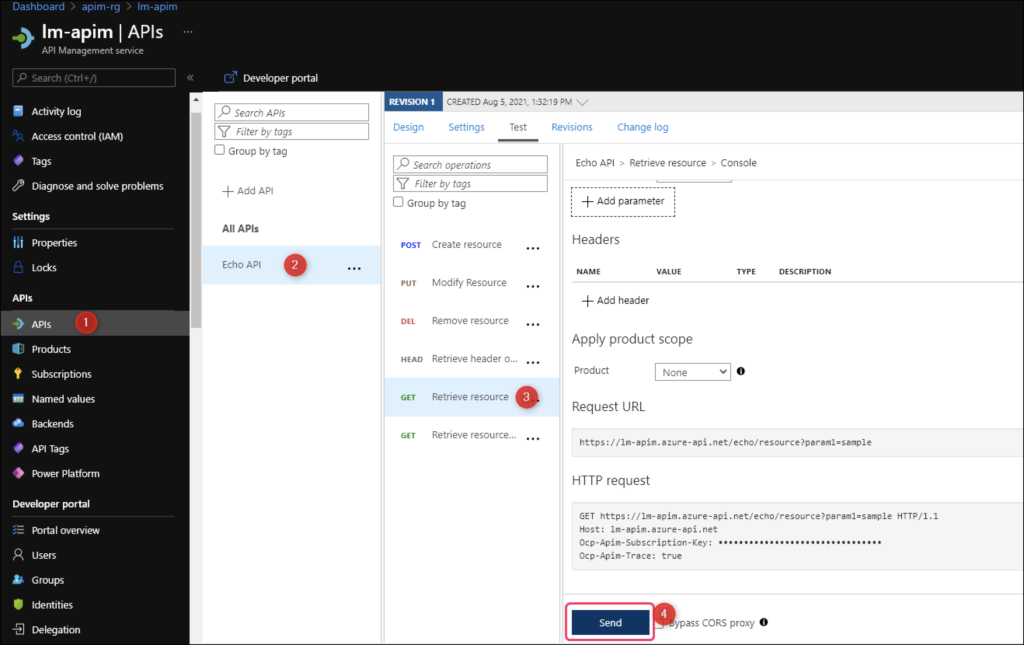
1. On the API Management service, navigate to APIs > Echo API. Select Retrieve resource GET endpoint and select on the Test tab.
2. Use the integrated test console to send a few HTTP requests to the service.
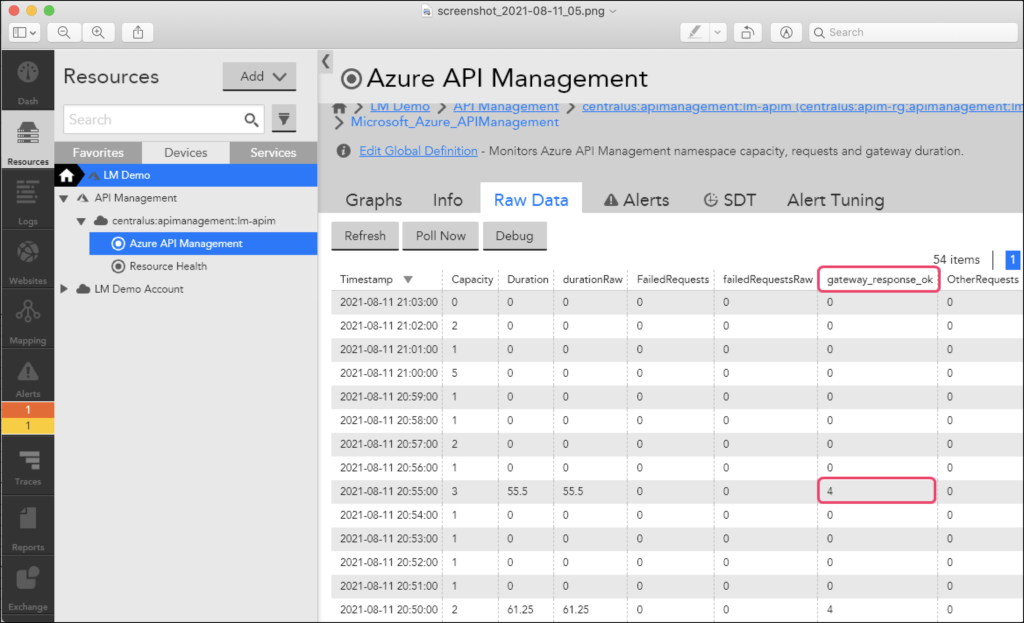
3. In LogicMonitor, navigate to the Resources page, and select your API Management resource.
4. Select the Raw Data tab to find the new metric and the aggregated values.
Note: It may take several minutes for data from Azure Insights to become available. Timestamps from Azure metrics reflect the time at which metrics were available, and not necessarily when they are queried by LogicMonitor.
5. To view the request that LogicMonitor made to fetch the value of the new metric, select Poll Now and scroll to the Raw Request/Response section.
You will find the API request from LogicMonitor and the response from Azure Monitor as displayed in the following image:
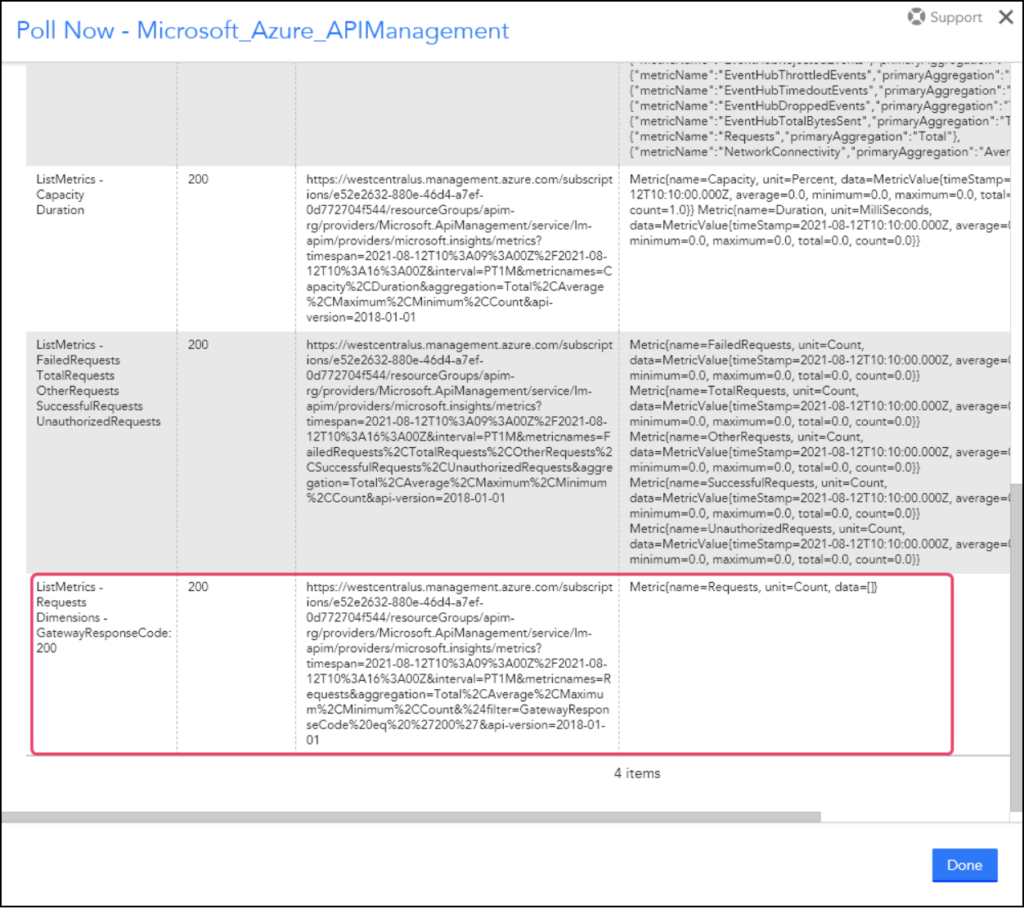
Monitoring your Microsoft Azure environment with LogicMonitor helps you to manage performance and identify potential faults. Add LogicMonitor to your Azure environment to monitor the state of your Azure deployment, underlying services, and license usage.
Requirements
You must register your LogicMonitor account as an app with Microsoft Azure Entra ID in your Azure console before adding Azure to LogicMonitor. For more information, see Register an application with the Microsoft identity platform from Microsoft Azure.
You need the following credentials from this process when finished:
- Azure Tenant ID–Directory (tenant) ID from Azure > App Registrations > Overview.
- Azure Client ID– Application (client) ID from Azure > App Registrations > Overview.
- Azure Secret Key–Value from Azure > App Registrations > Certificates & Secrets > Client Secrets.
Adding Your Azure Environment to LogicMonitor
After you register LogicMonitor in your Azure environment, you can add Azure to LogicMonitor for monitoring and logs. For more information, see Sending Azure Logs.
Use the following steps to add the required information about your Azure App Registration:
1. Navigate to Resources > Add > Cloud Account.
Note: If you’re using the New UI Preview toggle, go to Resources > Add [+] > Cloud and SaaS.
2. Select Azure > Add.
3. On the Name page, enter a Name and Description for your Azure account. These fields determine how your Azure resource is displayed throughout the LogicMonitor environment.
4. To place the new resource into an existing group, select the group from Parent Group field. You can type to search. The default value is root, or the first level of the Resources Tree.
5. (Optional) You can enter key-value pair properties by entering a Name and Value. Or, you can select from a list of existing properties. For more information, see Instance and Resource Properties.
6. Select Next: Permissions.
7. On the Permissions page, enter the Azure Tenant ID, Azure Client ID, and Azure Secret Key.
8. Select Get Subscriptions. All subscriptions available to LogicMonitor based on the permissions you’ve configured are listed. If you don’t see the subscriptions you expect, verify that the application you created in Azure has reader permissions for those subscriptions.
9. Select Next: Services.
10. On the Services page, enable or disable the Azure services listed to customize monitoring your environment.
Note: If you’re adding LogicMonitor services for Backup Protected Items or Recovery Protected Items, you need to make configuration changes to the Recovery Service Vault and Log Analytics Workspace in Microsoft Azure. For more information, see Forwarding Backup and Recovery Events.
11. Select Test Permissions to authenticate.
12. Select Next: Billing.
13. On the Billing page, enter the Subscriptions ID, Offer ID, and Monthly Billing Date. 
Note: You have the option to provide Billing details using Azure Rate Card or Azure Cost Management. LogicMonitor recommends using Azure Cost Management whenever possible. For Azure Cost Management, enter the Subscription ID from Azure > Subscriptions > Overview. For Rate Card, go to Azure > Subscriptions > Settings > Billing Properties > Microsoft Azure Plan to view your plan’s Subscription ID, Offer ID, and Monthly Billing Date. For more information, see Monitoring Azure Billing.
14. Select Add Billing and then select View Azure Resources to finish.
Configuring Azure Services in LogicMonitor
- Navigate to Resources and select the Azure resource that you added.
- Select Manage and then select the Services tab.
- Select Default Settings.
- On the Global Settings tab:
- NetScan Frequency: Select the preferred frequency for scheduling NetScans.
- Automatically delete terminated Azure resources if they are no longer available in the cloud portal: Enable to automatically remove “dead” instances. You can also select whether this happens immediately or after a specified period during, where no data is received for the instance. This does not remove resources terminated prior to adjusting this setting. These resources must be deleted manually.
- Automatically disable alerting for terminated Azure resources if they are no longer available in the cloud portal: Select this option to disable alerting for terminated instances. This ensures that you will not receive any alerts once instances are terminated if they are not scheduled to be automatically deleted.
Note: LogicMonitor intelligently and automatically stops Azure Monitor API data collection once instances are terminated. This option ensures that you do not receive alerts for traditional Collector DataSources like Ping.
- (Optional) If you are configuring monitoring preferences for the Virtual Machine service, enable Enhanced Detection on the Discovery Settings tab to improve detection. You do not need to set a custom NetScan frequency if you enable this option.
- In the Monitored Regions section, you can enable or disable the regions that you want to monitor.
- Select the Tags tab. To monitor Azure instances for a particular service, you can tag those instances from your Azure portal and then apply a tag filter in LogicMonitor. If you specify a tag filter, only Azure resources that meet the filter criteria will be added to your LogicMonitor account. The criteria is as follows:
- You can use glob expressions with the tag filter. For example:
tag value = prod* - Resources are discovered when they contain one or more tags specified with an include operation, and not with any of the exclude tags.
- The tag filter is case sensitive.
- You can use glob expressions with the tag filter. For example:
- Select Save.
For a list of Azure services monitored, see Cloud Services and Resource Units. Due to how Azure generates metric data, there may be a delay before logs and metrics appear in LogicMonitor. This delay time varies based on the type and size of the data gathered from Azure.