Overview
Traditionally, the assignment of devices to Collectors in LogicMonitor has always represented a unidirectional one-to-many relationship: a Collector could have multiple devices assigned to it, but devices could not be assigned to multiple Collectors. This presents some challenges not only in the assignment and management of devices among Collectors, but also in ensuring that Collector load is appropriately scaled and balanced.
While you can choose to maintain this one-to-many relationship if it’s well suited for your environment, LogicMonitor also offers the ability to create Auto-Balanced Collector Groups (ABCGs). By allowing devices to be assigned to more than one Collector, ABCGs address the aforementioned challenges by:
- Dynamically moving device(s) from one Collector to another within the ABCG in order to prevent any individual Collector from becoming over-subscribed.
- Improving scalability for device failover. When a Collector in an ABCG goes down, the devices that were being monitored by that Collector will be distributed among the other Collectors in the ABCG.
- Streamlining the creation process for devices and allowing for simplified capacity management within a group of Collectors.
How Do Auto-Balanced Collector Groups Work?
Monitoring thresholds for the Auto-Balanced Collector Group (ABCG) are based on raw instance counts and not on the current load or weighted instances. Every 30 minutes, LogicMonitor analyzes the total number of DataSource instances being monitored per Collector in an ABCG.
If a Collector’s monitoring threshold is exceeded:
- LogicMonitor will attempt to rebalance the load by moving the highest instance count devices off of that Collector to the Collector with the lowest load in the ABCG.
- If moving a device would result in the target Collector exceeding its threshold, the device is not moved and the next largest device on the Collector is attempted.
- This process repeats through all the devices monitored by that Collector until the instance count is below the threshold of the target Collector—or until all devices have been attempted.
It is possible that no moves will be made if rebalancing (moving devices from one Collector to another) would put other Collectors in the ABCG over their respective limits. Having too many instances on all your Collectors will prevent auto-balancing and lead to performance impacts, unless you adjust the Rebalancing Thresholds.
Note: If an ABCG is rebalanced, an entry is created in the audit logs under the user of “System:AutoBalancedCollectorGroupCheck”.
When a Collector in an ABCG fails, its devices are moved to the other active Collector(s) in the group. There is no one-to-one manual designation of a failover Collector; rather, a rebalance algorithm is triggered and devices are balanced across the remaining Collectors in the ABCG as efficiently as possible. When the failed Collector comes back online, the devices will remain on their new Collector(s), assuming they are not over their threshold limits.
After enabling auto-balancing for a Collector Group (detailed in the Configuring an Auto-Balanced Collector Group section of this support article), a Collector’s count of instances across all the devices it is currently monitoring is displayed in the Collector list. If necessary, instance count thresholds can be tuned, as discussed in the Rebalancing Thresholds section of this support article.
Note: Protocols that send data to Collectors (such as Syslog, SNMP traps, and NetFlow) are not part of auto-balancing. These types of solutions require configuration on the endpoint devices and would need a balancing solution at the transport layer rather than the application layer.
Collector Considerations for Inclusion in an Auto-Balanced Collector Group
Since devices will be dynamically moving among the Collectors in an Auto-Balanced Collector Group (ABCG), we recommend that the Collectors making up the group are as similar as possible. Collectors within an ABCG must specifically share the following characteristics:
- Network accessibility. Collectors must have the same network accessibility to all devices monitored by the ABCG.
- Operating system. Collectors must be on the same operating system. This is a hard requirement enforced by the LogicMonitor UI. Windows Collectors and Linux Collectors have different capabilities when it comes to monitoring devices. To ensure continuity of your metrics please ensure that Collectors in ABCGs are of the same OS.
- Collector version. Although it’s not required, we recommend that all Collectors in an ABCG are on the same version.
- Collector monitoring. Collectors that are part of an ABCG should maintain monitoring themselves. Avoid setting the ABCG as the preferred Collector. See Monitoring your Collectors.
Configuring an Auto-Balanced Collector Group
To configure an Auto-Balanced Collector Group (ABCG), perform the following steps:
- Navigate to Settings | Collectors and locate the Collector group for which you would like to enable auto balancing.
- If the Collector group doesn’t yet exist, click Add | Collector Group to begin the creation of a new group. For information on creating Collector groups and adding Collectors as group members, see Collector Groups.
- If the Collector group already exists, click the down arrow to the right of its name and select “Manage Group” from the dropdown menu that appears.

- Toggle the Auto Balanced Collector Group slider, located at the very top of the dialog, to the right to enable auto balancing for the Collector group.
- If Collectors are currently assigned to your new ABCG (i.e. you are converting an existing Collector group to an ABCG), the Do not auto balance monitored devices option appears. By default, this option is unchecked, allowing all devices to dynamically move among all Collectors.
However, if you prefer to leave devices assigned to their current Collectors and instead manually enable the devices on a case-by-case basis for participation in auto balancing (as discussed in the Assigning Devices to Auto-Balanced Collector Groups section of this support article), check this option (not recommended). Conversely, if you leave this option unchecked, but have a scenario in which a device must be monitored by a specific Collector (or in which it is not ideal for the device to move among Collectors), you can manually remove it from auto balancing—in the same way you would manually add it.

- Click Save.
Rebalancing Thresholds
The instance count threshold for a Collector in an Auto-Balanced Collector Group (ABCG) is auto-calculated using the ABCG’s assigned threshold value and the RAM on the Collector machine. By default, this threshold is set to 10,000 instances, which represents the instance count threshold for a medium-sized Collector that uses 2 GB of RAM. (See the calculation below.)
You can adjust this threshold value in the ABCG’s configuration using the following table as a reference point. Set the limit to the value in the Medium column that correlates to the approximate number of instances you would like on each Collector. For any additional guidance, contact Support.
The number of instances that a Collector can handle is calculated with:
Number of instances = (Target_Collector_mem/Medium_mem)^1/2 * Medium_Threshold
For example, if a user sets a Medium (2G) Collector’s threshold to 10,000, for a Large (4G) Collector, the threshold will be scaled to: (4/2)^1/2*10000 = 14140 instances
Assigning Devices to Auto-Balanced Collector Groups
Devices are assigned to Collectors from their configuration settings.

To assign a device to an Auto-Balanced Collector Group (ABCG), specify the ABCG in the Collector Group field. By default, the Preferred Collector field will dynamically update to “Auto Balanced.” This indicates that the device will participate in auto-balancing activities.
There may be situations in which a device must be monitored by a specific Collector (or in which it is not ideal for the device to move among Collectors). In these cases, you can designate a specific Collector in the Preferred Collector field that will be dedicated to that device, effectively removing the device from auto-balancing activities.
Overview
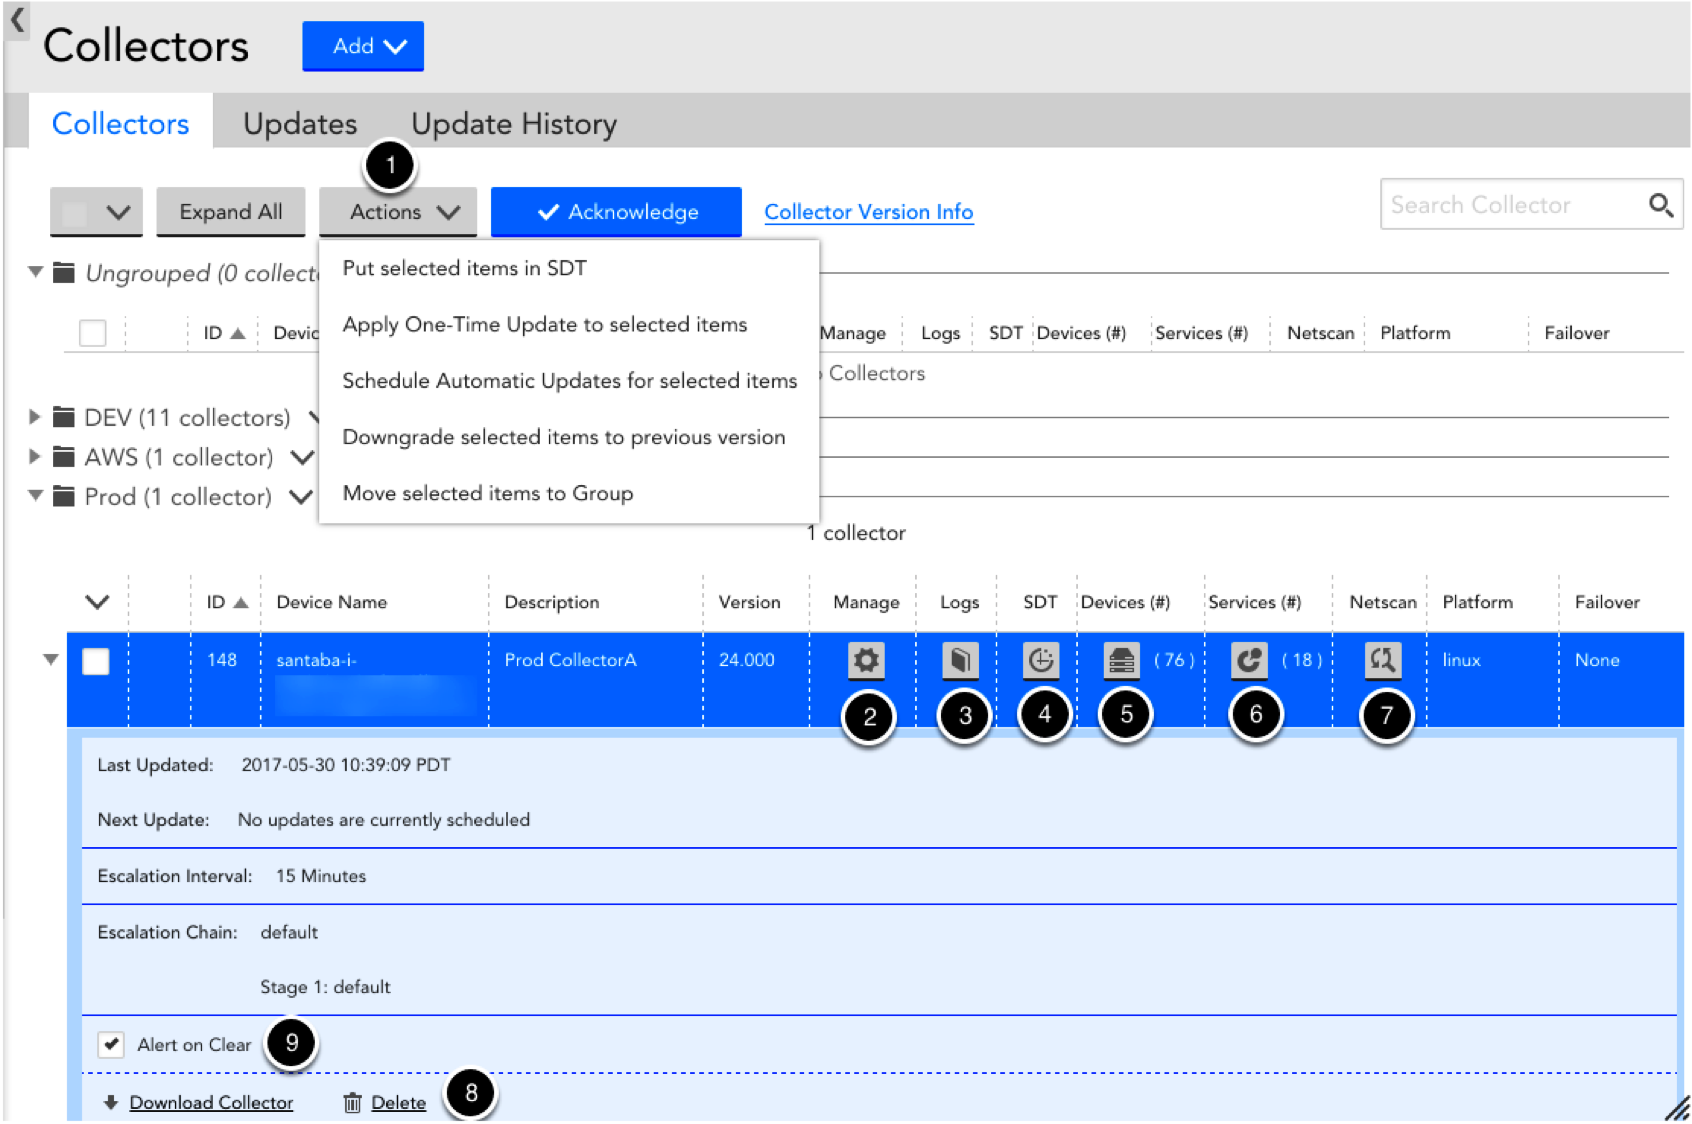
All Collector management items can be performed from Settings | Collectors in your LogicMonitor account. Using the screenshot below as a reference:
- Actions: from this top-level dropdown, you can:
- Schedule downtime for all selected Collectors
- Update all selected Collectors via a one-time or regularly scheduled update
- Downgrade all selected Collectors to their prior version.
- Move selected Collectors to a new Collector Groups
- Manage: this will open a new window from which you can:
- Access the Collector debug facility
- Restart a Collector
- Group Collectors
- View Collector events
- Change the escalation chain and/or escalation interval for Collector down alerts
- Change log settings.
- Schedule downtime for the associated Collector.
- View all devices associated with this Collector.
- View all Services associated with this Collector.
- Schedule a Netscan policy.
- Delete a Collector.
- Enable/disable alert clear notifications for this Collector.
For third-party integration, you must enable the Alert on Clear checkbox to:
– Receive a clear alert notification when the collector is up and running.
– Receive an active alert notification each time the collector goes down.
Upgrading your Collector
In the Collectors section of the Settings tab, you can use the ‘Actions’ dropdown (item 1 in the above screenshot) to perform a one-time Collector update or set up a schedule for automatic updates to be applied to one or more Collectors. Simply check the box next to the Collectors you wish to update and select your preferred Collector-update option.
If you select “Apply one-time update,” you can select an upgraded Collector version and a desired start time for the upgrade process, as shown below:

Note: When upgrading from any collector version to GD 34.002 for non-root docker, for the Ping DataSource to work, run the command sudo setcap cap_setfcap+eip setnetcapraw in the Agent_Root/bin folder, and then restart the collector from the LogicMonitor portal. Note that you do not have to run this command when a freshly installed GD-34.002 is upgraded to a higher version.
If you select “Schedule automatic update,” you can specify which Collector releases (Required General, Optional General, or Early Releases) you want to be applied and when the update process should occur, as shown below:

Collector Downgrade
From the Actions dropdown, you can choose to “Downgrade” a Collector, which will revert the Collector to the version immediately prior. This allows you to explore Early Release Collectors knowing that, should any issues occur, you can simply revert to a version stable for your environment.
Note that you will not be able to downgrade a Collector when the Collector is down (ie. can not be accessed). Additionally, downgrading a Collector will not impact any regularly scheduled Collector upgrades.
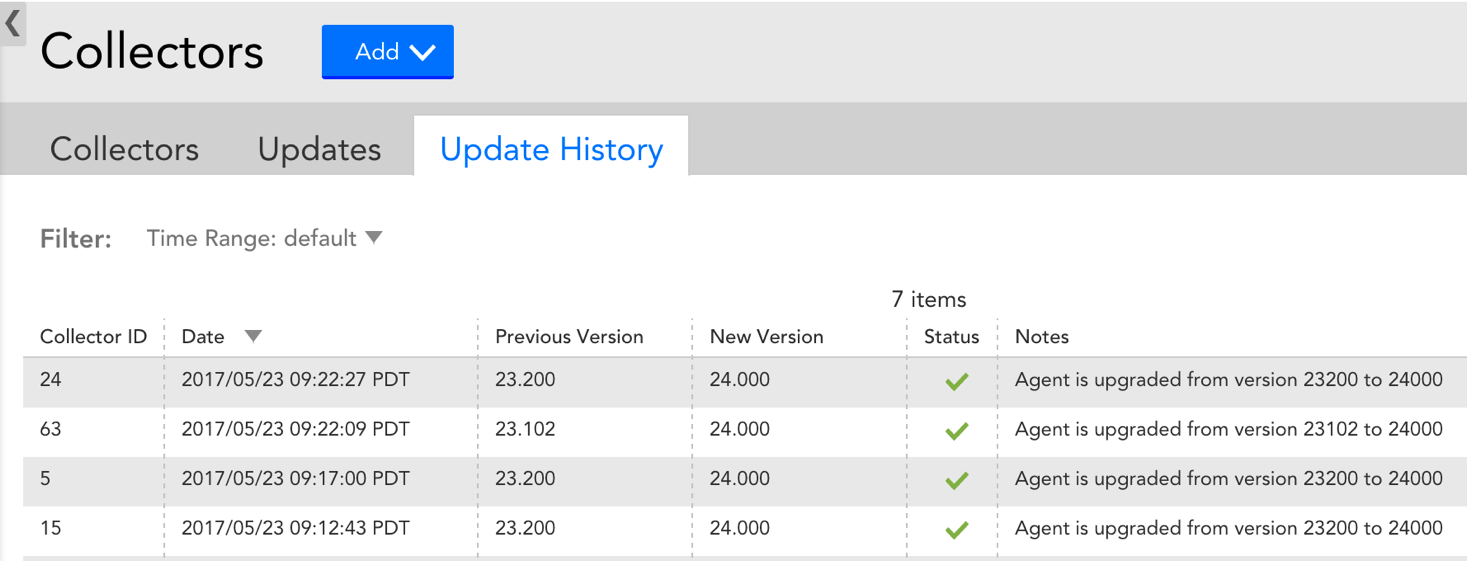
Collector Update History
From Settings | Collector | Update History, you can view a full log of when each of your Collectors was upgraded or downgraded, the status of the update, relevant upgrade/downgrade notes, as well as the Collector’s version pre- and post-update. This is a valuable way to keep track of your Collector’s history and correlate Collector upgrades with unexpected changes in your environment.
Collectors have the ability to cache Collector data to disk. This enables Collectors to store data in your environment during periods where your Collector is unable to deliver data to your LogicMonitor account (e.g. as a result of network issues). Once your Collector can reach your account again, the buffered data will be communicated to our servers, eliminating any gaps in data you would have otherwise seen. By default, Collector caching is enabled and configured to cache up to 30 minutes of data.
Note: LogicMonitor only evaluates the most recent five minutes of cached data for alerts. In other words, the connection to LogicMonitor must be reestablished within five minutes of an alert condition in order for an alert to occur for that condition.
How can I change the time limit from 30 minutes?
You can change how much time the Collector can cache data for by changing the value of the reporter.persistent.expire option in the Collector’s agent.conf file. This option is set to 30 by default, which corresponds to up to 30 minutes of cached data. The option should not be set to any value larger than 1440, which corresponds to 24 hours (Collectors restart every 24 hours and caching cannot continue after a restart). Note that setting the reporter.persistent.expire option to larger value will consume more disk space.

How much disk space is needed?
The amount of disk space necessary on the Collector server is dependent on how heavily loaded the Collector is, as well as how long data is cached for. The following are estimates of disk space usage for various Collectors, assuming 50 instances per device, an average collection interval of 2 minutes & 30 minutes of cached data:
How can I disable caching?
You can disable/enable Collector caching by setting the reporter.persistent.enable option in the Collector’s agent.conf file to false/true, respectively. Note that this option is set to true by default.

Where is the cached data stored?
For Linux: The cached data is stored in the /usr/local/logicmonitor/agent/bin/queues/data directory.
For Windows: The cached data is stored in the C:\Program Files\LogicMonitor\agent\bin\queues\data path.
(This path may change if you didn’t install the Collector in the default directory).
For Linux: /usr/local/logicmonitor
For Windows: C:\Program Files\LogicMonitor
How is data discarded when the time limit is reached?
If the Collector continues to cache data after the limit configured in reporter.persistent.expire (30 mins by default), the oldest data will be discarded.
Introduction
Grouping your Collectors into logical units can streamline account management, simplify end user permission settings, improve efficiency, and more. LogicMonitor supports two types of Collector Groups:
- Standard Collector groups
- Auto-Balanced Collector Groups
Standard Collector Groups
Standard Collector groups primarily assist with Collector organization. For example, you could decide to organize Collectors into groups based on any of the following shared characteristics:
- Physical location. If you have infrastructure across multiple data centers or offices, grouping Collectors based on their locations can simplify assigning Collectors throughout your account (e.g. when devices are added).
- Customer. If you’re an MSP, grouping Collectors by customer can make it easier to quickly find a particular Collector, and additionally simplifies the Collectors page display when you have a large number of Collectors in your account.
- Environment. You may want to group Collectors based on whether they are in a development, QA, production, or other environment. This will enable you to set user role permissions per group, to ensure that your team members have the appropriate access.
Auto-Balanced Collector Groups
Auto-Balanced Collector Groups (ABCGs) provide functionality beyond organization. The Collectors in an ABCG share device load, allowing for dynamic device balancing, scaling, and failover. For more information on Auto-Balanced Collector Groups, see Auto-Balanced Collector Groups.
Creating Collector Groups
To create a Collector group, navigate to Settings | Collectors | Add | Collector Group. As shown (and discussed) next, there are several settings that must be established in order to configure a new Collector group.

Auto-Balanced Collector Group
Toggle the Auto Balanced Collector Group slider, located at the very top of the Add Collector Group dialog, to enable auto balancing for the Collector group. As discussed in Auto-Balanced Collector Groups, auto-balancing allows you to share device load among a group of Collectors.
Name and Description
In the Name and Description fields, enter a name and description for your new Collector group.
Custom Properties
From the Custom Properties area of the Add Collector Group dialog, you can manually define properties on your Collector that can then be tokenized in Collector-related alert messages. This is particularly useful for routing Collector down, failover, and failback alerts through an external ticketing system. For example, assume for a moment that you have a team in Austin that is responsible for a specific subset of Collectors. To ensure the Austin team is properly notified in the event one of their Collectors goes down, you can assign these Collectors a custom property, as shown next.

Once assigned, the property can be tokenized (##team##), and used to route alerts to the proper team via your organization’s ticketing system. The token is substituted with the property value at the time of generation so that the alert or integration delivery can include dynamic information.
Advanced Options
If you designated your new group as an Auto-Balanced Collector Group, an Advanced Options heading displays. As discussed in Auto-Balanced Collector Groups, the options under this heading allow you to rebalance Collector thresholds.
Moving Collectors Across Collector Groups
Collectors are assigned to Collector groups at the time Collectors are added. As your LogicMonitor deployment evolves over time, it is likely you’ll want to move Collectors among groups to suit new organizational needs, create auto-balanced groups, and so on. To move Collectors from one Collector group to another, navigate to Settings | Collectors. From the Collectors page, either:
- Place a checkmark next to all Collectors you’d like to move and select Actions | Move selected items to Group. This is ideal for moving multiple Collectors at once.
- Open a Collector’s configurations and select a new group from the Collector Group field.
Moving Collectors Between Standard and Auto-Balanced Collector Groups
Collectors function very differently depending upon whether they are members of a standard Collector group or an Auto-Balanced Collector Group (ABCG). Collectors in a standard group operate independently of one another and each manually designates a static failover Collector. Collectors in an ABCG dynamically fail over to other Collectors in the ABCG, thus requiring no manually designated failover Collector. This becomes an important distinction when moving Collectors between these two Collector group types, requiring you to keep the following considerations in mind:
- Moving from standard Collector group → ABCG. When moving a Collector out of a standard Collector group and into an ABCG, it’s important to note the following:
- The Collector’s Failover Collector designation will be discarded. ABCGs employ a dynamic rebalancing algorithm upon Collector failover; they don’t rely upon a one-to-one manual failover designations between Collectors.
- As discussed in Auto-Balanced Collector Groups, there are several characteristics Collectors belonging to the same ABCG must share.
- You decide whether the devices currently monitored by the Collector should be immediately enabled for auto balancing. Upon moving, you’ll be presented with the Do not auto balance monitored devices option. Also discussed in Auto-Balanced Collector Groups, this option, when checked, leaves the devices assigned to their current Collector, allowing you to manually enable the devices on a case-by-case basis for participation in auto balancing.
- Moving from ABCG → standard Collector group. When moving a Collector out of an ABCG and into a standard Collector group, it’s important to remember that the Collector has no failover designation. You’ll need to open its settings and assign one from the Failover Collector field.
Managing Collector Groups
Collector groups can be edited or deleted from the Collectors page, as shown next.

Note: As discussed in Roles, a combination of Collector Group and device permissions impact how individual users can interact with Collectors within the account.
The service account used by the collector needs the ability to restart the collector services. Without this right, the collector and its associated watchdog will not be able to restart each other. If you find your collectors periodically going down after 8 hours or so, group policy permissions could be preventing them from restarting themselves or one another.
Ensure the account you specify for the LogicMonitor Collector and LogicMonitor Collector Watchdog services has the Read permission, and the Stop, Start, and Pause permissions to these services.
For more information about how to grant these permission, consult your Microsoft documentation. An article with step-by-step instructions can also be found at:https://social.technet.microsoft.com/wiki/contents/articles/5752.how-to-grant-users-rights-to-manage-services-start-stop-etc.aspx.
If you find you need to update the credentials provided when installing the collector, you must log on to the collector computer and update the services. It is common to have to update this account if you mistakenly installed the collector with Local System context and now need to monitor remote computers. To change the context of the collector service:
- Start the Services administration tool, either by launching it from Administrative tools or by typingservices.msc in the Start > Find field.
- Locate the LogicMonitor Collector service.
- Right-click it, click Properties, and then select the Log On tab.
- Click Check next to This account:, and either browse to the appropriate user or type it in.
- Complete the password information and click OK.
- Acknowledge that the password will not take effect until restart.
- Repeat for the LogicMonitor Collector Watchdog service.
- Stop both services, and then start the LogicMonitor Collector Watchdog service. This will start the LogicMonitor Collector service.
LogicMonitor can be thought of as a system. In most cases, the components actively involved are the Collectors installed in your datacenters and the servers providing your LogicMonitor account.
In the standard state, the Collectors use protocols such as SNMP and WMI from your systems to collect data from your monitored hosts, encrypt the data, and transmit it through an outgoing SSL connection to your LogicMonitor account:

Where there are strict controls on outgoing HTTPS connections, you can configure Collectors to work through a proxy at your location to reach LogicMonitor.

In the distributed Internet, there may be issues in the direct path between the Collector (or its proxy) and the LogicMonitor servers. In this situation, Collectors can lookup application proxies that LogicMonitor has operating in different zones around the Internet, and find one that is reachable and can also reach the responsible LogicMonitor servers.
The Collector then sends the encrypted traffic to these proxies, which will forward the traffic on to the primary LogicMonitor servers, thus avoiding most connectivity issues. When the Collector detects that direct reachability issues have been resolved, it will revert back to direct communication.

Collector Bandwidth Usage
LogicMonitor is designed to be efficient with your bandwidth. While the exact amount of bandwidth usage depends on the kinds of resources being monitored (a storage array with thousands of volumes has more data to report than a temperature probe, for example), the following are data from our active customer base:
- The average bandwidth usage of a Collector reporting back to LogicMonitor is 3.2Kbps per resource monitored.
- The median bandwidth usage of a Collector reporting back to LogicMonitor is 2.3Kbps per resource monitored.
This means that you could have about 300 resources monitored by a Collector before it will use 1Mbps (or 420 resources if you use the median bandwidth).
The amount of data that a Collector can handle depends on the Collector’s configuration and resources. You can monitor the data collection load and performance of your Collector to minimize disruption and notify when a collector is down. See Monitoring your Collectors.
If you have a large environment, and are experiencing alerts on the Unavailable Task Rate datasource of your Collectors, you may need to tune your Collector to increase its monitoring capacity.
Device Capacity Limits
The following table describes the capacity of collectors in different sizes. It is measured in requests per second (RPS) (except for Syslog, which is measured in events per second (EPS).
Note:
- We have attached 50 instances to every device. Thus, to get the number of instances, multiply the number of devices by 50. For example, 50 x 211 (devices) = 10550 instances
- These measurements are estimates and the actual capacity may vary as per production environment.
| Protocol | Small Collector | Medium Collector | Large Collector | Extra Large (XL) Collector | Double Extra Large (XXL) Collector |
| CPU: 1 Intel Xeon Family System Memory: 2GiB JVM maximum memory: 1GiB | CPU: 2 Intel Xeon E5-2680v2 2.8GHz System Memory: 4GiB JVM maximum memory: 2GiB | CPU: 4 Intel Xeon E5-2680v2 2.8GHz System Memory: 8GiB JVM maximum memory: 4GiB | CPU: 8 System Memory: 16GiB JVM maximum memory: 8GiB | CPU: 16 System Memory: 32GiB JVM maximum memory: 16GiB | |
| SNMP v2c (Linux) | 300 standard devices 76 RPS | 1000 standard devices 256 RPS | 4000 standard devices 1024 RPS | 8000 standard devices 2048 RPS | 15000 standard devices 3840 RPS |
| SNMP v3 | 855 standard devices 220 RPS | 1087 standard devices 278 RPS | 1520 standard devices 390 RPS | 2660 standard devices 682 RPS | 4180 standard devices 1074 RPS |
| HTTP | 320 standard devices 160 RPS | 1400 standard devices 735 RPS | 2400 standard devices 1260 RPS | 4500 standard devices 2000 RPS | 7500 standard devices 3740 RPS |
| WMI | 211 standard devices 77 RPS | 287 standard devices 102 RPS | 760 standard devices 272 RPS | 1140 standard devices 409 RPS | 1330 standard devices 433 RPS |
| BatchScript | 94 standard devices 5 RPS | 124 standard devices 7 RPS | 180 standard devices 11 RPS | 295 standard devices 17 RPS | 540 standard devices 32 RPS |
| Perfmon | 200 standard devices 87 RPS | 400 standard devices 173 RPS | 800 standard devices 347 RPS | TBA | TBA |
| JMX | 1000 standard devices 416 RPS | 2500 standard devices 1041 RPS | 5000 standard devices 2083 RPS | TBA | TBA |
| Syslog | TBD | 500 EPS (assuming event size of 100-200 bytes) | 2500 EPS (assuming event size of 100-200 bytes) | 4000 EPS (assuming event size of 100-200 bytes) | 7000 EPS (assuming event size of 100-200 bytes) |
| SNMP v2 Trap | TBD | 17 standard devices | 87 standard devices | 140 standard devices | 245 standard devices |
| SNMP v3 Trap | TBD | 14 standard devices | 70 standard devices | 112 standard devices | 196 standard devices |
The capacity also depends on the number of instances that need to be discovered for each monitored device. For example, if each device is a load balancer with 10,000 instances, collector capacity will be lower. If each device is a switch with hundreds of interfaces, collector capacity may be lower because it is limited by discovery.
Note:
- For monitoring production critical applications and infrastructure, it is recommended to use medium and above size collector as per your requirements. You can use small size collector for testing purpose.
- If a collector runs on an Amazon EC2 instance, we recommend that you use a fixed performance instance type (such as M5 or C5) instead of a credit based instance type (such as T2).
- The nano collector size is not included in this table. The nano collector is used for testing and hence, no recommended device-count capacity has been assigned to it.
- Collectors using JDK 11 (supported by collector version 28.400 and later) will see roughly 10% more memory and CPU usage than the previous JDK 8 collectors on the same hardware.
- Incase of the estimated collector performance numbers for SNMP v2 and v3 Trap LogSource, we have assumed that each device generates 10 traps per second.
Collector memory requirements in a VM
Part of a Collector’s system memory allocation is devoted to Standalone Script Engine (SSE), which is enabled by default and used to execute script DataSources (Groovy scripts).
| Collector Size | SSE Memory Requirements |
| Small | 0.5GiB |
| Medium | 1GiB |
| Large | 2GiB |
| Extra Large | 4GiB |
| Double Extra Large | 8GiB |
In general, the SSE requires half of the amount of memory allotted to the JVM. The memory requirements are not shared, rather the SSE requirement is in addition to the JVM memory requirements. If the Collector does not have this memory available, the SSE will not start and you will see “Can’t find the SSE Collector Group” in the Collector Status dialog. The Collector will work without the SSE, but Groovy scripts will be executed from the Agent instead of the SSE.
If the Collector is executed in a VM, this safeguard can be overridden because the OS indicates there is free memory. This burst memory capacity in VMs can increase memory use above the system memory requirements listed previously. Although this can happen for Collector of any size, it is far more likely to happen to small Collectors.
To disable SSE and prevent additional memory use, edit the Collector’s agent.conf:
- If the configuration setting reads
groovy.script.runner=sse, change it togroovy.script.runner=agent. - If the previous setting is not present, update the following setting:
collector.script.asynchronous=false.
For more information, see Editing the Collector configuration files.
NetFlow Capacity
The following table describes the capacity of NetFlow collectors across different sizes and OS platforms. It is measured in flows per second (FPS).
Note:
- For optimum performance, we recommend that you use the NetFlow collector only for collecting and processing NetFlow data.
- All numbers mentioned below are captured in the in-house PSR lab under controlled conditions. Hence, collector’s actual capacity may vary based on the nature of the NetFlow traffic at the customer’s end.
- Processing NetFlow data is CPU intensive. In case of a CPU crunch, we recommend that you first increase the resources (CPU cores) on the Collector Host to support more number of flows. You can then switch to a bigger size collector if increasing the CPU capacity does not help.
| OS Platform | Metric | Small Collector | Medium Collector | Large Collector | Extra Large (XL) Collector | Double Extra Large (XXL) Collector |
| Windows 64 bit Linux 64 bit | Supported Flows/sec | 7800 | 13797 | 23166 | 37418 | 52817 |
Tuning Collector size
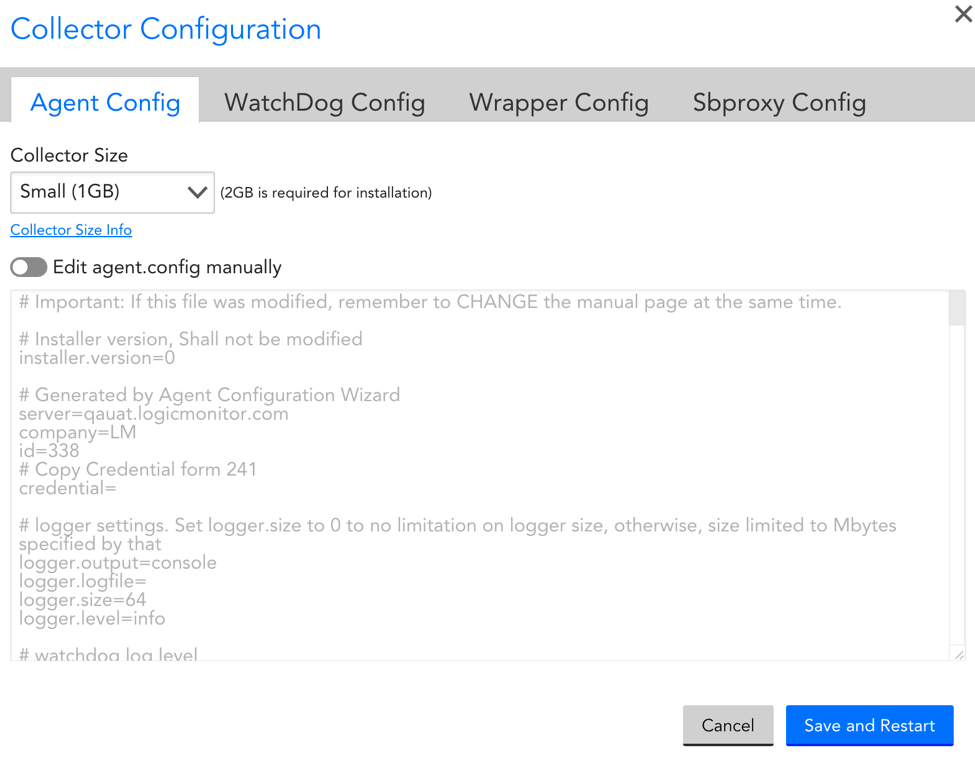
You can adjust the Collector size from the LogicMonitor UI, especially for performance tuning and increasing the Collector capacity after you installed it.
From Manage Collector | Support| Collector Configuration, select the Collector size from the dropdown menu. After you “Save and Restart” the settings, LogicMonitor will automatically verify that your host has enough available memory to support the new Collector size.
Note:
- Older Collectors will display their current size as “Custom (xGiB)” in the dropdown, even if no parameters have been modified since installing. This is because our definition of size has changed since the Collector was installed. If you want to ensure the Collector configuration is up to date, simply select the size you want (or had installed originally) and select Save and Restart.
- Changing a Collector’s size has no effect on parameters unrelated to its size. The parameters listed in the section below, Configuration Details, are the only ones impacted by a change in the Collector’s size.
If you are manually changing the Collector’s config parameters, we will run a validity check after you select “Save and Restart” to ensure that no errors were made in the new configuration. If errors are detected, we will display which lines are missing/duplicated so they can be corrected.
Small Collector
| Config File | Parameters | Description |
| wrapper.conf | wrapper.java.initmemory=128 | Minimum Java Heap Size(MiB) for Collector |
| wrapper.java.maxmemory=1024 | Maximum Java Heap Size(MiB) for Collector | |
| sbproxy.conf | wmi.stage.threadpool.maxsize=100 | The maximum size of threads to handle WMI query/fetch data in sbwinproxy.exe |
| wmi.connection.threadpool.maxsize=50 | The maximum size of threads for WMI to connect to remote machine in sbwinproxy.exe | |
| agent.conf | sbproxy.connector.capacity=8192 | The maximum number of requests that the Collector can send in parallel to sbwinproxy and sblinuxproxy |
| discover.workers=10 | Allocates resources to Active Discovery iterations | |
| autoprops.workers=10 | The thread pool size for AP | |
| reporter.persistent.queue.consume.rate=10 | The max count of data entries that will be reported for each API call. | |
| reporter.persistent.queue.consumer=10 | The thread count used to read from buffer and execute reporting. | |
| collector.script.threadpool=100 | The max thread count to run script tasks. | |
| website.conf | sse.max.spawn.process.count=3 | N/A |
Medium Collector
| Config File | Parameters | Description |
| wrapper.conf | wrapper.java.initmemory=512 | Minimum Java Heap Size(MiB) for Collector |
| wrapper.java.maxmemory=2048 | Maximum Java Heap Size(MiB) for Collector | |
| sbproxy.conf | wmi.stage.threadpool.maxsize=200 | The maximum size of threads to handle WMI query/fetch data in sbwinproxy.exe |
| wmi.connection.threadpool.maxsize=100 | The maximum size of threads for WMI to connect to remote machine in sbwinproxy.exe | |
| agent.conf | sbproxy.connector.capacity=8192 | The maximum number of requests that the Collector can send in parallel to sbwinproxy and sblinuxproxy |
| discover.workers=40 | Allocates resources to Active Discovery iterations | |
| autoprops.workers=10 | The thread pool size for AP | |
| reporter.persistent.queue.consume.rate=12 | The max count of data entries that will be reported for each API call. | |
| reporter.persistent.queue.consumer=10 | The thread count used to read from buffer and execute reporting. | |
| collector.script.threadpool=200 | The max thread count to run script tasks. | |
| website.conf | sse.max.spawn.process.count=5 | N/A |
Large Collector
| Config File | Parameters | Description |
| wrapper.conf | wrapper.java.initmemory=1024 | Minimum Java Heap Size(MiB) for Collector |
| wrapper.java.maxmemory=4096 | Maximum Java Heap Size(MiB) for Collector | |
| sbproxy.conf | wmi.stage.threadpool.maxsize=400 | The maximum size of threads to handle WMI query/fetch data in sbwinproxy.exe |
| wmi.connection.threadpool.maxsize=200 | The maximum size of threads for WMI to connect to remote machine in sbwinproxy.exe | |
| agent.conf | sbproxy.connector.capacity=16384 | The maximum number of requests that the Collector can send in parallel to sbwinproxy and sblinuxproxy |
| discover.workers=80 | Allocates resources to Active Discovery iterations | |
| autoprops.workers=15 | The thread pool size for AP | |
| reporter.persistent.queue.consume.rate=12 | The max count of data entries that will be reported for each API call. | |
| reporter.persistent.queue.consumer=15 | The thread count used to read from buffer and execute reporting. | |
| collector.script.threadpool=300 | The max thread count to run script tasks. | |
| website.conf | sse.max.spawn.process.count=5 | N/A |
XL Collector
| Config File | Parameters | Description |
| wrapper.conf | wrapper.java.initmemory=1024 | Minimum Java Heap Size(MiB) for Collector |
| wrapper.java.maxmemory=8192 | Maximum Java Heap Size(MiB) for Collector | |
| sbproxy.conf | wmi.stage.threadpool.maxsize=800 | The maximum size of threads to handle WMI query/fetch data in sbwinproxy.exe |
| wmi.connection.threadpool.maxsize=400 | The maximum size of threads for WMI to connect to remote machine in sbwinproxy.exe | |
| agent.conf | sbproxy.connector.capacity=32768 | The maximum number of requests that the Collector can send in parallel to sbwinproxy and sblinuxproxy |
| discover.workers=160 | Allocates resources to Active Discovery iterations | |
| autoprops.workers=20 | The thread pool size for AP | |
| reporter.persistent.queue.consume.rate=15 | The max count of data entries that will be reported for each API call. | |
| reporter.persistent.queue.consumer=20 | The thread count used to read from buffer and execute reporting. | |
| collector.script.threadpool=400 | The max thread count to run script tasks. | |
| website.conf | sse.max.spawn.process.count=10 | N/A |
XXL Collector
| Config File | Parameters | Description |
| wrapper.conf | wrapper.java.initmemory=2048 | Minimum Java Heap Size(MiB) for Collector |
| wrapper.java.maxmemory=16384 | Maximum Java Heap Size(MiB) for Collector | |
| sbproxy.conf | wmi.stage.threadpool.maxsize=1600 | The maximum size of threads to handle WMI query/fetch data in sbwinproxy.exe |
| wmi.connection.threadpool.maxsize=800 | The maximum size of threads for WMI to connect to remote machine in sbwinproxy.exe | |
| agent.conf | sbproxy.connector.capacity=65536 | The maximum number of requests that the Collector can send in parallel to sbwinproxy and sblinuxproxy |
| discover.workers=320 | Allocates resources to Active Discovery iterations | |
| autoprops.workers=30 | The thread pool size for AP | |
| reporter.persistent.queue.consume.rate=20 | The max count of data entries that will be reported for each API call. | |
| reporter.persistent.queue.consumer=30 | The thread count used to read from buffer and execute reporting. | |
| collector.script.threadpool=600 | The max thread count to run script tasks. | |
| website.conf | sse.max.spawn.process.count=15 | N/A |
Minimum Recommended Disk Space
Although the Collector operates in memory, operations such as caching require available disk space on its host. The exact amount of required storage varies and depends on factors such as Collector size, configuration, NetFlow usage, number of Collector logs, and so on.
These are examples of required disk space based on these factors:
- A brand new install Collector will use about 500MiB.
- At most, Collector logs will use 800MiB.
- Temporary files (ie. upgrade files) will use less than 1500MiB.
- Report cache data will use less than 500MiB by default (this figure represents 30 minutes of cached data for a Large Collector)
- If using NetFlow the disk usage is less than 30GiB.
In total, this means Collector disk usage will be less than 3.5GiB without NetFlow and up to 33.5GiB with NetFlow enabled.
This article describes the steps to reinstall a Collector onto the same device. Reinstalling a Collector requires you to shut down the Collector and its services, download and install a new Collector, and remove the old Collector.
If you are reinstalling the Collector onto a different device (or replacing a Collector), we recommend that you download and install a new Collector onto the new device and then transfer the monitored resources from the old Collector to the new Collector. See Moving your Collector to another machine.
Re-download the Collector
When reinstalling the Collector, you may re-download the Collector’s installer file from its listing:
1. In LogicMonitor, navigate to Settings | Collectors.
2. Expand the row for the Collector you want to reinstall and click Download Collector.

3. In the Download Collector dialog, choose how you want to download and install your Collector. You may edit the Collector download settings if needed. See Installing Collectors.
Note: Each installer file has a unique identifier string. Make sure that you are installing the executable that you have just downloaded or the installation will fail.
Note: During installation, LogicMonitor checks for the existence of a duplicate Collector (for example, that this Collector is not already running on another device). Because of this, the old Collector must be stopped for at least 5 minutes before you can install the new Collector.
Reinstall a Windows Collector
1. (Optional) Put the Collector you will reinstall into SDT to prevent unwanted alerts during this process. From your LogicMonitor account’s Settings | Collectors page, select the Collector and click the SDT icon to add a “Scheduled DownTime”.
2. On the local collector machine, remove LogicMonitor Collector from the Control Panel\Add or Remove Programs menu.
3. Rename the directory C:\Program Files\LogicMonitor to C:\Program Files\LogicMonitor_OLD.
4. In services.msc, verify that both logicmonitor-watchdog and logicmonitor-agent are not present.
a. If the services still exist, open cmd with admin priveleges and run the following commands to remove them:
sc delete logicmonitor-watchdog
sc delete logicmonitor-agentb. Restart the collector machine and verify that the services have been removed.
Note: To make sure that the Collector reinstalls successfully, LogicMonitor must have enough time to recognize that the old Collector is down. This may take up to 5 minutes.
5. Re-download the Collector installer executable file from the list in Settings | Collectors. See the previous section, “Re-download the Collector” for more details.
6. Run the installer file. (We recommend using the installation wizard.)
7. If there are logs or jar files in the old collector install directory, confirm that they are no longer required or have been backed up if needed.
8. Delete the old collector directory: C:\Program Files\LogicMonitor_OLD
Reinstall a Linux Collector
1. (Optional) Put the Collector you will reinstall into SDT to prevent unwanted alerts during this process. From your LogicMonitor account’s Settings | Collectors page, select the Collector and click the SDT icon to add a “Scheduled DownTime”.
2. As a root user on the local collector machine, run the sbshutdown script to stop the Collector and Collector Watchdog services. By default, this script is located in /usr/local/logicmonitor/agent/bin.
[root@collector-host ~]# cd /usr/local/logicmonitor/agent/bin/
[root@collector-host bin]# ./sbshutdown3. Uninstall the Collector by running the uninstall script or manually removing the collector directory and all its contents:
a. (Recommended) Uninstall the collector using uninstall.sh:
[root@collector-host bin]# ./uninstall.shb. Remove the logicmonitor collector directory (user/local/logicmonitor) and all its contents using the command:
[root@collector-host bin]# rm -rf usr/local/logicmonitorIf there are symbolic links for logicmonitor.collector and logicmonitor.watchdog, those should be removed from /etc/init.d or /etc/rc.d/init.d.
4. Change to the directory where you will install the collector.
5. Re-download the Collector installer executable file from the list in Settings | Collectors. See the previous section, “Re-download the Collector” for more details.
If you are working from a command line, you may copy the curl or wget commands to download the collector onto the host machine.
6. Change the permissions for the installer so that it is executable and run it:
[root@collector-host ~]# chmod +x LogicmonitorCollector64_[COLLECTOR_ID].bin
[root@collector-host ~]# ./LogicmonitorBootstrap64_[COLLECTOR_ID].bin7. When the installation completes, verify that the Collector and Watchdog services are running:
[root@collector-host bin]# ./logicmonitor-watchdog status
[root@collector-host bin]# ./logicmonitor-agent statusYou can control the behavior of LogicMonitor Collectors using configuration files. The agent.conf configuration file is located in the Collector’s installation directory in the following default file path:
- Linux: /usr/local/logicmonitor/agent/conf
- Windows: C:\Program Files\LogicMonitor\Agent\conf
You can view and update the settings in the agent.conf on a per-collector basis in the LogicMonitor user interface.
Note: In addition to the agent.conf file, collector also supports the agent.conf.local configuration file to configure collector settings. The agent.conf.local is located at the same default path given above. The configurations set in the agent.conf.local file take precedence over the configurations set in the agent.conf settings. Thus, you can configure settings such as debug.disable=false and remotesession.disable=true in the agent.conf.local file and ensure that these settings cannot be changed on the LogicMonitor user interface via the agent.conf file. Therefore, modifying the agent.conf.local configuration file incurs risk and must be done with caution.
The user who has access to the machine on which the collector is installed can access and update the agent.conf.local file.
Editing the Collector Configuration Files
- Navigate to Settings > Collectors.
- From the Collectors page, find the Collector you want to configure and click the Settings icon in the Manage column to display its settings.
- Click Support, and then select “Collector Configuration.”

- Open the configuration file you want to edit.
- Toggle the Edit <name>.conf manually switch to manually edit the file.

- Click the Save and Restart button to restart the Collector and apply the changes to the configuration file.