Advanced searches include aggregation, processing, and formating operators that can help you to refine and modify your search results.
You can add advanced search operations to your query after filtering. Search operations work sequentially on a set of events, and the result from one operation is piped into the next one. Some operations work on an event at search time (parsing fields), others require a partial set (limit) or the full set (sort) of events to produce a result. You can view the results of an advanced search in the Aggregate tab.
Note: Advanced search operations are available for LM Logs Enterprise and LM Logs Unlimited customers.
| Operator | Description | Type |
| as | Displays the column name as the alias value. | Formatting |
| avg | Calculates an average of values in a specified source field. Returns one specific value. | Aggregation |
| bucket | Groups log data into fixed time intervals, allowing you to analyze trends and perform aggregations such as count or average over specific time windows. | Aggregation |
| count | Counts the number of events returned by a search, optionally grouped by one or more fields. | Aggregation |
| limit | Limits the results of an aggregation operation to a fixed number of results. | Formatting |
| max | Extracts the maximum value for a set of values for a specified source field. Returns one specific value. | Aggregation |
| min | Extracts the minimum value for a set of values for a specified source field. Returns one specific value. | Aggregation |
| parse | Extracts the contents of a specified source field into a new field based on a string pattern match. The new field is added as a field:value pair to the log metadata. If the source field is not specified, it defaults to the message field. | Processing |
| concat | Concatenates multiple fields or expressions together in the log query. | Processing |
| sort | Sorts the results of an aggregation operation by a set of fields, ascending, or descending. | Formatting |
| sum | Calculates the sum of the values of the specified field, optionally grouped by one or more fields. | Aggregation |
| where | Limits the result of an operation by a specified condition. Can be used for logs processing or aggregation. When used on processing it limits the results of the logs. When used on aggregation it limits the aggregated result. | Processing or Aggregation |
Note: The following examples begin with the filtering query for the wildcard * which searches for all logs. You can replace this wildcard with any filtering query. For more information, see Writing a filtering query.
Aggregation Operators
avg
Calculates an average of values in a specified source field.
Syntax
* | avg(<FIELD>) (as<ALIAS>)
* | avg(<FIELD>) (as<ALIAS>) by <FIELD> (,<FIELD>)
Examples
Example 1: The following example searches through numbers in the 0-9 range in a four-digit sequence pattern, and calculates the average for the numbers found, if any. The average number will be extracted and added to the log event as a field called “number”.
* | parse / ([0-9]{4}) / as number | num(number) as number2 | avg(number2)bucket
Groups log data into time intervals such as hours, minutes, seconds or milliseconds for trend analysis and aggregations such as count or average.
Syntax
Specify a value and unit for the time interval.
* | bucket (span="h", "m", "ms", "ns", "s")
Note: Day or D is not supported in the time interval syntax.
Examples
Example 1: The timeslice aggregation grouping search results into 5s buckets counting the number of hits within each bucket.
* | bucket(span=5s) | count by _bucket | sort by _bucket,_count desc | limit 5
Example 2: The following example with a time range of 7 days in the time-picker displays a 24 hour bucket of the sum of the size of log ingested each day, converted from Bytes to GB for easier reading and sorted in an ascending manner. The result is displayed on the Aggregate tab. Note that the span value is 24h and not 1D.
* | bucket(span=24h) | sum (_size) as size_in_bytes by_bucket | num(size_in_bytes/1000000000) as GB | sort by _bucket asc
count
Counts the number of events returned by a filtering query, and optionally groups the events by one or more fields. You can also count events that contain specific fields.
Syntax
Count the number of events in the specified time range:
* | count
Count the number of events optionally grouped by one or more fields:
* | count (as <ALIAS>) by <FIELD> (, <FIELD>)
Count the number of events only if the event contains the field specified in the argument to count():
* | count(<FIELD>) (as <ALIAS>) by <FIELD> (, <FIELD>)
Examples
Example 1: Count the number of events for each unique resource and show the first 15 results.
* | count by _resource.name | sort by _count desc | limit 15Example 2: You can count the number of unique values for a field by passing the results of one count operation into another count. The following example counts the number of unique resource names sending logs during the specified time range.
* | count by _resource.name | countmax
Extracts the highest value for a set of values for a specified source field. Returns one field if no “by <FIELD>” is specified. Otherwise, an average for each of the specified fields is returned.
Syntax
* | max(<FIELD>)
Examples
Example: 1 The following example searches for numbers in the 0-9 range in a four-digit sequence pattern. If found, the highest number is extracted and added to the log event as a field called “number”.
* | parse / ([0-9]{4}) / as number | num(number) as number2 | max(number2)min
Extracts the lowest value for a set of values for a specified source field. Returns one field if no “by <FIELD>” is specified. Otherwise, an average for each of the specified fields is returned.
Syntax
* | min(<FIELD>)
Examples
Example: 1 The following example searches for numbers in the 0-9 range in a four-digit sequence pattern. If found, the lowest number is extracted and added to the log event as a field called “number” .
* | parse / ([0-9]{4}) / as number | num(number) as number2 | min(number2)sum
Calculates the sum of the values of specified fields, and optionally groups the calculations by one or more fields.
Syntax
Counts the number of events in the specified time range:
* | sum(<FIELD>) (as <ALIAS>) by <FIELD> (, <FIELD>)
Examples
Example 1: Calculate the sum of the size field for each unique resource name, and sort the results.
* | sum(_size) by _resource.name | sort by _sum descProcessing Operators
parse
Extracts the contents of a specified source field into a new field based on a string pattern match. The new field is added as a field:value pair to the log metadata.
Syntax
* | parse <SRC-FIELD> <PATTERN> as <FIELD1> (, <FIELDN>)
- If the source field,
<SRC-FIELD>, is not specified, the message field is used by default. <PATTERN>is a string with wildcards or a Regex.- If parsing multiple fields, the number of field names must match the pattern.
Examples
Example 1: The following example uses a wildcard to search words containing “unix” in the message field and extracts the parts before “unix”. If found, the extracted words are added to the log event as a field called “unix”.
* | parse "* unix" as unixExample 2: The following example uses a Regex search. The query looks for the phrase “Failed to pull image” in the message field, and anything that is not a space, tab, or newline. If found, the image name will be parsed out and added to the log event as a field called “image”.
"Failed to pull image" | parse /Failed to pull image "(\S+)"/ as imageYou can then search for a specific image using the query image=<imagename>.
where
Limits the result of an operation by a specified condition. Can be used on log processing, or on aggregation. When used in processing it limits the results of the logs. When used on aggregation it limits the aggregated result. If a source field is not specified, the operation defaults to the message field.
Syntax
Extracts a specified value from the Source field. The following example limits the logs and not the aggregation. You must use an aggregation function to limit the aggregation.
...where <FIELD>="value"
Examples
Example 1: The following example searches for the exact phrase “unix” in the event messages. If found, the “unix” part will be extracted and added to the log event as a field called “unix”.
* | parse /(unix)/ as unix | where unix="unix"concat
Concatenates multiple fields or expressions together in the log query.
Syntax
Concats field 1 and field 2 together
concat (<FIELD1>, <FIELD2>)
Examples
- Concatenates abc and xyz fields together
- concat(abc, xyz)
- Concatenates abc and xyz fields together adding hyphen in between them
- concat(abc, “-“, xyz)
- Concatenates expressions result (10) to abc field’s value
- concat(abc, 5+5)
Formatting Operators
as
Displays the column name as the alias value.
Syntax
... as <ALIAS>
Examples
Example 1: Calculate the sum of the size field for each unique resource name, and sort the results.
* | sum(_size) as log_volume by _resource.name | sort by log_volume desclimit
Limits the result set to a fixed number of results. The limit operator can only be used after an aggregation operation.
Syntax
* | limit <number>
Examples
Example 1: Count the number of events for each unique resource and show the first 15 results.
* | count by _resource.name | sort by _count desc | limit 15sort
Sorts the result by a set of fields, ascending or descending. The sort operator can only be used after an aggregation operation. By default, results are sorted in descending order by timestamp and ID.
Syntax
* | sort by <FIELD> desc
Examples
Example 1: When sorting by an aggregation operator, include a leading underscore on the operator.
* | count by _resource.name | sort by _count descExample 2: When sorting by an alias, no underscore is needed.
* | sum(_size) as log_volume by _resource.name | sort by log_volume descMore Examples
You may refer the following additional examples to learn how to use the advanced search operators:
Example 1: Displays the list of resource group names with a count of logs and the sum of log size, sorted by count of logs, limited to the top 25 resource group names.
* | count(_size), sum(_size) by _resource.group.name | sort by _count desc | limit 25Example 2: Parses the image name from the message and stores the name in image field (image=imagename). Then displays the unique image names and sorts by imagename with the most occurrences in the specified time range.
“Failed to pull image” | parse /Failed to pull image "(\S+)"/ as image | count by image | sort by _count desc | limit 15Example 3: Displays the aggregated log usage volume by resource name, sorted by descending.
* | sum(_size) by _resource.name | sort by _sum descExample 4: Generates a report showing how many logs a specific resource is generating. This query shows the top 25 resources with a time range set to 30 days. If you want a specific resource or group, replace * with _resource.name=hostname. To generate a report with the results, select the Download Aggregate CSV icon.
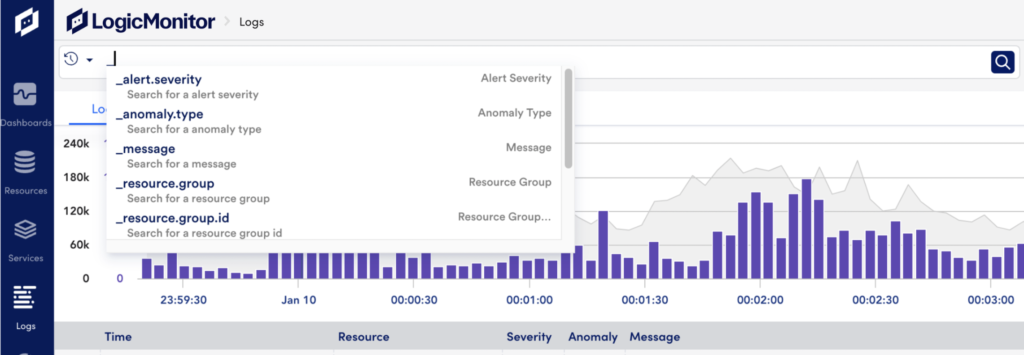
* | count(_size), sum(_size) by _resource.name | num(_sum/1000000000) as GB | num(_sum/_count) as avg_size | sort by GB desc | limit 25Use the query bar on the Logs page to write the query to filter your logs. If you don’t know where to start, type an underscore into the query bar. Autocomplete will show a list of LogicMonitor reserved fields such as resource names, resource groups, log alert severity, anomaly type, and so on.
The filtering query can include fields and values combined with logical operators.
Pattern Matching
The query language is flexible and supports a few different ways to help you filter and narrow down your search for logs: keywords, exact match, fuzzy match, and Regex match.
| Expression | Description |
| Keywords | A keyword search will search the log message field and return the logs that contain the specified word or phrase. |
| Exact match | Searches for a field=value pair will return logs where the field has the exact value that is specified. |
| Fuzzy match | If you don’t want an exact match, you can define a fuzzy match pattern using glob expressions to describe the value. Fuzzy matching is not case sensitive. |
| Regex match | You can use regular expressions to define a pattern to match. Regular expressions need to be put inside of front slashes. |
Logical Operators
You can use the logical operators AND, OR, and NOT to combine multiple filters to narrow your search for logs. Autocomplete will suggest logical operators after you enter a complete keyword or field=value pair.
| Operator | Description |
| NOT | Search for logs except any of the keywords or filters specified. |
| AND | Search for logs that contain all the keywords and filters specified. |
| OR | Search for logs that contain one or more of the keywords and filters specified. |
For more information on search operators, see Advanced Search Operators.
Examples
The following examples illustrate the syntax for searching and filtering logs with the query language. For more usage examples, see Logs Search Cheatsheet.
Example: Exact Match
Return logs from resources named “winserver01” or “win-server01” if their message field contains the keyword “error”.
error AND _resource.name=winserver01,"win-server01"An alternate way to write this search is:
error AND ( _resource.name=winserver01 OR _resource.name="win-server01" )Example: Fuzzy Match
Return logs from any resource that contains the word “linux” in its name if the message field contains the keyword “Invalid login”.
"Invalid login" AND _resource.name~linuxExample: Groups and Subgroups
The following examples show searching groups and subgroups. These examples assume that you have access to groups with the full path “Pods/p02.prod” and “Kubernetes Cluster: services/p01-us-west”.
To search logs for all its subgroups and direct devices:
_resource.group~/Pods\/p02.prod($|\/)/To search logs only for its direct devices:
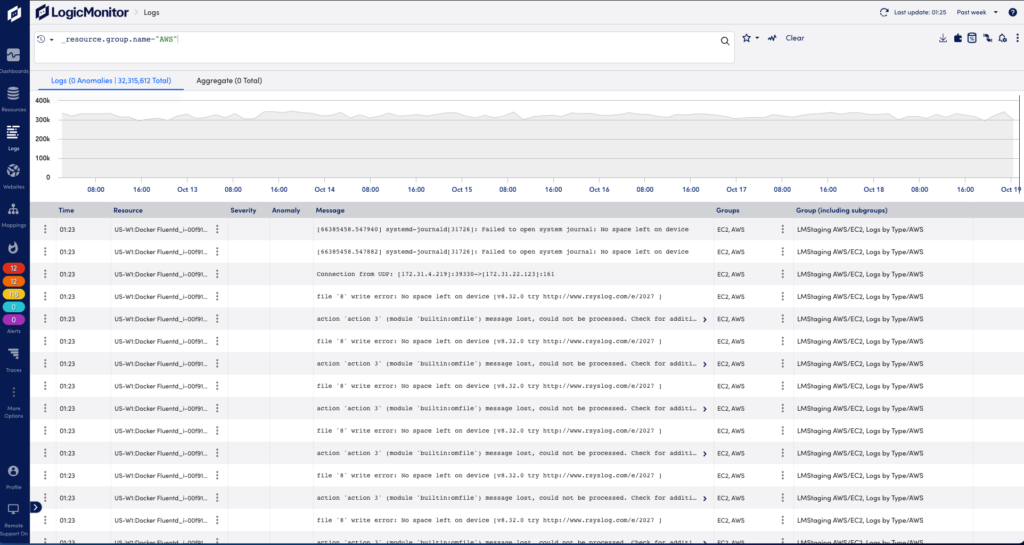
_resource.group="Pods/p02.prod"To search logs by the group name, regardless of the parent group:
_resource.group.name~"p01-us-west"Note: Regular expressions are used for queries with ~. Therefore the resulting output requires more computing resources and may take longer to complete.
Example: Non-reserved Fields
You can query non-reserved fields using the field name (including nested field names). For example, to search for GET requests, you would use the query:
method=GETThe Logs query language expands the standard search capabilities beyond keyword searches and filtering by resource, group, pipeline, and time range. The additional flexibility includes combining filters with logical operators, filtering events based on fields and values parsed from your logs, and matching patterns with glob expressions and regular expressions.
Use the features to for example narrow down information to quickly find relevant logs when troubleshooting. You can also summarize activity from log messages over a time range for reporting or alerting.
Using the Query Bar
Searching and filtering is done from the query bar which is located at the top of the Logs page. Enter your query and select the Run Query icon to start the search.
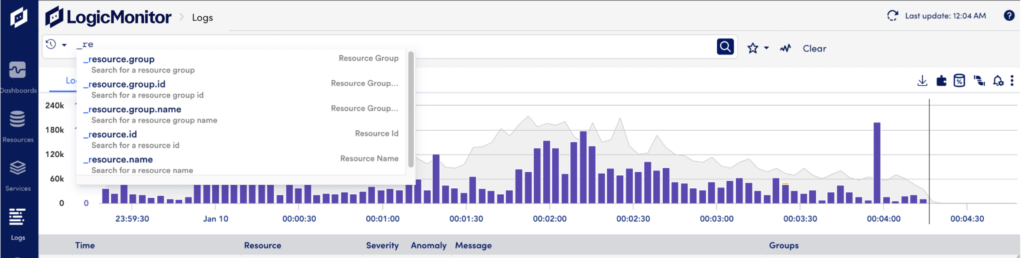
Using Autocomplete
When you type into the query bar, the autocomplete menu will open and provide a list of options based on what you’ve entered and the information that you have in your logs.
If you select a field from the list or type in the field name, autocomplete will then suggest possible values for that field.
After you enter a complete keyword or field=value pair, autocomplete will continue to provide suggestions to help you build the query. For example, you may see options for logical operators: AND, OR, and NOT. For more information, see Log Search Cheatsheet.
Stopping Long-Running Queries
Complex queries covering a long time range may take some time to complete. You can select the Stop Query icon at the end of the query bar to prevent a long-running query from completing.
Changing the Time Range
Select from a list of time ranges in the upper right corner, or manually define a time range to review. The default time range is set to 5 min. You can also change the time range by dragging and selecting within the graph. Then, to revert to your last time range, select the Exit graph zoom icon.
Note: It may take some time before logs from resources in a newly created resource group are included in the log count totals. This is because the log metadata is established at log ingestion, and using resource groups that existed at that time.
Running the Search
Searches do not execute automatically. When you’re done building your query, select the Search icon to run it.
Viewing Search History
You can view and manage your recent searches by selecting the Clock icon to the left on the query bar. The Recent searches menu shows the last 10 searches in your history. You can remove individual or clear all searches from this list.
Saving a Search
Save a search by selecting the Star icon to the right of the query bar.
The following provides tips for how to work with the query language in LM Logs. For more information, see LM Logs query language.
Reserved Fields
LogicMonitor reserved fields are indicated by a leading underscore. If you’re not sure what to search for, you can always start by typing a underscore into the query bar to see the list of reserved fields.

| Field | Description |
| _alert.severity | The severity level of alerts, which can be warning, error, critical. |
| _anomaly.type | The type of anomaly detected, such as never_before_seen. |
| _message | The message field of the log. If a field name is not specified, the _message field is the default search field. |
| _resource.group | The full path of the resource group. |
| _resource.group.id | The resource group ID. These values may not be provided by autocomplete. |
| _resource.group.name | The name of the resource group, which is the part of the full path after the last front slash. |
| _resource.id | The ID of the monitored resource. These values may not be provided by autocomplete. |
| _resource.name | The name of the monitored resource. |
| _tenant.id.{} | The tenant ID of the monitored resource. |
| _user.agent | The user agent name included in the log header. |
| _resource.attributes | The resource mapping information that is used to correlate the logs with monitored resource. |
| _coalesced.fields | Excess metadata entries that are added as a separate key in a string format. The excess metadata entries are added to this field based on the following criteria: The length of the key exceeds the maximum limit. The key has an invalid regex format. |
| _lm.collectorId | The ID of LM Collector that processed the log. |
| _lm.logsource_id | The ID of LogSource applied to the log. |
| _lm.logsource_name | The name of LogSource applied to the log. |
| _lm.logsource_type | The type of LogSource applied to the log (syslog, wineventlog, and so on). |
Note: You should avoid using reserved field names when configuring the sending of log data for ingestion. Using reserved field names when naming custom log metadata fields may cause unexpected behavior when ingesting log data.
Logical Operators
Searching with logical operators supports NOT, AND, and OR to combine filters.
| Operator | Description | Example |
| AND | Search for logs that contain all of the fields and values specified. | _resource.name=winserver01 AND type=wineventsDisplays all logs associated with winserver01 and also contains winevents in the type field. |
| OR | Search for logs that contain one or more of the fields and values specified. | _resource.group.name="Linux Servers" OR _resource.name~linuxDisplays all logs for resources in the “Linux Servers” Resource Group or any resource that contains “linux” in the Resource Name. |
| NOT | Search for logs except any of the fields or values specified. | NOT _resource.name=winserver01Displays all logs from any resource except winserver01. |
Comparison Operators
Run queries comparing number values included in log message or metadata.
| Operator | Description | Example |
| For example <, >, and >= | Parse out specific number values in messages or metadata. | _size>=1500Displays all logs with volumes larger than or equal to 1500 bytes. |
Advanced Search Operators
Advanced searches include aggregation, processing, and formating operators that can help you to refine and modify your search results. For more information, see Advanced Search Operators.
Pattern Matching
Keyword Match
Any free text search will search only the raw log message for matches.
| Query | Description | Example |
keyword | Searches and displays only logs where the keyword is found in the message field. Use when you want to search all log messages for a string or value. This works the same way as previous LogicMonitor Logs keyword search. | errorOnly logs that contain “error” in the message field will be displayed in the logs table. |
Exact Match
Returns events if the pattern exactly matches the field value.
| Query | Description | Example |
field=word | Searches and displays only logs where field has the value word. Use when you know the exact value you want to match. | _resource.name=winserver01Only logs associated with resource “winserver01” will be displayed in the logs table. |
field=word1,word2,word3 | Searches and displays only logs where field has the value word1 OR word2 OR word3. The commas represent an OR operator. Use when there are multiple exact values you want to match. | _resource.name=winserver01,winserver02,winserver03Only logs associated with resources “winserver01”, “winserver02”, or “winserver03” will be displayed in the logs table. |
field="word with special characters" | Uses double quotes to capture a special character in the field value. Finds all logs where field equals “word with special character”. Use when you know the exact value and the value includes a special character. Double quotes are required when there are special characters, such as a hyphen or a whitespace, in the pattern. The non-special characters set is [a-zA-Z0-9*]. | _resource.name="win-server01"Only logs associated with resource “win-server01” will be displayed in the logs table. |
Fuzzy Match
Returns events using glob expressions to match similar field values. Fuzzy matching is not case sensitive.
| Query | Description | Example |
field~word | Searches and displays only logs where field contains word. Use when you specifically want a fuzzy match instead of an exact match. | _resource.name~winserver01Only logs associated with resources that contain “winserver” will be displayed, this includes “winserver01”, “winserver02”, “winserver03”, “winserver03west”, and so on. |
field~word1,word2,word3 | Searches and displays only logs where field contains any of word1 OR word2 OR word3. The commas represent an OR operator. Can use when you want fuzzy match on multiple values. | _resource.name~winserver,linuxserver,firewallOnly logs associated with resources that contain “winserver”, “linuxserver”, “firewall”, etc. will be displayed. This includes resources such as “winserver01east”, “winserver03west”, “nonprodserver”, and so on. |
field~"word with special characters" | Uses double quotes to capture a special character in the field value. Finds all logs where the field contains “word with special character”. Double quotes are required when there are special characters, such as a hyphen or a whitespace, in the pattern. The non-special characters set is [a-zA-Z0-9*]. | _resource.name~"win-server01"Only logs associated with resources that contain “win-server01” will be displayed, this includes “win-server01”, “win-server01-east”, “win-server01-west”, and so on. |
Note: Regular expressions are used for queries with ~. Therefore the resulting output requires more computing resources and may take longer to complete.
Regex Match
Returns log events using regular expressions (Regex) to match field values. Regular expressions must be put inside of front slashes: /regular expression/.
Note: Note: The LM Logs query processing uses the Go RE2 regular expression library. For more information, see the Go RE2 documentation.
| Query | Description | Example |
/regex/ | Searches and displays logs where the message field contains the regular expression. Use when you want to find logs that contain certain structures (such as an IP address, unique identifier, and so on.) | /\b(?:[0-9]{1,3}\.){3}[0-9]{1,3}\b/Only logs that contain an IP address in the message field will be displayed. /\b[0-9a-f]{8}\b-[0-9a-f]{4}-[0-9a-f]{4}-[0-9a-f]{4}-\b[0-9a-f]{12}\b/Only logs that contain a unique identifier structure will be displayed. |
field~/regex1/,/regex2/ | Searches and displays logs where field contains any of regex1 OR regex2 expressions. Use when you want a regex match on multiple values. |
Troubleshooting
Parsing Errors
If there is a parsing error with your query, it may be caused by incorrect syntax.
- Check that all patterns that have special characters in the pattern are surrounded by double quotes.
- If there are double quotes, check that they are the correct double quote characters: “”
- Check that regular expression patterns include properly escaped characters within the “/ /”.
Timeout Errors
For raw logs, the timeout is 2 minutes. A timeout may occur when the time range for the search is too long, such as 30 days, and depends on the volume of ingested logs that you are searching. If the search has a timeout error, try decreasing the time range.