You can use LogicMonitor’s .NET SDK to interact with the Push Metrics REST API.
Note: The SDK offers tools for metric ingestion only. Updating resource and instance properties are currently unavailable.
Downloading and Installing the .NET SDK
- Download the .NET SDK from NuGet.
- Install the SDK by executing the command applicable to your environment:
- Package Manager
Install-Package Logicmonitor.DataSDK -Version 0.0.7-alpha- .NET CLI
dotnet add package Logicmonitor.DataSDK --version 0.0.7-alphaWhen the .NET SDK installs, you can use it to interact with the Push Metrics REST API. For more information about using the SDK with your project, including API references, see the following:
https://github.com/logicmonitor/lm-data-sdk-dotnet
You can use LogicMonitor’s Push Metrics REST API to programmatically add or update properties for existing resources. However, system (system.xyz) and (auto.xyz) properties are not added to the payload.
The Push Metrics REST API requires LMv1 API Token Authentication.
Request Information
The resource property ingestion endpoint is used to add or update one or more properties for an existing resource.
Only one resource is supported per request.
| Method | PUT/PATCH |
| Base URL | https://{ACCOUNTNAME}.logicmonitor.com/rest |
| Path | resource_property/ingest |
| Header | Authorization: LMv1 token |
| Content-Type | application/json |
| Specification | PUT – All the properties for that resource must be specified. PATCH – LogicMonitor will add/update the properties specified in the request. { “resourceName”: “<Resource Name>”, //Optional “resourceIds”: { //Mandatory “key”: “<The value of a property>”,… }, “resourceProperties”: { “key”: “<The value of a property>”,… //Should have at least 1 attribute } } |
For details on the fields used in this request, see Ingesting Metrics with the Push Metrics REST API.
You can use LogicMonitor’s Push Metrics REST API to programmatically add or update properties for existing instances. However, system (system.xyz) and (auto.xyz) properties are not added to the payload.
The Push Metrics REST API requires LMv1 API Token Authentication.
Request Information
The instance property ingestion endpoint is used to add or update one or more properties for an existing instance.
Only one instance is supported per request.
| Method | PUT/PATCH |
| Base URL | https://{ACCOUNTNAME}.logicmonitor.com/santaba/rest |
| Path | instance_property/ingest |
| Header | Authorization: LMv1 token |
| Content-Type | application/json |
| Specification | PUT – All the properties for that resource must be specified. PATCH – LogicMonitor will add/update the properties specified in the request. { “resourceIds”: { //Mandatory “key”: “<The value of a property>”,… } “dataSource”: “<DataSource Name>” //Mandatory “dataSourceDisplayName”: “<DataSource Display Name>”, “instanceName”: “<Instance Name>”, //Mandatory “instanceProperties”: { “key”: “<The value of a property>”,… //Should have at least 1 attribute } } |
For details on the fields used in this request, see Ingesting Metrics with the Push Metrics REST API.
Rate limits are imposed for requests to LogicMonitor’s Push Metrics REST API.
The following table lists default rate limits:
| Limitation Rule | Content- Encoding | Limit | Description |
| Based on compressed payload size | gzip | 104858 bytes | – 104858 bytes limit for the compressed data. – “pushmetrics.maximum.payload.size.allowed” controls API-Ingest APIs. -“payload.size.compression.rate” config is used as compression ratio. For example, if we have “payload.size.compression.rate” as 10 and “pushmetrics.maximum.payload.size.allowed” as 1MB. Then, the maximum allowed payload size in compressed form will be 0.1MB. |
| Based on uncompressed payload size | 1048576 bytes | “pushmetrics.maximum.payload.size.allowed” controls the Ingest APIs. | |
| Based on instance counts | 100 | – Maximum instances allowed in a payload are limited to 100(default) -“pushmetrics.maximum.instances.allowed” | |
| Ingestion Frequency | 10000/ one minute | – 10000 requests per minute. – Controlled at ingress level. |
If internal APIs are used to throttle the ingested data, there may be a delay in the appearance of new devices or properties being used. For example, ingesting bulk data with new resources or property updates causes an ingestion delay for the updated new devices or properties. LogicMonitor applies internal throttling which is indicated in the audit logs and you would need to make the request again. The metrics appear only on the successful creation of the devices.
Recommendation: The bulk creation of devices and instances (especially during the onboarding process) should be spread out rather than sending hundreds of requests at once.
For a resource to receive metrics through the Push Metrics REST API, the resource must be associated with a DataSource. The Datasource must be created initially via Push Metrics Rest API. For more information, see Ingesting Metrics with the Push Metrics REST API.
DataSources created by the Push Metrics REST API are stored along with the other DataSources in the LogicMonitor platform and are managed like the existing DataSources.

DataSource Design
You can manage the DataSources created via Push Metrics REST API from the Settings page. You can also set the thresholds on the DataSource datapoints, which can be referenced in alert rules.
However, the DataSource has a few unique attributes that allow them to support push model data ingestion. These unique attributes and limitations are discussed in the following sections.
Push_Modules Designation
DataSources that push metrics to resources will have a designation of “push_modules” as their collection method type (specified by the Collector field in a DataSource designation).
You cannot modify the DataSource designation via the interface.
Active Discovery Disabled
DataSources created by the Push Metrics API support multiple instances. However, you cannot discover the instances by the Active Discovery Method as the DataSource is dependent on the instance information; and the metrics pushed via the API request.
LogicMonitor uses identical logic to disable the other DataSource configurations relevant only for the pull model of data collection.
For example, LogicMonitor disables the ability to set a collection interval and the ability to alert on the absence of data (known as No Data alerts).
AppliesTo Statement
All DataSources created by the Push Metrics REST API will have an AppliesTo statement that explicitly associates that DataSource with the resource that accompanies it in the API call.
For example, if an API call instructs the Push Metrics REST API to ingest metrics for resource A using DataSource B:
- A unique tag associated with DataSource B is added as a value to resource A’s system.pushmodules property.
- The AppliesTo statement for DataSource B will only associate with resources that carry its tag as a value in their system.pushmodules properties. It does this through the hasPushModules() function, which is identical in concept to the hasCategory() function. For more information on AppliesTo statements, see AppliesTo Scripting Overview.

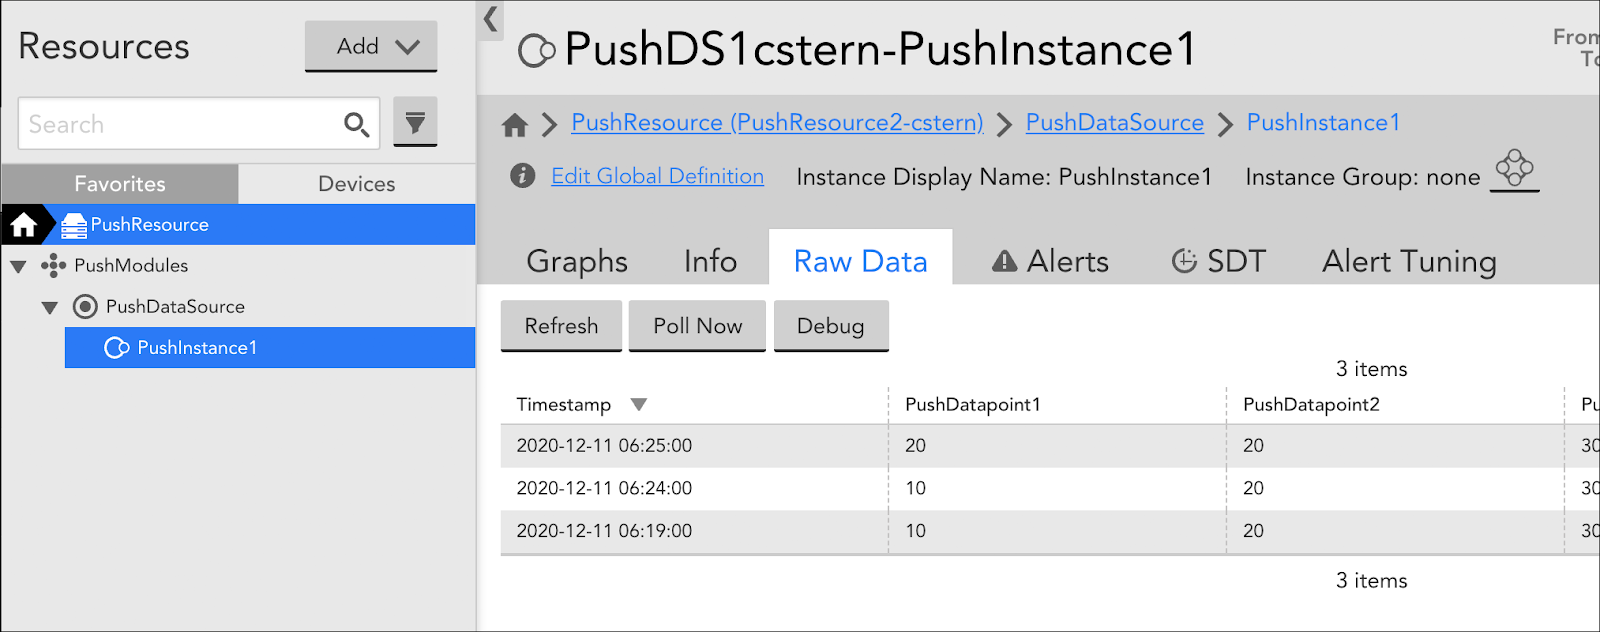
The PushDS1cstern DataSource shown in the image has an AppliesTo statement that explicitly associates it with the resource (via the assignment of the system.pushmodules property to the resource) that accompanies it in the API call. This AppliesTo statement is not available for editing.
Managing Datapoints
Datapoints are created by the API request and cannot be modified or deleted from the LogicMonitor interface. In addition, only complex datapoints can be added to the definitions of DataSources created by the Push Metrics REST API.
You cannot edit the datapoints created by the API request; however, you can apply thresholds to the datapoints.
Note: LogicMonitor automatically creates graphs for every datapoint created by the API request.
Managing Instances
You cannot discover the instances created by the API request using LogicMonitor’s Active Discovery process. In addition, you can manually delete the instances created by a Push Metrics DataSource from the portal interface or delete instances using standard REST API. However, the instances cannot be deleted via the Push Metrics REST API.
Note: The Push Metrics REST API has an endpoint dedicated to updating an instance’s properties. For more information, see Updating Instance Properties with the Push Metrics REST API.
Cloning DataSources
You can clone the DataSources by navigating to Settings > LogicModules > DataSources > Select the required DataSource and click Clone.
Deleting DataSources
You can delete Push Metrics DataSources through the LogicMonitor interface similar to other DataSources; you cannot delete Push Metrics DataSources through the Push Metrics REST API. Once deleted, any data pushed to that DataSource creates a request for creating another new DataSource.
Auto Delete Push Metrics Instances
Note: The auto deleting of instances is applicable only to those Push Metrics instances that have recieved data once after v193 release.
Any Push Metrics instance that has not received data for the last 45 days and is dormant will be automatically deleted. This automatic deletion allows you to control the number of inactive instances on your portal. For example, if we have Instance1 which has not received data for the last 30 days, and Instance2 which has not received data for the last 50 days, then the Push Metrics will detect Instance2 and automatically delete it.
By default, the Push Metrics REST API is designed to push metrics to existing resources in your LogicMonitor portal. However, you can override the default settings for Push Metrics REST API by using the API request, which creates a new resource if no existing resource matches the query. For more information, see Ingesting Metrics with the Push Metrics REST API.
All the resources, including the resources created by the Push Metrics REST API, are stored in the LogicMonitor platform. In addition, a single resource can both ingest push metrics via the Push Metrics API and receive metrics via DataSources that uses the pull-based collection methods.
Resources that ingest push metrics are displayed alongside other resources on the Resources page.
You can create resources and add them to a resource group via the system.groups property.
Note: The resource group must be an existing resource group, and you must have manage permission for resource groups.
A heartbeat is sent to the system for the resources that receive the data via Push Metrics API. If the system does not receive the heartbeats within regular intervals, the resource is displayed as dead.
Resource Design
Resources that receive data via the Push Metrics REST API are similar to the other resources in your LogicMonitor portal. You can associate the resources with multiple DataSources that are grouped into resource groups. In addition, the resources can be referenced in alert rules.
However, the resources have a few unique attributes that allow them to support push model data ingestion. These unique attributes and limitations are discussed in the following sections.
Unique Attribute: system.pushmodules Property
Any resource referenced in a Push Metrics REST API call will be assigned a property named system.pushmodules. Similar to the system.categories property, the system.pushmodules property is automatically updated with values that associate it with its corresponding Push Metrics DataSource(s).
For example, if an API call instructs the Push Metrics REST API to ingest metrics for Resource A using DataSource B:
- A unique tag associated with DataSource B is added as a value to resource A’s system.pushmodules property.
- The AppliesTo statement that is created for DataSource B will only associate with resources that carry its tag as a value in their system.pushmodules properties. For more information on DataSource design, see the Managing DataSources Created by the Push Metrics API section of this guide.
The PushDS1cstern DataSource shown here will only associate with resources whose system.pushmodules property reference its name.
Limitations
There are certain limitations for resources, which are created by the Push Metrics REST API and receive data only from push model DataSources.
Following are the limitations in the context of the push (vs. pull) communications model:
- Manually run Active Discovery for the resource
- Access the resource via a remote session
- Manually poll an instance for current datapoint values (as initiated from the Raw Data tab)
- Debug data collection for an instance (as initiated from the Raw Data tab)
Resource Matching
When a request for metrics ingestion is submitted via the Push Metrics REST API, LogicMonitor searches for the resources that have resource IDs as properties and pair the request with an existing resource in the portal.
If multiple resources are found with specified resource IDs, an error will occur. Hence, you must ensure that the resourceIds field has unique key-value pairs in its array to get the desired result.
Following is a list of system properties, organized by resource type, that can be considered for use in the API query. You can use any resource property in the query. For more information on resource properties, see Resource and Instance Properties.
| Standard Devices/Kubernetes Containers | AWS Resources | GCP Resources | Azure Resources |
| system.display namesystem.deviceid system.hostname system.collectorid system.sysoid System.ips auto.network.mac_address | system.display namesystem.deviceid system.aws.resourceid system.aws.arn | system.displayname system.deviceid system.gcp.resourceid system.gcp.resourcename system.gcp.projectId system.cloud.category system.gcp.resourceid | system.displayname system.deviceid system.azure.resourceid system.azure.resourcename |
If no existing resources are returned, and the create query parameter is set to TRUE in your request (the default settings is FALSE), a new resource is created, which has the specified resource IDs set on it.
The Push Metrics REST API has an endpoint dedicated to updating a resource’s properties. For more information, see Updating Resource Properties with the Push Metrics REST API.
Deleting Resources
You can detect the resources that receive push metrics via the LogicMonitor interface similar to other resources. However, you cannot delete these resources using Push Metrics REST API. Once the resource is deleted, any data pushed to that resource is ignored.
If the deleted resource was created using the Push Metrics REST API and only receives data from push model DataSources, it is immediately deleted (unlike other resources, which are moved to the Recently Deleted folder for seven days).
You can use LogicMonitor’s Python SDK to interact with the Push Metrics REST API.
Note: The SDKs offers tools for metric ingestion only. Updating resource and instance properties are currently unavailable.
Downloading and Installing the Python SDK
Install the SDK from PyPl by executing the following command:
pip install logicmonitor_data_sdkAlternatively, you can download the SDK files directly from PyPI.
When the Python SDK installs, you can use it to interact with the Push Metrics REST API. For more information about using the SDK with your project, including API references, see the following:
https://logicmonitor-data-sdk-py.readthedocs.io/en/latest/
You can use LogicMonitor Push Metrics REST API to programmatically ingest metrics for multiple instances associated with single or multiple resources and DataSource.
The Push Metrics REST API requires authorization using either the LMv1 API token or the Bearer token. For more information, see API Tokens and Bearer Token.
Request Information
The metric ingestion endpoint is used to push metrics of one or more instances associated with a DataSource and resource. Only one resource and DataSource is supported per request. If this is the first time metrics are being pushed to a resource, this request will result in a new DataSource and optionally a new resource (depending on parameters).
| Method | Post |
| Base URL | https://{ACCOUNTNAME}.logicmonitor.com/rest |
| Path | metric/ingest |
| Header | Authorization: LMv1 token or Bearer token |
| Parameter | (Optional)https://companyxyz.logicmonitor.com/rest/metric/ingest?create=trueIf create=true, a new resource will be created if there is no match for the provided resource IDs. The default value is “false”. |
| Content-Type | application/json |
| { “resourceName”: “<Resource name>”, //Optional when create flag is not specified “resourceDescription”: “<Resource description>”, “resourceIds” : { //Mandatory “key1” : “value1”, “key2” : “value2”,… //Multi-values accepted }, “resourceProperties”: { “key1” : “value1”, “key2” : “value2” //Multi-values accepted }, “dataSourceId”: “<DataSource ID>” //Either dataSourceId or dataSource mandatory “dataSource”: “<DataSource Name>” //Either dataSourceId or dataSource mandatory “dataSourceDisplayName”: “<Display Name for the DataSource>” “dataSourceGroup”: “<DataSource Group name>” “instances”:[ { “instanceName”: “<Instance Name>”, //Mandatory “instanceDisplayName”: “<Instance display Name>” “instanceProperties”: { “key1” : “value1”, “key2” : “value2” }, “dataPoints”: [ { “dataPointName”: “<Datapoint Name>”, //Mandatory “dataPointDescription”: “<Datapoint Description>”, “dataPointType”: “<Datapoint Metric Type>”, “dataPointDataType”: “<Datapoint Data Type>”, “values”: { //Mandatory “Epoch Timepstamp” : “Metric Value” } } ] } ] } |
Use the following mandatory and optional fields in your request.
| Field Name | Description | Type | Required? | Validations |
| resourceName | Resource unique name. Only considered when creating a new resource. | String | Required only if the create parameter is set to TRUE (create=true). FALSE is the default. | – 255-character limit – Must be unique – Should not start or end with spaces, tabs, etc – Should not contain line breaks – Characters from A-Z, a-z, and 0-9 allowed as well as colons, hyphens, underscores and full stops – No whitespace allowed |
| resourceDescription | Resource description. Only considered when creating a new resource. | String | Optional. Defaults to “”. | – 65535-character limit |
| resourceIds | An array of existing resource properties are used to identify the resource. For more information on the types of properties that can be used, see Managing Resources that Ingest Push Metrics for information on the types of properties that can be used. If no resource is matched and the create parameter is set to TRUE, a new resource is created with these specified resource IDs set on it. If the system.displayname and/or system.hostname property is included as resource IDs, they will be used as host name and display name respectively in the resulting resource. Note: Resource IDs provided need not fully or partially match (Logical And, OR) for the existing resources. | JSON object | Required | – Takes input as key-value pairs in the form of property name and assigned value (For example, “system.displayname” : “mcentos”) – Keys and values are strings – All characters except , ; / * [ ] ? ‘ ” ` ## and newline are allowed -Spaces allowed except at start or end – Keys and values should not contain backslashes (\)Null key and value are not allowed – Keys have 255-character limits; values have 24000-character limits – Case insensitive |
| resourceProperties | New properties for resource. Updates to existing resource properties are not considered. Depending on the property name, we will convert these properties into system, auto, or custom properties. | JSON object | Optional. Defaults to “”. | – Takes input as key-value pairs in the form of property name and assigned value (Example: “version” : “5.0”) – System properties are not allowed (For example, system.xxx) – Auto properties are not allowed (For example, auto.xxx) – Reserved properties are not allowed (For example, predef.xxx) – Keys and values are stringsAll characters except , ; / * [ ] ? ‘ ” ` ## and newline are allowed – Spaces allowed except at start or end – Keys and values should not contain backslashes (\) – Null key and value are not allowed – Keys have 255-character limits; values have 24000-character limitsCase insensitive |
| dataSourceId | DataSource unique ID. Used only to match an existing DataSource. If no existing DataSource matches the provided ID, an error results. If this field is used in combination with the dataSource field, both the ID and name provided must match a single DataSource or an error results. | Integer | Either dataSourceId or dataSource is mandatory. | – 9-digit limit – Only positive whole numbers allowed |
| dataSource | DataSource unique name. Used to match an existing DataSource. If no existing DataSource matches the name provided here, a new DataSource is created with this name. If this field is used in combination with the dataSourceId field, both the ID and name provided must match a single DataSource or an error is returned. | String | Either dataSourceId or dataSource is mandatory. | – 64-character limit – Must be unique – All characters except , ; / * [ ] ? ‘ ” ` ## and newline are allowed – Spaces allowed except at start or end – Hyphen allowed only at the end; hyphen must be used with at least one other character |
| dataSourceDisplayName | DataSource display name. Only considered when creating a new DataSource. | String | Optional. Defaults to dataSource. | – 64-character limit – All characters except , ; / * [ ] ? ‘ ” ` ## and newline are allowed – Spaces are allowed except at start or end – Keys and values should not contain backslashes (\) – Hyphen allowed only at the end; hyphen must be used with at least one other character |
| dataSourceGroup | DataSource group name. Only considered when DataSource does not already belong to a group. Used to organize the DataSource within a DataSource group. If no existing DataSource group matches, a new group is created with this name and the DataSource is organized under the new group. | String | Optional. Defaults to “PushModules”. | – 128-character limit – Only supports characters from A-Z, a-z, 0-9, colon, hyphen, underscore, and whitespace – Values should not be null, empty, or having trailing spaces |
| instances | An array of DataSource instances. | JSON object | Required | |
| instanceName | Instance name. If no existing instance matches, a new instance is created with this name. | String | Required | – 255-character limit – All characters except , ; / * [ ] ? ‘ ” ` ## and newline are allowed – Spaces allowed except at start or end – Should not contain backslashes (\). – Only supports characters from A-Z, a-z, 0-9, colon, hyphen, underscore, and full stop – No whitespace allowed |
| instanceDisplayName | Instance display name. Only considered when creating a new instance. | String | Optional. Defaults to {instanceName}. | – 255-character limit – All characters except , ; / * [ ] ? ‘ ” ` ## and newline are allowed – Spaces allowed except at start or end – Should not contain backslashes (\).*<?,;`\\n characters not allowed |
| instanceProperties | New properties for instance. Updates to existing instance properties are not considered. Depending on the property name, we will convert these properties into system, auto, or custom properties. | JSON object | Optional. Defaults to “”. | – Takes input as key-value pairs in the form of property name and assigned value – System properties are not allowed (For example, system.xxx) – Auto properties are not allowed (For example, auto.xxx) – Reserved properties are not allowed (For example, predef.xxx) – Keys and values are stringsAll characters except , ; / * [ ] ? ‘ ” ` ## and newline are allowed – Spaces allowed except at start or end – Keys and values should not contain backslashes (\) – Keys have 255-character limits; values have 24000-character limits – Case insensitive – Keys and values should not be null, empty, or having trailing spaces |
| dataPointName | Datapoint name. If no existing datapoint matches for specified DataSource, a new datapoint is created with this name. | String | Required | – 128-character limit Characters from A-Z, a-z, and 0-9 only allowed – Should not contain reserved keywords such as COS, SIN, etc. |
| dataPointDescription | Datapoint description. Only considered when creating a new datapoint. | String | Optional. Defaults to {dataPointName}. | 1024-character limit |
| dataPointType | Metric type as a number in string format. Only considered when creating a new datapoint. | String | Optional. Defaults to “gauge”. | – Only values of “counter”, “derive”, or “gauge” accepted – Case insensitive |
| dataPointAggregationType | The aggregation interval is for one minute. The aggregation is calculated based on the aggregation type (sum/average/none/min/max) of the data occurring within a minute. For more information, see About the Push Metrics REST API. | String | Optional. Defaults to “none”. | – Only values of “min”, “max”, “none”, “avg”, “sum”, or “percentile” accepted – Case insensitive |
| percentileValue | If “percentile” is specified for dataPointAggregationType, this field is required for specifying the percent value to use. | Integer | Required when dataPointAggregationType is percentile | – Any whole number percentage between 0-100. Example: 99|95|90|70|50 (no default) |
| values | An array of datapoint values | JSON object | Required | –Takes input as key-value pairs in the form of epoch time and datapoint value. Example: “1584902069” : “10″ -Only long type values accepted in keys –Digits accepted in values or scientific notation Example:4.93e-2, 1.89502e202 |
Support for Ingesting Multiple Resources
The rest/v2/metric/ingest API allows the ingestion of multiple resources at a time in a single API call. The create and match type API parameters apply to all the multiple ingested resources.
Multiple Resource Payload Ingestion
[
    {
        single resource payload
    },
    {
        single resource payload
    }
]Multiple Resource Response
{
    "success": false,
    "message": "Some events were not accepted. See the 'errors' property for additional information.",
    "errors" : [
        {
            "code": <custom code>,
            "message": "The request has been accepted for processing, but the processing has not been completed.",
            "resourceIds": {
                "system.displayname": "test088"
            },
        },
        {
            "message": "Resource Name is mandatory.",
            "resourceIds": {
                "system.displayname": "test096"
        },
    }
}Example of Ingesting Metrics using Push Metrics REST API
The following Python 3 example monitors CPU utilization.
#!/usr/bin/env python3
import time, os, sys
import hmac, hashlib, base64
import requests
import json
import psutil

#--------------------------------------
# Constants - Do not change
#--------------------------------------
resource_path = '/metric/ingest'
headers =  {
	   'Content-Type': 'application/json'
	  }

#---------------------------------------
# Change Values below as per your setup
#---------------------------------------
def get_params():
	# Account info
	# Your account name
	Company = "ABC"
	# User account Access Id for which it must have permissions to manage resources and manage LogicModules
	AccessId = "6wDEvh73taGMPP43SSmF"
	AccessKey = 'Q)cfY2w8u[G97jkz5^P8{HT)g-uq[6+E8LL%Mb{^'

	url = "https://"+Company+".logicmonitor.com/rest"+ resource_path
	return url, AccessId, AccessKey


#--------------------------------------------
# Function to send metric data to LM Platform
#--------------------------------------------
def send_metrics(timestamp, body):
		url, AccessId, AccessKey  = get_params()
		req_var =  "POST" + str(timestamp) + body +resource_path;
		signature = base64.b64encode(bytes(hmac.new(
                            bytes(AccessKey, 'latin-1'),
                            bytes(req_var, 'latin-1'),
                            digestmod=hashlib.sha256
                        ).hexdigest(), 'latin-1')).decode('latin-1')
		auth = "LMv1 "+AccessId+ ":"+ signature+":"+str(timestamp)
		headers['Authorization'] =  auth
		try:
			response = requests.post(url, verify=True, headers=headers, data=body,  params={"create":'true'})
			if response.status_code != 202:
				print('Failed to send metric. Error:', response.status_code, response.text)
			else:
				print("SUCCESS :",response.text)
		except Exception as e:
			print("Unable to connect. Error: ", e)

#--------------------------------------------
# Prepare REST payload
#--------------------------------------------
def prepare_request_body(metric, timestamp, data_value):
	return json.dumps({
	    "resourceName": metric["device_name"],
	    "resourceIds": {
			"system.displayname": metric["device_name"],
			"system.ips": metric["device_ip"]
	    },
	    "dataSource": metric["data_source"],
	    "dataSourceDisplayName": metric["data_source"],
	    "instances": [
			{
				"instanceName": metric["instance"],
				"instanceDisplayName": metric["instance"],
				"instanceProperties": {
					"version": "1",
				},
				"dataPoints": [
					{
						"dataPointName": metric["data_point"],
						"dataPointType": "GAUGE",
						"dataPointAggregationType": "sum",
						"values": {
							str(timestamp//1000): data_value
						}
					},
		    	]
			},
	    ]
	}).replace("'", '"')


#------------------
#====  MAIN =======
#------------------
if __name__ == "__main__":
	my_metric = {}
	my_metric["device_name"] = os.uname()[1]
	my_metric["device_ip"] = "192.168.1.1"
	my_metric["data_source"] = "CPU"
	my_metric["instance"] = "cpu-1"
	my_metric["data_point"] = "cpu_utilization"
	while True:
		timestamp = int(time.time()*1000)
		data_value = psutil.cpu_percent()

		body = prepare_request_body(my_metric, timestamp, data_value)
		send_metrics(timestamp, body)
time.sleep(10)You can use the LogicMonitor Push Metrics REST API to programmatically push metrics for multiple instances associated with a single resource and DataSource. You can also manage some aspects of the associated resource and DataSource.
Base URL: https://{ACCOUNTNAME}.logicmonitor.com/rest
Where ACCOUNTNAME is replaced with your LogicMonitor account name.
Authentication
The Push Metrics REST API requires API token authentication. LogicMonitor REST API uses the same API token authentication. For more information, see Using LogicMonitor’s REST API.
Note: At a minimum, the role associated with the API-only user account must have permissions to manage resources and manage LogicModules. For more information on creating roles and API-only user accounts, see Roles and Users respectively.
Aggregation Interval
The Push Metrics REST API pushes datapoint metrics to instances once per minute. If data is sent frequently (sub-minute intervals), the values are cached, then aggregated using the aggregation method specified. The aggregated value is stored as the datapoint value.
LogicMonitor supports the following aggregation methods:
- Average
- Sum
- Min
- Max
- Percentile
- None (This is the latest value)
The behavior of each aggregation method when data is pushed at sub-minute intervals is exemplified in the following table.
| Sub-minute Collection Time/Data Set | Stored Value for Each Aggregation Method | |||||
| Average | Sum | Min | Max | Percentile | None | |
| 12:00:05 = 101 12:00:25 = 101 12:00:45 = 128 | 110 | 330 | 101 | 128 | Dependent on the percentileValue specified* | 128 |
| 12:01:05 = 125 12:01:25 = 107 12:01:45 = 101 | 111 | 333 | 101 | 125 | Dependent on the percentileValue specified* | 101 |
| 12:02:05 = 100 12:02:25 = 101 12:02:45 = 105 | 102 | 306 | 100 | 105 | Dependent on the percentileValue specified* | 105 |
For the gauge metric, these values will be stored as-is. For the counter metric, since it is calculating rate per second, the rate is based on the time difference between the prior and current timestamps.
The aggregation method is determined by the dataPointAggregationType field specified in the API request. For more information, see Ingesting Metrics with the Push Metrics REST API.
Metric data time limit can be up to ten minutes in the past to one minute in the future between the API caller and LogicMonitor. Data with timestamps outside this window are ignored. In addition, you cannot send data for an instance with a timestamp previous to any data already ingested by that instance.
Endpoints
The Push Metrics REST API consists of three endpoints:
- https://{ACCOUNTNAME}.logicmonitor.com/rest/metric/ingest. This endpoint ingests multiple metrics for multiple instances associated with a single resource and DataSource. See Ingesting Metrics with the Push Metrics REST API.
- https://{ACCOUNTNAME}.logicmonitor.com/rest/resource_property/ingest. This endpoint updates or adds new properties for existing resources. See Updating Resource Properties with the Push Metrics REST API.
- https://{ACCOUNTNAME}.logicmonitor.com/rest/instance_property/ingest. This endpoint updates or adds new properties for existing instances. See Updating Instance Properties with the Push Metrics REST API.
Status Codes
The status codes returned by the Push Metrics REST API are detailed in About REST API v2.
As computing architecture evolves into more ephemeral, transient, and stateless instances, the ability to bypass Collectors and push data directly to the LogicMonitor platform for ingestion is vital. A few prominent broad use cases for Push Metrics include:
- Serverless computing services monitoring. Serverless computing services such as AWS Lambda are well suited for the push model of data ingestion.
- Custom metric monitoring. The Push Metrics REST API can report the data from the application; without the need to define or configure external entities. The push Metrics REST API helps monitor health metrics in a DevOps environment (for example, CI/CD pipeline metrics, autoscaling application metrics, and so on) and business metrics such as the number of new orders.
- Transient resource monitoring. Many of today’s computing instances are transient (for example, containers, batch jobs, services running as a cluster, scripts, cron jobs, and so on). Instance locations, time to live (TTL), and other attributes are transactional. Typically, these instances are also stateless and do not have any historical information about themselves. Pulling data from these transient resources using traditional resource monitoring methods is a complex undertaking; pushing the data, on the other hand, is a very efficient monitoring model.
The following table lists some use case categories for the various types of metrics that you may want to send directly to LogicMonitor.
| Use Case | Metrics |
| Applications running on transient compute Container/VM supporting autoscaling | – Number of API calls served by an application running within the container From within the application running within a container, intercept the API calls and report periodically. – Resource utilization by application From within the application running within a container, intercept the API calls and report periodically |
| Custom business metrics Push business metrics for business service (running on multiple hosts/containers). Agnostic to the language of the business application. | – Number of new orders – Number of orders shipped – Purchase rate |
| IoT devices | – Temperature – Production count – Device availability |
| Serverless computing services AWS Lambda | – Number of times Lambda functions are invoked per minute From within the function that has been invoked, send the data on each invocation – Processing time/lifetime of Lambda instance Compute the time taken to serve the request and send it before terminating the called function |
| Synthetic monitoring | – Availability – Response – Errors |
| Ticket management systems Using Jira as an example, as tickets are created by various stakeholders, JIRA REST APIs can be used to collect custom data about the tickets which can then be sent to LogicMonitor. | – Number of new tickets – Number of tickets closed – Number of tickets created for priority stakeholders |
| Transient systems Lambda functions are invoked on events performed by AWS services such as S3, DynamoDB, Kinesis, SNS, and CloudWatch. Invocation is purely random and the code executed is stateless on each invocation; hence only instant data can be reported. | – Cron job Number of tasks processed – Script – Status of the script execution launched for either sending events, remote action, or creating tickets – Parse logs and send metrics – Script for OS monitoring of CPU usage, memory usage, disk I/O, network usage – Infrastructure in use by each container and overall across all containers – Use a PowerShell script or executable to collect the data and send it periodically to LogicMonitor – Exporter plug-in for OpenTelemetry, Nagios, or other technology could also be used |
| Web applications Gather business metrics on a separate thread and report the data to LogicMonitor via that thread. | – Number of website hits – Time taken to serve a request – Concurrent sessions |