IT Process Automation
Intelligent IT Process Automation
Save time, money, and resources with automation that acts like your best engineer. Programmatically eliminate redundant manual tasks with LogicMonitor.


IT Process Automation
Save time, money, and resources with automation that acts like your best engineer. Programmatically eliminate redundant manual tasks with LogicMonitor.
Simplify automation with built-in workflows, rapid setup, and AI-powered context.
Key Benefits:
90%
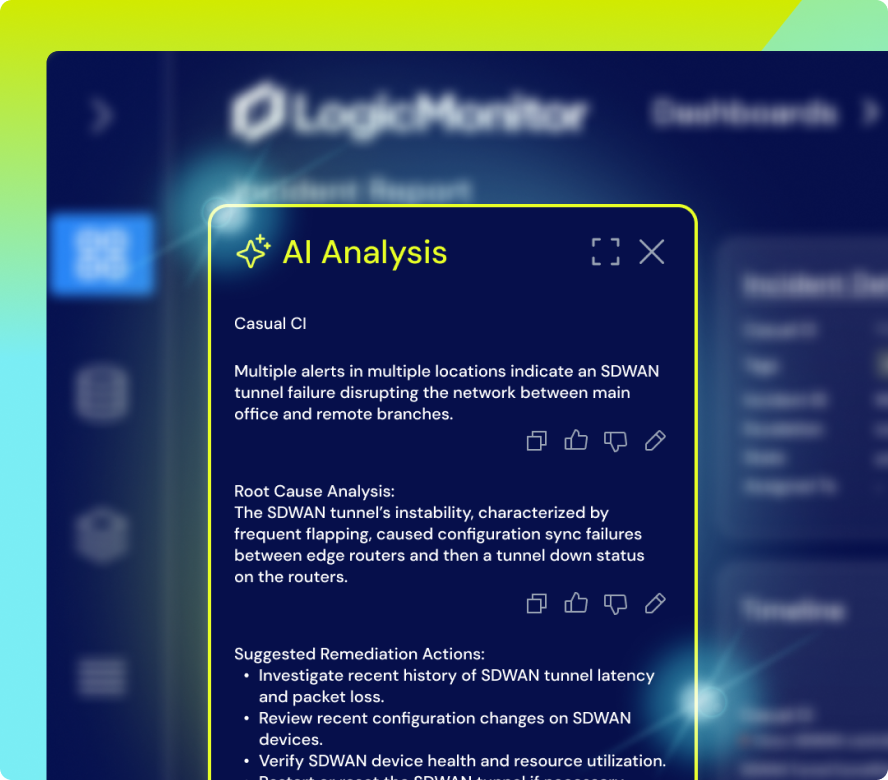
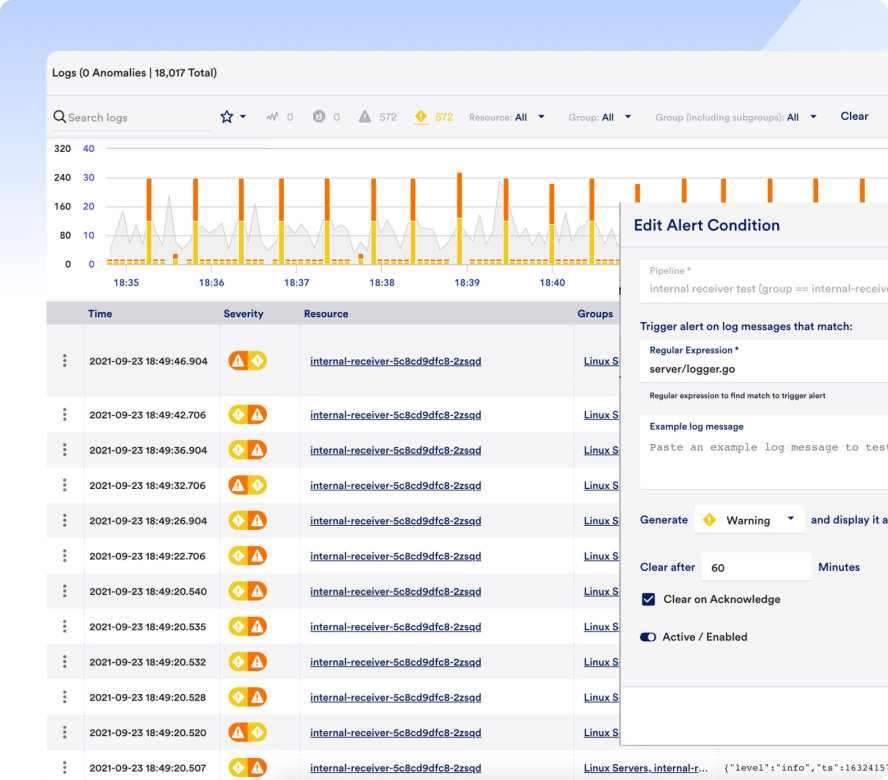
Less alert noiseLM Envision supports event-driven automation with always-on sensors and prebuilt rules like “is a collector down?” that are easy to customize. Alerts can automatically trigger actions — from running diagnostic scripts to rebooting servers and logging events for future analysis.
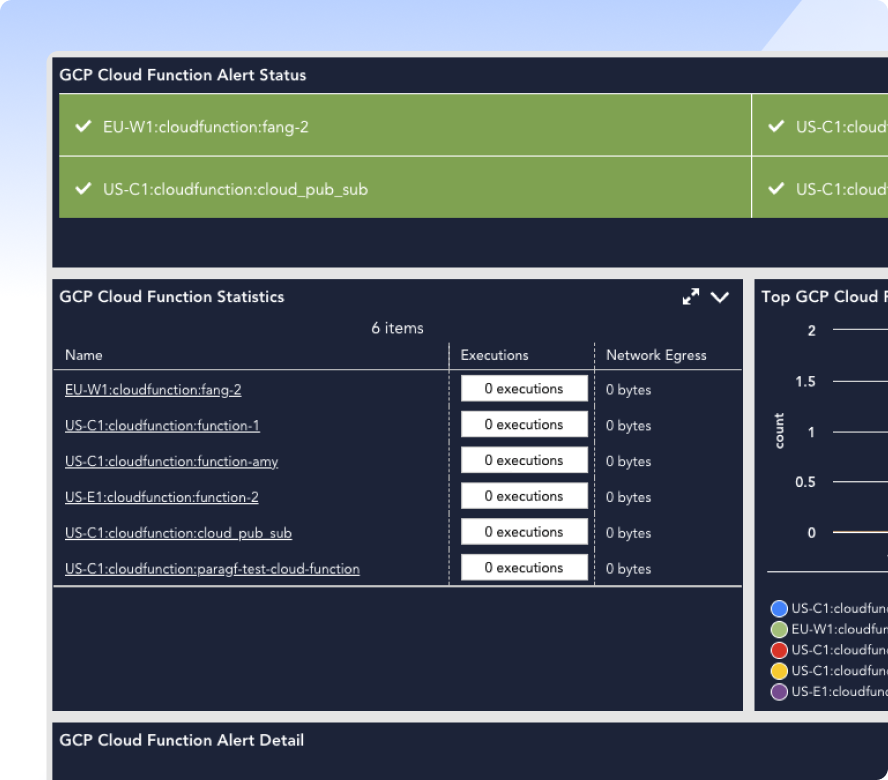
Whether deploying infrastructure as code or racking physical servers, automate monitoring setup from the start with LM Envision. Instead of repeating manual steps for every AWS instance or tech stack addition, trigger workflows that instantly handle everything — from group assignment to policy creation.
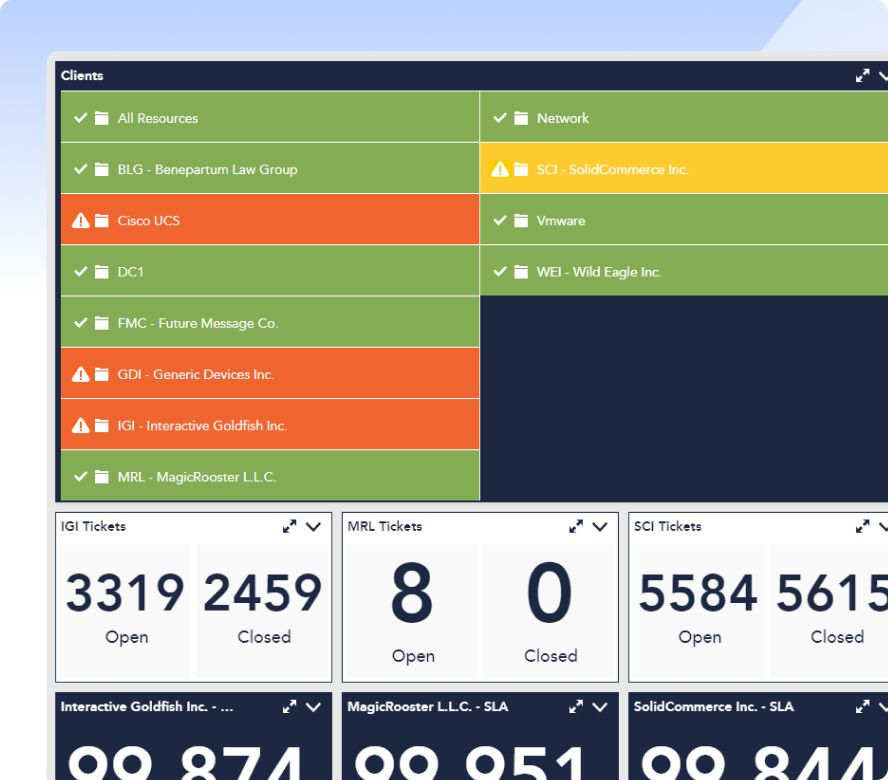
LM Envision streamlines multi-step onboarding processes — like provisioning Azure environments, spinning up VM instances, and configuring RBAC — into automated workflows. MSPs can eliminate hours of repetitive setup and focus more time on customizing and delivering value to each client.
LM Envision applies preconfigured templates from data sources using manufacturer and industry best practices — including suggested thresholds — so you can skip manual setup and get meaningful insights faster.

On-Demand Webinar
Join LogicMonitor experts for an in-depth look at how automation can help your ops team shift from reactive tasks to strategic innovation. Learn how to overcome common misconceptions and start automating with confidence.


GET ANSWERS
Get the answers to the top automation questions.
Although there are many processes that can be automated, not everything is the best candidate for automation. Only processes that are well defined, rule-based, and have a clear set of instructions are good candidates. Before considering automating a task, ask, “is this something that’s hard to explain?” If the answer is yes, automation may not be the right solution for the task.
Start small. Find redundant, repetitive tasks that are easy to learn.
Yes. All of LM Envision’s out-of-the-box tools allow you to automatically deploy a collector.
Yes, you can try us for free for 30 days. If you want, we’ll provide you with a free, personalized 30-minute onboarding call to get you up and running as soon as possible.
Automation capabilities are available with every LogicMonitor package. Learn more about our pricing by signing up to request a quote.
Request a quoteContact Us
Our experts are ready to help, whether you’re exploring AI-powered observability or are ready to optimize your hybrid environment.
RESOURCES
See only what you need, right when you need it. Immediate actionable alerts with our dynamic topology and out-of-the-box AIOps capabilities.