LogicMonitor’s CloudWatch Events integration enables you to minimize troubleshooting time by displaying contextual events for your monitored resources alongside performance data. Many routine events, such as deployments, resource provisioning and de-provisioning, or configuration changes, have the potential to impact resource performance. Without being able to see the event in the same context as the performance data, it can be challenging to correlate the two. LogicMonitor Ops Notes solve this issue by providing a visual eventstream, and enabling the display of events on top of performance data graphs.
Events can be especially relevant for cloud services, where traditional visibility into the underlying infrastructure is unavailable. AWS provides a variety of services, including CloudWatch Events, that provide users with information about the various events that occur for their cloud resources. With LogicMonitor’s ‘logicmonitor-send-cloudwatch-events’ function in the AWS Serverless Application Repository, you can configure CloudWatch Events to be added as Ops Notes in LogicMonitor.

LogicMonitor’s ‘logicmonitor-send-cloudwatch-events’ function in the AWS Serverless Application Repository
When you deploy the function, you can select which AWS services CloudWatch Events should be sent to LogicMonitor. The function will be triggered for events of selected services and uses LogicMonitor’s API to add Ops Notes for the monitored resources which relate to the events.
For example, you may find this useful for visualizing when EC2 instances are terminated and launched for your AutoScaling Group, in the context of the performance of that AutoScaling Group:

A graph of aggregate EC2 performance for an Auto-Scaling group, with an OpsNote displaying a new EC2 instance launch
The above graph displays aggregate network throughput across all EC2 instances in an AutoScaling Group, with an Ops Note indicating where a new instance was launched. The note only appears for the AutoScaling Group in which the new instance was launched, and displays all relevant launch details when selected. When the new instance was launched in AWS, the ‘logicmonitor-send-cloudwatch-events’ function was automatically triggered to identify the relevant AutoScaling Group in LogicMonitor and add the note. Such a note enables users to easily correlate how the addition or removal of an instance from an AutoScaling Group impacts the group’s overall performance.
Additional use cases include visualizing container state and task definition changes for ECS clusters alongside cluster performance, API requests via CloudTrail alongside performance metrics for particular services, bucket or object level operations alongside S3 performance, and more.
CloudWatch Events can help your team understand the cause of resource performance changes, and LogicMonitor’s Lambda function makes it easier than ever to connect the dots. For more information about the ‘logicmonitor-send-cloudwatch-events’ lambda function, including deployment instructions, see this page. Sign up for a free LogicMonitor trial today!
Applying consistent tags to your cloud resources can help improve the way you organize and manage your cloud environment. For example, tagging based on environment and application enables you to quickly identify all production resources supporting a specific application. Maybe you want to target automation processes at these resources or exclude them from a specific access role. Tags enable you to do that easily and manage your cloud environment in a way that makes sense for your business.
Currently, over 50% of the AWS, Azure and Google Cloud Platform (GCP) resources monitored across the LogicMonitor customer base are tagged. LogicMonitor automatically discovers these tags for all monitored cloud resources and adds them as properties, so customers can use them to group and visualize their monitored cloud resources. In addition to making cloud resource management and organization clearer, tags also help make monitoring cloud costs more meaningful.
Optimize cloud spend
Cloud services are dynamic, making it easy to scale infrastructure and applications quickly, but also pose a risk of racking up cloud costs equally quickly. One of the key components of LM Cloud, and an important factor in avoiding cloud sticker shock, is the ability to monitor cloud spend. Today’s cloud providers charge at a granular scale (down to the second in most cases) to account for the lifetime of ephemeral cloud resources. While this helps to ensure that customers are charged only for what they use, it also makes monitoring spend more complicated. One simple way to make monitoring cloud spend easier — and the analysis of cloud infrastructure costs more powerful — is to break it down based on tags. Tracking costs per tag allows you to attribute these costs to a function or specific area of your business, and determine where costs can be cut.
LogicMonitor includes the ability to monitor cloud spend and break it down by tags out of the box. Simply provide read-only credentials to your cloud environment and billing data (e.g. Azure AD application with read-only access to subscriptions), tell us which tag keys you’d like to see costs monitored for, and we’ll take it from there! All tag values will be automatically discovered for the specified key(s), and spend will be monitored for each. This enables you to specifically identify what’s costing the most in your cloud environment, and where spending can be optimized. For example, monitoring cost for an environment where resources are tagged by application would allow you to identify and pinpoint the applications you’re spending the most to run.

Azure spend monitored per application, where resources are tagged by application.
Increase visibility with tags
In addition to identifying top costs, monitoring spend by tag allows you to attribute trends and changes in cost to something specific. For example, the following graph shows spend roughly doubling for a specific application between August and September:

AWS spend monitoring for a specific reporting application, where resources are tagged by application.
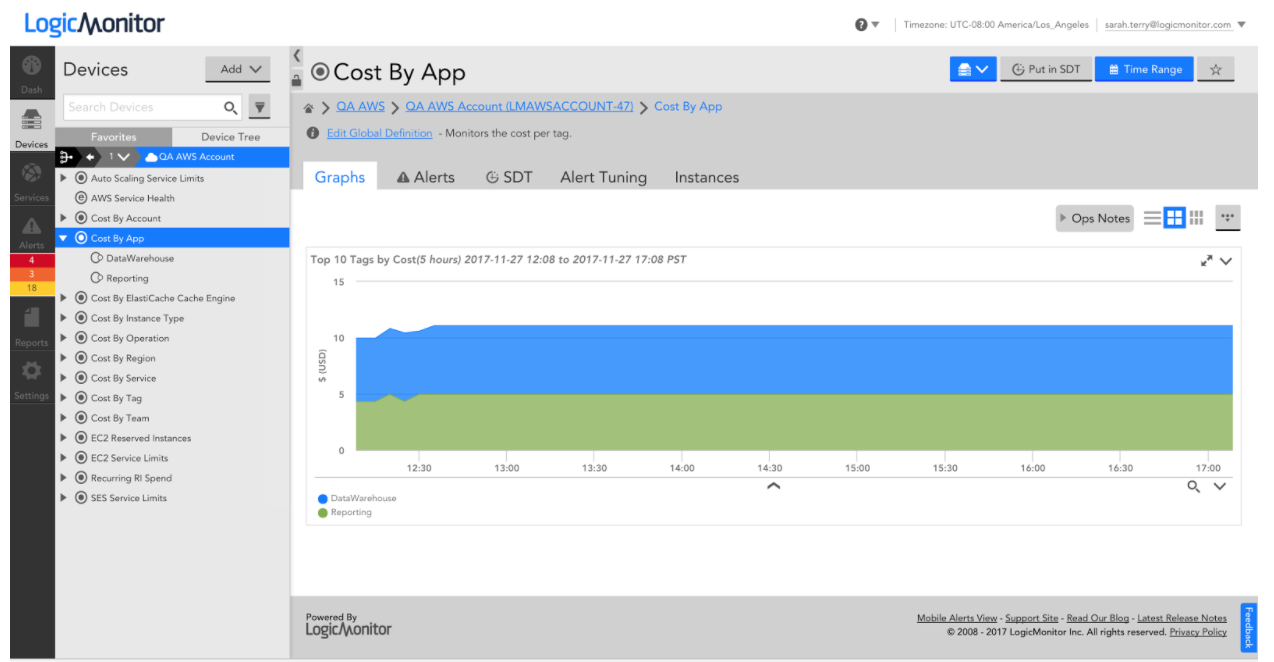
Absorbed into a larger bill, this jump in spending may have been difficult to explain. Displaying costs by application tag clearly shows that this increase of about $10K is attributed to a specific reporting application shown here (in green):

AWS spend monitored per application, where resources are tagged by application (reporting application in green).
You may be able to recover some of these costs by sizing the instances underlying the reporting application differently, or you may also want to look into whether there’s an issue with the application itself. At this point, analyzing monitored infrastructure alongside monitored spend helps you further identify opportunities to control cloud costs.
For our reporting application, the change in cost is due to a significant increase in the number of EC2 instances running the application. This is clear when looking at the monitored instance count alongside the application cost for the same two-month time frame:

A graph displaying EC2 Instance count over time.
Identify optimizations with LogicMonitor
Similar to how tags can be used to improve cloud environment management and organization, they can also be used to effectively monitor cloud costs and optimize spending. A monitoring tool capable of monitoring these cloud costs and presenting spend per tag can help pinpoint where you’re spending the most and where there’s an opportunity to optimize. Monitoring infrastructure and application performance data and presenting it alongside cloud costs helps identify whether those optimizations should be made for the application itself or for the resources that support the application. With LogicMonitor you can do it all out of the box.
If you’re already a customer, we can help you get tags set up quickly. If you aren’t, and you want to see dynamic cloud monitoring and cost management in action, start a free trial today.
Click* Click* Scroll* Click*
That sound is the bane of my existence. That sound – the sound of commands being typed and buttons being clicked – signified how we handled many aspects of our technical operations work a few years ago. Manually…
Click*
Back when we had a smaller cloud infrastructure, EC2 hosts, roles/policies, DNS records, etc. were all created manually. As our cloud presence grew, we developed a few in-house solutions to help manage the creation of new resources. This approach became difficult to manage as our server count rose and infrastructure complexity grew. At that point, our EC2 Management Console looked like a scene from a Mad Max movie. In order to efficiently build, scale, and manage our infrastructure, we adopted HashiCorp’s Terraform.
Why Terraform
Terraform is an open source orchestration tool for provisioning, managing, and versioning cloud infrastructure. Terraform uses a configuration file as a blueprint of the desired infrastructure state, and changes the target environment by updating or creating resources to match the defined state. Having a defined outline of your datacenter and following this “infrastructure as code” model allows for repeatable automation.
We were in the process of moving LogicMonitor’s main application towards a service oriented architecture. Terraform gave us the ability to abstract different pieces of our infrastructure configurations into archivable, version controlled code. As Terraform became our go-to tool for managing our cloud infrastructure, another problem arose… how were we going to get all these newly provisioned items into our monitoring solution?
Click*
I think every great Ops tool is the offspring of momentary brilliance and just pure, unwavering laziness. That is how the LogicMonitor Terraform Provider came to be. As we started to move away from a single monolithic application, we had to provision more instances and utilize other services in Amazon Web Services to match the increased complexity of our infrastructure. The LogicMonitor Terraform Provider saves our operations team time and occasional carpal tunnel by automatically adding and managing these new resources within our monitoring solution.
Getting Started
For those new to Terraform, I recommend reading the official Terraform Getting Started documentation. This article does a good job of introducing the application and its various elements (i.e. resources, variables, dependencies etc). In the following few examples I’ll show you how to use the LogicMonitor Terraform Provider to add devices and device groups into LogicMonitor. We will also combine elements in Terraform to create a real world example of how to implement the LogicMonitor provider in conjunction to other resources.
First we need to authenticate (grab a set of API credentials within LogicMonitor). One way is to initialize within the logicmonitor provider block.
    provider "logicmonitor" {
      api_id  = "${var.logicmonitor_api_id}"
      api_key = "${var.logicmonitor_api_key}"
      company = "${var.logicmonitor_company}"
    }
The other is setting the credentials through the provider’s supported environment variables.
    export LM_API_ID=xyz
    export LM_API_KEY=xyz
    export LM_COMPANY=xyz
To simply create a device group resource into LogicMonitor, create a file main.tf with the contents:
    resource "logicmonitor_device_group" "group1" {
      name = "NewGroup"
      properties {
        "snmp.community" = "xxxxx"
        "system.categories" = "a,b,c,d"
        "jmx.port" = "9003"
      }
    }
A terraform apply will create a new device group named “NewGroup” with set properties for “snmp.community”, “system.categories”, and “jmx.port”.
    logicmonitor_device_group.group1: Creating...
      disable_alerting:             "" => "true"
      name:                         "" => "NewGroup"
      properties.%:                 "0" => "3"
      properties.jmx.port:          "" => "9003"
      properties.snmp.community:    "" => "xxxxx"
      properties.system.categories: "" => "a,b,c,d"
    logicmonitor_device_group.group1: Creation complete (ID: 779)

The terraform apply run earlier created a terraform.tfstate file locally. This file will be used by Terraform to compare resources defined in your template to the actual state of your infrastructure. This includes the configuration of these resources within LogicMonitor. If a device is deleted or group properties are updated within LogicMonitor, the next terraform apply will configure your LogicMonitor account to match the local state file. This state file should be kept remotely when collaborating with teammates to avoid multiple contributors using their own local saved state file.
Terraform Data Sources
Terraform Data Sources allow data to be fetched so that it can be used elsewhere in other pieces of terraform configurations. For example, in the LogicMonitor Terraform Provider, we currently do not provision Collector resources but users can use Terrafrom data sources to define which existing Collector to associate a device to (note that a device must be associated to a Collector). The Collector data source looks up active Collectors based on date of creation or by filtered name/description. Device group data sources can also be used to filter for specific groups that match a name or custom properties.
Here is an example of adding a device using the data sources to look up a specific device group and Collector:
    data "logicmonitor_collectors" "collectors" {
      most_recent = true
    }
    resource "logicmonitor_device" "host" {
      ip_addr          = "10.32.12.18"
      disable_alerting = true
      collector        = "${data.logicmonitor_findcollectors.collectors.id}"
      hostgroup_id     = "${data.logicmonitor_devicegroup.devicegroups.id}"
      properties {
       "app" = "haproxy"
       "system.categories" = "a,b,c,d"
      }
    }

    data "logicmonitor_device_group" "devicegroups" {
      filters {
        "property" = "name"
        "operator" = "~"
        "value"    = "Mesos"
      },
    }
Using The LogicMonitor Provider with other providers
The power of Terraform really shines when using resources in conjunction with each other. For example, the snippet below shows how to use the Terraform AWS Provider alongside the LogicMonitor Provider.
    data "logicmonitor_collectors" "collectors" {
      most_recent = true
    }
    resource "aws_instance" "instance1" {
      ami           = "${var.ami}"
      instance_type = "${var.instance_type}"
      ....
    }

    resource "logicmonitor_device" "newdevice" {
      ip_addr   = "${aws_instance.instance1.*.private_ip}"
      collector = "${data.logicmonitor_collectors.collectors.id}"
    }
The resource aws_instance will provision an AWS Instance with a configured ami and instance type. The aws_instance.instance1.*.private_ip is a computed attribute as it is created by AWS. This attribute is the generated output of a resource which then can be used as an input for other resources. Since Terraform orders resource creation based on the references created in the main.tf file, Terraform will not add the ec2 instance into LogicMonitor as a device until that instance is created and the IP is known.
Click*
The LogicMonitor Terraform Provider can be found on Terraform’s Github Account. It is being actively developed and we encourage and appreciate feedback and pull requests. You can start automating the creation of your cloud infrastructure with Terraform, and if you are a LogicMonitor customer and are tired of clicking on that “Add Device” button, or “Manage Host Groups” … or even “Submit”…
You only have 1 more click to go
Unless… you are not a customer… then you have two clicks
The LogicMonitor provider is under active development. We encourage you to contribute!
AWS Direct Connect provides a dedicated network connection between on-premisess and AWS environments. Such a connection can be more reliable and increase the uptime of your services because you’re unlikely to be impacted by an ISP’s availability issues, as is the case with traditional, internet-based connections. With our most recent release, Direct Connect connections can be automatically discovered and monitored in LogicMonitor.

Direct Connect throughput performance graphs in LogicMonitor.
If you’re already using LogicMonitor for AWS monitoring, you just need to select Direct Connect for monitoring via the Manage dialog for your AWS group:

Current users select “Direct Connect” in Manage dialog to start monitoring.
If you’re not yet monitoring your AWS environment, simply provide LogicMonitor with read only access to your AWS environment and Direct Connect will be pre-selected for monitoring, among the other AWS services LogicMonitor supports. From there, connections, metadata such as the bandwidth, id, name and state, as well as CloudWatch data will appear in LogicMonitor after a few minutes:

Connections, metadata and CloudWatch data displayed in LogicMonitor
The following connection performance CloudWatch metrics are collected by a LogicMonitor maintained Collector, so there are no installations needed to start monitoring:

CloudWatch connection performance metrics automatically collected and displayed by LogicMonitor
Our Monitoring Team sets alert thresholds on the above metrics and configures default graphs to be displayed, so you get actionable data out of the box. You can additionally configure meaningful dashboards specific to your environment and/or team. Here’s a dashboard we created to visualize the performance across our different connections:

LogicMonitor dashboard showing performance across multiple connections.
Interested in seeing this dashboard in your own account? Download the JSON and import it with these instructions.
With the vast number of AWS services and the various ways for which they are billed, cost monitoring and optimization can be complex. Ensuring that your team has the utilization, performance, and spend data necessary to drive cost optimization in the cloud is important, and typically requires multiple tools.
We recently announced new LM Cloud monitoring for AWS Billing that makes cost analysis and optimization simpler. While we’ve monitored AWS billing data for a long time via the AWS Detailed Billing Report, the new monitoring, based on AWS Cost & Usage Reports, is more dynamic and comprehensive. The new Cost & Usage Report-based billing monitoring is intended to provide the actionable data you need to confidently scale your AWS cloud environment. We’re releasing a new set of DataSources that, out-of-the-box, track spend by region, service, account and operation. You can customize this further by enabling monitoring of costs associated with tagged resources.

LogicMonitor graph displaying cost breakdown of teams with highest spend in AWS
With the upcoming retirement of their Detailed Billing Report, AWS recommends the Cost & Usage Report for a granular breakdown of spend. LogicMonitor dynamically identifies account IDs, Regions, AWS Services, and line item operations from the Cost & Usage Report data, and the cost associated with each is monitored. This enables you to track cost per account for consolidated billing setups, cost by region and service, and additionally allows you to see what operations (across services) you’re spending the most on. New region or service announced by AWS? New account added to your consolidated billing setup? No problem- because services, regions, and accounts are dynamically identified, they will be added into monitoring automatically.

LogicMonitor graph showing most expensive operations being run in AWS account
It’s easy to additionally enable monitoring by tag – simply add an instance in LogicMonitor specifying the tag name and value. Tag resources by team or application to get insight into how much you’re spending across teams or critical applications, and where you can optimize costs.
LogicMonitor graph displaying cost of apps running in the cloud
With performance and spend data in a single platform, and LogicMonitor’s powerful dashboarding capabilities, you can visualize everything in a single pane of glass. We created the following dashboard for a bird’s eye view of our AWS spend:

LogicMonitor executive overview dashboard displaying a bird’s eye view of AWS spend
Want to see this dashboard in your own account? Import this JSON template. From reserved instance usage to the number of healthy hosts behind your Elastic Load Balancer to the trend of your monthly bill by account, LogicMonitor allows you to see it all. At AWS re:Invent this week?
LogicMonitor’s new AWS Billing Monitoring is now live in all accounts! Customers can learn more about how to get started here. New to LogicMonitor? Sign up for a free trial!
Amazon Web Services are great for quickly enabling agile infrastructure – but this can lead to difficulty with cost control or predictability. Unfortunately, monitoring of AWS resources can exacerbate this problem of unpredictable costs, as the very act of querying AWS data can be more expensive than the cost of the monitoring service.
Any AWS monitoring tool worth its salt will pull in data via the CloudWatch API, because for certain resources, it is the only data available. However, AWS charges for requests to this API, which means that AWS monitoring will come with associated CloudWatch costs – and the API costs alone can be expensive if you don’t pay attention to how your monitoring is done.
To avoid blowing your budget on CloudWatch costs alone, it is important to ensure that your monitoring tool requests CloudWatch data as efficiently as possible. Similarly, you should make sure that your monitoring tool gives you the flexibility to adjust how CloudWatch data is requested, so that you have the option of optimizing it for your environment. With LogicMonitor, Collector-based monitoring and flexible polling intervals make it easy to minimize your CloudWatch costs while still maximizing the value of your monitored data.
AWS requests to the CloudWatch API are restricted to one request per metric. This means that ultimately, CloudWatch cost for monitoring is directly proportional to the number of metrics monitored. Each AWS Service exposes a different number of metrics via the CloudWatch API, so the cost will vary across these services. For example, Elasticsearch publishes 12 metrics to CloudWatch by default, while Lambda only publishes 4. Assuming the same request frequency, this makes Elasticsearch 3 times as expensive to monitor as Lambda, if you monitor all the metrics possible.
CloudWatch cost is also directly proportional to the frequency of requests. While requesting more data at less frequent intervals is possible, it can prevent real time alert evaluation, reducing the value of the monitored data. Based on their purpose, certain services warrant more frequent data collection, like ELB, while longer collection intervals are acceptable for other services, like S3. LogicMonitor’s AWS DataSources have default collection intervals set with this in mind.
Given that CloudWatch API requests cost $.01 per 1000 requests, we can actually calculate the prices for different services, based on the datapoints and collection intervals in the default LogicMonitor AWS Datasources. To illustrate the point, here are the three most and least expensive services to monitor, respectively:
Top three:
ElastiCache: $10.35 per Memcached cluster/ 30 days, $9.50 per Redis cluster/ 30 days
RDS: $6.90 per RDS instance/ 30 days
Auto Scaling (aggregate & group metrics): $6.50 per Auto Scaling group/ 30 days
Bottom three:
Lambda: $.35 per Lambda function/ 30 days
SNS: $.34 per SNS topic/ 30 days
S3: $.02 per S3 bucket/ 30 days
Given the above information, here is how LogicMonitor can help you get the most bang for your buck:
- Use a LogicMonitor Collector to monitor EC2 instances instead of using EC2 metrics exposed via CloudWatch. LogicMonitor’s server Datasources provide more depth than CloudWatch does for EC2 instances. Here’s a side-by-side comparison of an EC2 instance monitored via Collector (right) and monitored via CloudWatch (left):

The default AWS_EC2 Datasource that collects metrics once every five minutes only costs about $1/ 30 days for each EC2 instance. If you have detailed metrics enabled, you may have adjusted your AWS_EC2 CloudWatch Datasource to collect as frequently as once per minute, which costs about $4.75/ 30 days for each EC2 instance. With hundreds or thousands of instances, this can add up. We recommend disabling the AWS_EC2 Datasource if you already have a Collector installed in your AWS environment, which will save you money without having to sacrifice monitored metrics. If you have custom CloudWatch metrics, consider creating a separate CloudWatch Datasource to capture those. - Use a LogicMonitor Collector to monitor RDS instances in favor of the RDS metrics exposed via CloudWatch. This is similar to recommendation one. With the exception of Aurora RDS instances, LogicMonitor Collector metrics offer more comprehensive database performance and health metrics than those CloudWatch reports for RDS. Because RDS instances are ultimately running on a server maintained by AWS, CloudWatch also reports memory and storage metrics for RDS. As there is no direct access to the server, you can only get these memory and storage metrics via CloudWatch. The database performance and health metrics, however, can be monitored via LogicMonitor Collector DataSources. The default AWS_RDS DataSource collects metrics every minute, and with around 16 datapoints this will cost you almost $7/month per RDS instances. If you have a LogicMonitor Collector in your AWS environment, we recommend only relying on the AWS_RDS DataSource for underlying server metrics like memory and storage, and using our MySQL, Microsoft SQL Server & PostgreSQL DataSources for database performance and health metrics.
- Increase polling intervals where possible. There may be some resources that don’t need one minute granularity. For example, you don’t need as much granularity for Dev and QA environments as you would your production resources. You can set the polling interval at the global level in the DataSource definition, but you can also customize it for specific groups and/or devices with a custom property. E.g. this specific group has a 5 minute polling interval for all AWS_ELB metrics, which overrides the polling interval set in the AWS_ELB DataSource definition:

- Trim datapoints where possible. You can utilize LogicMonitor’s Complex datapoints to get rates and other calculations based on CloudWatch data. You don’t have to pay for Complex datapoints, because they don’t involve requests to CloudWatch. This means that you should establish all rates and calculations as Complex datapoints, instead of pulling them directly from CloudWatch. We do this where possible with our default AWS DataSources, but it is especially important to consider for custom metrics. There also may be cases where certain datapoints reported by CloudWatch aren’t valuable for some resources. For example, maybe you don’t need to know latency for your Dev / QA resources. In that case, you can clone the DataSource and have a Dev / QA version that only has a subset of the original datapoints, like this:


In addition to optimizing your AWS monitoring to minimize your bill, we recommend that you monitor AWS billing data itself in LogicMonitor. You should use the AWS billing per region, service and tag Datasources in LogicMonitor, and set thresholds for billing metrics such that you will receive alerts for excessive and/or unusual billing values. Consider setting up a dashboard or report that you can review on a daily or weekly basis. This will enable you to react to and better manage your CloudWatch expenses, so you ensure that you’re minimizing your spend while maintaining the value of monitored performance data for your AWS environment.

While retrieving data from CloudWatch for alerting and long term trends is great – make sure your monitoring tool doesn’t eat your whole cloud budget with unnecessary API calls!
Most people think of Datasources as the bread and butter of LogicMonitor’s monitoring capabilities. Datasources are the most commonly used LogicModule because they are appropriate for monitoring numerical data; they provide a trend of the data over time (which can provide invaluable context when troubleshooting) and are compatible with most monitoring protocols. That being said, LogicMonitor’s Eventsource monitoring shouldn’t be undervalued.
Eventsources can be used to alert on asynchronous messages received or gathered by your collector, and can report textual data. Datasources, in contrast, cause the collector to poll data to determine when an alert should be triggered, and are limited to numerical data. Typically, Eventsource monitoring is used for Windows Event Log and Syslog monitoring. However, we recently introduced a new script Eventsource collection method that makes it possible to monitor almost any event. We decided to use it to monitor Amazon Web Services (AWS) Service Statuses.
LogicMonitor’s AWS Monitoring utilizes the CloudWatch API to gather CloudWatch metrics and the AWS SDK to collect metrics that aren’t reported by CloudWatch. Both mechanisms rely on the AWS Service functioning properly. If AWS has an issue and your EC2 instances aren’t available, we aren’t going to be able to monitor them. So how do you know if a reported issue is coming from within your infrastructure or AWS’s? Cue the aforementioned Eventsource.
We wrote a script Eventsource that parses the AWS Status RSS Feed and triggers a LogicMonitor alert when AWS reports an issue. Each Eventsource alert includes the time the post was made to the RSS feed, the message posted and the link to the post. With this Eventsource, we can quickly reference whether or not AWS is having issues when our monitored AWS resources are in alert.
For example, during AWS’s recent service disruption in the Sydney Region, we saw servers in one Sydney availability zone become unavailable. The following graph shows the CPU graph lines for two Sydney EC2 servers disappearing, and the other server CPU increasing to pick up the extra load:

Without additional context, it was easy to assume the issue was in our environment. However, during the same time period we saw an AWS Service Health alert for the region:

The plethora of connectivity issues reported for AWS’s AP-Southeast-2 region hinted that the issue was actually with AWS itself. Sure enough, further investigation showed us that AWS was experiencing a service disruption. We probably could have reached this conclusion without the AWS Service Health alert, but it certainly enabled us to identify the issue more quickly.
Let’s say that you aren’t interested in receiving notifications for ALL of the AWS Services or Regions. Simply add filters to the Eventsource to filter out the alerts for the services and regions you don’t care about:

Alternatively, if you only care about a few services and/or regions, you can add filters to filter out everything except for the alerts you want:

We could have used a Datasource to monitor this AWS status information, but because the monitored data would need to be numerical, we would not have the ability to provide a contextual message with each non-healthy status. Additionally, we don’t really care when AWS is functioning properly. Eventsource monitoring only alerts us when something isn’t right, and we really only want to know when AWS isn’t working properly.
The AWS Service Health Eventsource is available now in our core repository. After importing the Eventsource (Settings | Eventsources | Add | From LogicMonitor Repository), you’ll need to edit the Applies To field such that the Eventsource applies to a device in your account. To get the most complete picture possible, we recommend adding status.aws.amazon.com as a monitored device, and applying the Eventsource to that device. Alternatively, the Eventsource can be applied to any other device in your environment.
I recently wrote a blog introducing the concept of monitoring Elasticsearch with LogicMonitor. With the growing popularity of Elasticsearch, particularly the full ELK stack (Elasticsearch, Logstash, Kibana), Amazon Web Services (AWS) released their Elasticsearch service in late 2015. For those wanting to focus more on their data and less on managing Elasticsearch clusters, Amazon’s Elasticsearch is a great alternative. However, the new service does have limitations with respect to node level access and API capabilities. Yet with LogicMonitor’s powerful Active Discovery process, it is easy to monitor Amazon’s Elasticsearch in spite of these limitations.
One of AWS’s key goals with their services is to shield the user from the many inner complexities that make up the specific offering (networking, nodes, operating systems) and provide the user with an endpoint that can be used to interface with their application.
In the case of AWS’s Elasticsearch, only the application level API is available via HTTP, and this comes with limitations. For example, many API endpoints are not available, particularly those that effect settings on the backend at a lower level, such as shard allocation. This is due to the fact that the service handles such details, allowing the user to focus on their data.
Another limitation of Elasticsearch is node level access. Direct network connectivity to individual nodes that make up an AWS Elasticsearch service cluster (domain) is nonexistent, which makes monitoring the cluster at the node level challenging. This is where the beauty of LogicMonitor’s Active Discovery steps in – if we use the /_cat/nodes API to view the nodes of a AWS cluster, we see the following:

As you can see, hostnames and IP addresses are not exposed and even if they were, direct access would not be available. But by using Active Discovery, LogicMonitor can discover these individual nodes as instances within the cluster, similar to how we could discover individual disks or volumes on a server. And by using the cool Marvel comic names that Elasticsearch automatically assigns to nodes as the identifier, LogicMonitor can discover these instances and begin collecting metrics using the /_nodes API:

In addition to cluster-level statistics that are available via the /_cluster/stats API, we now have visibility at the node level to determine if one of our individual nodes is, for example, running out of heap space or spending too much time in garbage collection.
Another great feature of Amazon’s Elasticsearch is its ability to reconfigure a cluster on the fly. If a cluster that is already in production is running low on memory, it can be reconfigured to use larger instances without interruption in service. This reconfiguration is achieved by transparently spinning up new instances, adding them to the cluster, relocating all index shards to the new instances, and finally dropping the original instances from the cluster.
Since we’re using Active Discovery, we can see this process in action. Below is an image visualizing a cluster in the process of being reconfigured. In the first two graphs, we see the heap for the individual nodes and overall cluster heap. In the case of the individual node graph, we can see the exact point where the new nodes join the cluster and shard relocation occurs. And since both sets of nodes are members of the cluster while data is being transferred, we can see an increase in the overall cluster heap.


Finally, this image below shows the heap drop when the shard relocation process is complete and the original nodes drop from the cluster.

This is just another example illustrating the power of LogicMonitor Active Discovery, and how it can be utilized to gain critical insight at the application level.
What is the process for monitoring custom metrics on your AWS EC2 (Amazon Elastic Cloud Compute) Linux instances? The easy way is to use a LogicMonitor collector to monitor your Linux servers, which will provide much more detail and metrics than AWS monitoring provides. Using a collector means its easy to write your own datasources to extend what is collected, using all sorts of mechanisms (JMX, snmp, WMI, database queries, JSON or other HTTP output, etc.) – although you probably won’t need to.
However, if you don’t want the complete suite of LogicMonitor monitoring on your devices, and just want the cloudwatch metrics to show in LogicMonitor, LogicMonitor’s AWS integration will automatically pull in all the standard Cloudwatch metrics. But if you want to extend the Cloudwatch metrics – we’re going to use custom EC2 Linux memory metrics as an example (one of the standard metrics the Collector would get automatically for you) – and pull them into LogicMonitor, this step by step guide will show you how to do it.
As background, the default metrics for each of your EC2 instances are comprised of CPU, Disk, Network and Status. AWS provides the option, for a price, to add custom EC2 metrics to CloudWatch. This requires some configuration on the EC2 instance, within AWS itself, and through adding new datapoints to the existing EC2 datasource in your LogicMonitor portal. If you add AWS tags to your EC2 instances that are defined as Linux, it will make it easier to apply multiple EC2 instances to the new datasource that will be created.
To note, this blog post assumes you have taken the time to set tags. For this example we have used the AWS tag, “system.aws.tag.OS,” and set it to “Linux”. Check out this AWS article to learn how to setup the custom metrics for memory on the AWS EC2 Linux, and verify that the new custom metrics are visible within cloudwatch (illustrated in the image below).

Step 1: Setup Your AWS Account in LogicMonitor
- LogicMonitor’s AWS monitoring requires an AWS Account and Read Only user to get started.
Step 2: Clone the AWS EC2 Datasource in LogicMonitor (see image below)
- In Settings → LogicModules → Datasources, type “EC2” in the search.
- Select the AWS_EC2 datasource and hit the clone button at the bottom of the page.
- Name the new datasource to “AWS_EC2_Memory_Linux”.
- Change the Displayed as name to “EC2 Custom”.
- Set the Applies to field to match our tag that we set in AWS for Linux systems (in this case: “Linux”).
- You can now select a datapoint toward the bottom of the new datasource and clone it.


Step 3: Clone the CPU Utilization Datapoint and Change the Metric Path and Name (see image below)
- Clone it for each new memory metric: MemoryAvailable, MemoryUsed and MemoryUtilization.
- Change the metric paths in each of the new datapoints to match the new names:
- System/Linux>InstanceId:##system.aws.resourceid##>MemoryAvailable
- System/Linux>InstanceId:##system.aws.resourceid##>MemoryUsed
- System/Linux>InstanceId:##system.aws.resourceid##>MemoryUtilization
- Set the Alert Threshold in the data point via the dropdown to “No Threshold”.
- Update the Description and save the new datapoint.

Step 4: Add a New Graph for Memory to the Datasource Showing New Values and Existing Graphs (see image below)
- In the datasource, click the “Add Graph” button and name the new graph “Memory” (also make sure the graph name field specifically is set as “Memory”).
- Set the label name to “Memory Stats”.
- Add each of the datapoints and lines to the graph.
- Save the datasource.

Step 5: Selecting EC2 Custom Instance in Devices Tab (see images below)
- Go to the devices tab and while selecting the name of one of the Linux AWS EC2 instances, click the manage button and run active discovery – you should now see a new EC2 Custom instance.
- Select the EC2 Custom instance and look in the raw data tab to see the new memory fields (illustrated in the first image below).
- Then, select the graph tab to see the new Memory graph (illustrated in the second image below). To note, the Memory graph will take some time to populate.


That’s it, enjoy your new EC2 memory custom metrics in LogicMonitor!
AWS is great, for reasons everyone knows. The ability to spin up instances and services immediately, just when you need them, can make your organization more agile and responsive. However, with many people and departments able to provision services – it’s easy to lose track of them, and leave resources running long after they are needed. Not only does this increase the complexity of the environment, it also wastes money.
LogicMonitor’s AWS monitoring can help with controlling AWS costs, by identifying resources that are unused, or over-provisioned. And because LogicMonitor can show you these systems across all regions, and even across multiple AWS accounts (for example, combining views of both production and development AWS accounts, if they are separated), it is easy to identify the most wasteful resources first – no matter where they are. We went through this practice here at LogicMonitor, and thought it was worth sharing what we did and how we did it. At LogicMonitor, we found several unused EC2 instances, in different regions; a software bug in our code that was failing to remove unused DynamoDB tables, and several other cases where we were leaving money on the table. (Or rather, giving it to Amazon.)
We started by creating a new dashboard, which we called “AWS Under-utilized resources.” (Of course, a prerequisite of all the below is that you are using LogicMonitor’s AWS monitoring to get detailed metrics on all your AWS resources.)
We then added a variety of Advanced Custom Graph widgets, showing the least utilized resources of different types. We’ll walk through a few examples.
EC2 Instances
In the case of EC2 instances, AWS does not charge for stopped instances – so we want to filter them out of the view. The easiest way to do this is to create a dynamic device group that contains all non-stopped instances. Simply make a new group, set it to auto-assign devices, and set the query to hasCategory(“AWS/EC2”) && system.aws.stateName != “stopped”


This will collect all the non-stopped EC2 instances in one group, that you can then use as the source of the custom graph. To do so, go to your AWS resource dashboard, select Add Advanced Custom Graph Widget, give it a title (“Idle EC2 resources”); set the default time range to 1 month; the Y Axis to “% idle”; and add a datapoint. For the first datapoint, select the dynamic group you made above as the group source; set device to “*”, to select all members of that group; device datasource to AWS_EC2; instance to “*”; datapoint to CPUUtilization, and select Limit Results to top 10.
Now add another datapoint, but this time select Virtual Datapoint, name it IdlePercent; and set the expression to 100-CPUUtilization, like the below:
Now we just need to add the IdlePercent datapoint to the graph line to be displayed. This will show the top 10 instances, sorted by how idle they are. Given we are only looking at the same datasource for all these devices, we can change the default legend to just ##HOSTNAME##.
Save this widget, and you get a graph like this:
There are many machines that are generally not used much (which may be good targets for shifting to smaller, cheaper instance types). But you can see that the machine docker.AP-NE1 has been running at zero load for the last month – and a quick investigation with our TechOps team revealed it was a machine no longer in use, that they’d piloted some docker containers on, but after the pilot was moved to production, this particular machine was never terminated.
DynamoDB
Amazon charges for the provisioned capacity of DynamoDB tables, regardless of whether that capacity is being taken advantage of, or needed. So it is a good idea to have another Advanced Custom graph widget showing how much of your capacity, that you are paying for, you are actually using.
There are two views that are useful here. You want one graph showing the percentage of unused read (or write) provisioned capacity, and another showing the number of overprovisioned read (or write) capacity units.
The first view will show you tables that are not being used at all, and can be easily constructed with a custom graph widget like the below (make sure to set the CapacityUsagePercent to a Top 10 view):
In the case of our internal systems, the above graph configuration showed 10 dynamoDB tables, all with 100% unused provisioned read capacity:
LogicMonitor uses dynamic DynamoDB tables for storing Netflow data – and it turned out we had a bug in the code that was supposed to delete DynamoDB tables, so they weren’t always being cleaned up. Another case where we would have kept wasting money if not for the monitoring.
Another useful view of DynamoDB provisioned capacity is to view it in terms of Capacity Units, not percentage.
A configuration like the below shows the top 10 tables by wasted capacity units (again, ensure you set the CapacityUsagePercent datapoint to a top 10 view):
This takes the unused capacity as a percentage for a table, and weights it by the provisioned units, to give the idle capacity in terms of units. And lets you investigate the provisioning of the tables that are costing the most.
In our case, this view wasn’t as informative:
It showed that even among these tables that have the highest level of unused capacity, they were all using that capacity to a significant level during some short periods – so the dynamic capacity adjustment we use seems to be working correctly.
It’s easy to repeat these types of custom graphs for other AWS resource types. And you can identify which services to target by looking at the C0stByService graphs for your account in LogicMonitor, for a quick view of where your money is going. (At LogicMonitor, we also found many unused and no longer needed EBS volumes from this technique.)
Let us know if you have any other cost saving tips for AWS.