Azure Backup is a cloud-based backup service that enables you to effectively protect data. With Azure Backup, data for different Azure cloud and on-premises components can be backed up, stored in a cost-efficient manner, and recovered as needed. At LogicMonitor, we commonly get asked about monitoring these backup services. Monitoring backup processes and services can help ensure that the right resources are being backed up at the right intervals, which is necessary to enable successful disaster recovery. We recently rolled out initial monitoring for Azure Backup, starting with monitoring for Virtual Machine (VM) backups specifically. This means that you can now monitor Azure VM backups in LogicMonitor, alongside the rest of your monitored hybrid infrastructure!
To get started, simply add your Azure environment into monitoring and import our newest DataSource for monitoring VM backups. Alongside monitored performance and availability metrics for each VM, you’ll see monitored backup data for any VM that is being backed up:

To achieve this, LogicMonitor is populating properties that indicate whether a VM is backed up:

For VMs that are backed up, LogicMonitor is pulling data from the Azure Backup REST API to monitor the time since last backup, as well as backup, health and protection statuses. Default alert thresholds are configured such that alerts will trigger out of the box for failed backups and other undesirable statuses.
Among the metrics monitored, we recommend paying close attention to the following three:
- Backup status: Monitoring the status of the backup allows you to quickly identify failed backups. Possible statuses are completed, in progress, and failed. LogicMonitor has default alert thresholds configured to alert you when VM backups have a failed status.
- Health status: The health status enables you to identify when a backup isn’t in good health. Possible values are passed, action required, action suggested, and invalid. Monitoring the health status of the backup is a good way to alert on situations where the backup job was successful, but the resulting backup is not usable. LogicMonitor has default alert thresholds configured to alert you when VM backups aren’t in good health.
- Hours since last backup: While monitoring the backup status may enable you to quickly identify failed backups, monitoring time since the last backup enables you to alert on multiple failed backups. For example, if the backup frequency is daily, you may want to receive a critical alert when a VM hasn’t been backed up twice in a row, or for 48 hours.
Why is it important to monitor Azure VM backups again?
Azure VM backups are important because they help to protect your data from loss or corruption. If your VM is lost or corrupted, you can restore it from a backup. This can save you a lot of time and money, as you will not have to recreate your data from scratch.
First, you need to make sure that your backups are working properly. If your backups are not working, you will not be able to restore your data if it is lost or corrupted. Second, you need to make sure that your backups are up-to-date. If your backups are not up-to-date, you may not be able to restore your data to the point in time that you need it. Third, you need to make sure that your backups are secure. If your backups are not secure, they may be accessed by unauthorized users.
It’s important to monitor your Azure VM backups on a regular basis to ensure that your data is protected and that you are able to restore it if it is lost or corrupted.
Here are some of the potential consequences of not monitoring Azure VM backups:
- Data loss. If your VM is lost or corrupted, and you do not have a backup, you will lose your data. This could be a major setback for your business.
- Financial loss. If you lose data, you may have to spend time and money recreating it. This could be a significant financial loss.
- Reputational damage. If you lose data, your reputation could be damaged. This could lead to customers losing trust in your business.
Types of Azure VM backups
Azure VM backup by using VM extension
This is the default backup method for Azure VMs. It uses a backup extension that is installed on the VM to create backups. The backups are stored in Azure Blob Storage.
The benefits of this method are that it is easy to set up and manage, and it provides point-in-time recovery. The drawbacks are that it can be resource-intensive, and it does not support granular recovery.
Azure VM backup by using the Azure Backup Server
This method uses the Azure Backup Server to create backups of Azure VMs. The backups are stored in Azure Blob Storage or on a local disk.
The benefits of this method are that it is more efficient than the VM extension method, and it supports granular recovery. The drawbacks are that it is more complex to set up and manage, and it requires an additional license.
Azure VM backup by using System Center Data Protection Manager (DPM)
This method uses DPM to create backups of Azure VMs. The backups are stored on a local disk or in a DPM server.
The benefits of this method are that it is a comprehensive backup solution that can be used to protect both on-premises and Azure workloads. The drawbacks are that it is complex to set up and manage, and it requires an additional license.
Azure VM backup by using Azure Site Recovery
This method uses Azure Site Recovery to create backups of Azure VMs. The backups are stored in Azure Site Recovery vault.
The benefits of this method are that it provides disaster recovery for Azure VMs. The drawbacks are that it is complex to set up and manage, and it requires an additional license.
It is important to choose the right type of Azure VM backup for your needs. The type of backup you choose will depend on your specific requirements, such as the amount of data you need to protect, the level of recovery you need, and your budget.
Conclusion
With LogicMonitor’s new monitoring for Azure Backups, you can monitor the status of your Azure VM backups VM performance metrics in a single view. Of course, LogicMonitor also enables you to monitor the rest of your cloud and on-premisess infrastructure, so you can get a comprehensive understanding of your entire distributed hybrid environment, all with a single tool. Sign up for a free trial today!
With Azure Virtual Machine (VM) Scale Sets you can automatically scale the number of VMs running an application based on the compute resources required. VM Scale Sets make it easier to deploy and manage a large number of Virtual Machines consistently and allow you to use and pay for the minimum resources needed at any given time, but they also introduce a few monitoring challenges. VMs are automatically created and terminated as needed based on pre-configured criteria, which can make it challenging to keep monitoring up to date. Additionally, applications usually run across multiple VMs in a VM Scale Set. Combined with the frequent creation and termination of VMs, this can make it difficult to get a consistent view of application performance over time. To achieve comprehensive visibility, your monitoring tool should include automated resource discovery, meaningful metrics for Azure VMs and any running applications, and the ability to aggregate data across VMs in a VM Scale Set.
Automate resource discovery
You may choose, for example, for the number of VMs in a VM Scale Set to be auto-scaled based on CPU usage. As the CPU usage for the VMs in the set reaches a pre-configured threshold, new VMs are added. Similarly, as CPU usage for the VMs falls below a pre-configured threshold, existing VMs in the set are terminated. To maintain comprehensive visibility into your applications and underlying VMs, it’s important that new VMs are added into monitoring in a timely manner after creation, and that terminated VMs are removed from monitoring to avoid clutter. Without an automated solution, it can be challenging to keep monitoring up to date. You should use a monitoring tool with dynamic discovery that adds and removes these VMs to and from monitoring automatically. LogicMonitor uses the Azure Resource Manager APIs to automatically discover new VMs and add them into monitoring, as well as to identify terminated VMs and remove them from monitoring. Data collection and alerting starts immediately once a VM is added into monitoring, ensuring instant visibility.
Monitor meaningful metrics for VM Scale Sets

Some VM metrics are available via Azure Monitor – these basic metrics include CPU usage, bytes received and sent on network interfaces, and disk read/write operations. What these metrics don’t include are operating system (OS) level metrics like disk usage and memory usage, as well as application-specific performance metrics. You can extend Azure to collect the OS level metrics by enabling the monitoring diagnostics extension, or you can use a monitoring tool that uses an agent or collector to make queries to the VMs to get OS and application-specific metrics, typically in addition to the basic metrics available via Azure Monitor. An agent-based approach may require custom automation to ensure that an agent is installed on every VM that is created in the VM Scale Set, and that agent versions remain consistent and up to date, while an agentless solution such as the LogicMonitor Collector can be installed anywhere (including outside of the VM Scale Set) and just needs to be able to make requests to the VMs in the set. The LogicMonitor Collector relies on traditional protocols such as SNMP, WMI, HTTP, and JDBC to collect the basic CPU and network interface metrics you’d get from Azure Monitor, as well as the OS level metrics such as disk usage and memory usage, and performance metrics for any running applications. This approach will provide you with more comprehensive monitoring for each of the VMs running in your VM Scale Set.
Aggregate data across VMs
A monitoring solution with automated discovery can help ensure that what’s in monitoring reflects the VMs in your VM Scale Set at any given time, but it’s also important to ensure that you have a consistent view into application performance, regardless of changes to what VMs are running in the VM Scale Set. Terminated VMs may be removed from monitoring when they no longer exist, but retaining the performance data for the applications running on those VMs is critical to understanding how the applications are performing over time. Such an understanding can help you identify how releases and other changes impact application performance. By aggregating data across VMs in a VM Scale Set, you’ll get visibility into overall application performance, and how that performance is changing over time. With LogicMonitor’s LM Service Insight, you can dynamically group together monitored resources, such as VMs in a VM Scale Set, into a logical service. Key performance indicators can be aggregated across grouped resources to obtain insight into the performance of the overall application. For example, you might group together VMs that belong to a common VM Scale Set ‘prodScaleSet’ like so:
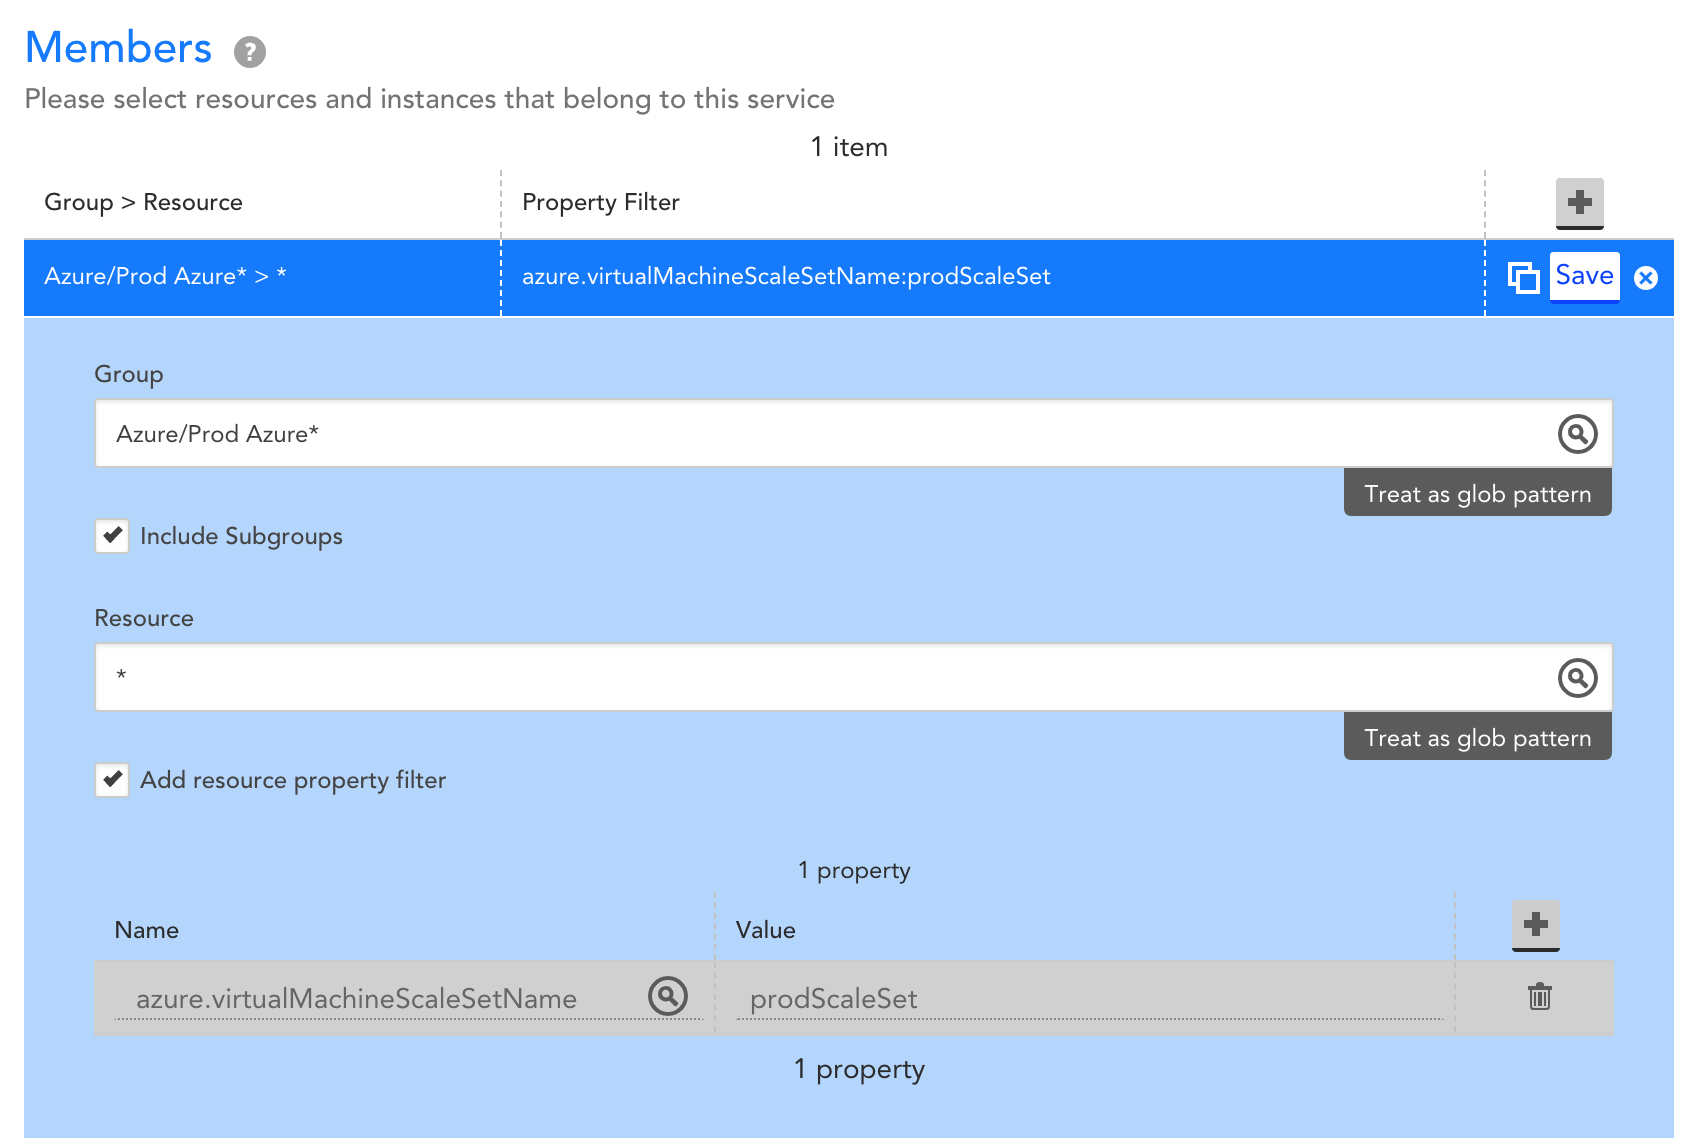
Let’s say the VMs in this Scale Set are supporting a web application, and running Apache web servers and MySQL databases. You may choose to aggregate performance metrics across the VMs like this:

The resulting service will provide you with visibility into the aggregate performance of the web application. As VMs are created and terminated within the VM Scale Set, LogicMonitor will automatically add and remove VMs as needed, the VMs that data is aggregated across will be automatically updated, and you’ll retain this consistent visibility into overall performance:

This means that performance data will persist as VMs in the Scale Set change, and you’ll be able to correlate releases and configuration changes with trends in application performance over time.
Additionally, you can configure alerts on this aggregate performance data, such that triggered alerts reflect your overall web application health and performance. This means that an individual VM alert that does not impact the overall web application’s performan
ce can be distinguished from a VM alert that does impact overall application performance. With LM Service Insight, a status page is created based on alert thresholds set for aggregate data, enabling you to see overall application alert status alongside alerts for the underlying VMs:

In summary, to comprehensively monitor Azure VM Scale Sets, you need a monitoring tool that has comprehensive VM monitoring, automated resource discovery that will keep monitoring up to date, and the ability to monitor and alert on data aggregated across your VMs. LogicMonitor does this all out of the box- sign up for a free trial today!
Applying consistent tags to your cloud resources can help improve the way you organize and manage your cloud environment. For example, tagging based on environment and application enables you to quickly identify all production resources supporting a specific application. Maybe you want to target automation processes at these resources or exclude them from a specific access role. Tags enable you to do that easily and manage your cloud environment in a way that makes sense for your business.
Currently, over 50% of the AWS, Azure and Google Cloud Platform (GCP) resources monitored across the LogicMonitor customer base are tagged. LogicMonitor automatically discovers these tags for all monitored cloud resources and adds them as properties, so customers can use them to group and visualize their monitored cloud resources. In addition to making cloud resource management and organization clearer, tags also help make monitoring cloud costs more meaningful.
Optimize cloud spend
Cloud services are dynamic, making it easy to scale infrastructure and applications quickly, but also pose a risk of racking up cloud costs equally quickly. One of the key components of LM Cloud, and an important factor in avoiding cloud sticker shock, is the ability to monitor cloud spend. Today’s cloud providers charge at a granular scale (down to the second in most cases) to account for the lifetime of ephemeral cloud resources. While this helps to ensure that customers are charged only for what they use, it also makes monitoring spend more complicated. One simple way to make monitoring cloud spend easier — and the analysis of cloud infrastructure costs more powerful — is to break it down based on tags. Tracking costs per tag allows you to attribute these costs to a function or specific area of your business, and determine where costs can be cut.
LogicMonitor includes the ability to monitor cloud spend and break it down by tags out of the box. Simply provide read-only credentials to your cloud environment and billing data (e.g. Azure AD application with read-only access to subscriptions), tell us which tag keys you’d like to see costs monitored for, and we’ll take it from there! All tag values will be automatically discovered for the specified key(s), and spend will be monitored for each. This enables you to specifically identify what’s costing the most in your cloud environment, and where spending can be optimized. For example, monitoring cost for an environment where resources are tagged by application would allow you to identify and pinpoint the applications you’re spending the most to run.

Azure spend monitored per application, where resources are tagged by application.
Increase visibility with tags
In addition to identifying top costs, monitoring spend by tag allows you to attribute trends and changes in cost to something specific. For example, the following graph shows spend roughly doubling for a specific application between August and September:

AWS spend monitoring for a specific reporting application, where resources are tagged by application.
Absorbed into a larger bill, this jump in spending may have been difficult to explain. Displaying costs by application tag clearly shows that this increase of about $10K is attributed to a specific reporting application shown here (in green):

AWS spend monitored per application, where resources are tagged by application (reporting application in green).
You may be able to recover some of these costs by sizing the instances underlying the reporting application differently, or you may also want to look into whether there’s an issue with the application itself. At this point, analyzing monitored infrastructure alongside monitored spend helps you further identify opportunities to control cloud costs.
For our reporting application, the change in cost is due to a significant increase in the number of EC2 instances running the application. This is clear when looking at the monitored instance count alongside the application cost for the same two-month time frame:

A graph displaying EC2 Instance count over time.
Identify optimizations with LogicMonitor
Similar to how tags can be used to improve cloud environment management and organization, they can also be used to effectively monitor cloud costs and optimize spending. A monitoring tool capable of monitoring these cloud costs and presenting spend per tag can help pinpoint where you’re spending the most and where there’s an opportunity to optimize. Monitoring infrastructure and application performance data and presenting it alongside cloud costs helps identify whether those optimizations should be made for the application itself or for the resources that support the application. With LogicMonitor you can do it all out of the box.
If you’re already a customer, we can help you get tags set up quickly. If you aren’t, and you want to see dynamic cloud monitoring and cost management in action, start a free trial today.