by Sarah Terry, Senior Director of Product Management & Beth Winters, Senior Product Marketing Manager
At LogicMonitor, we are deeply committed to a mission that goes beyond the conventional: revolutionizing IT monitoring through hybrid observability powered by AI. This ambition is not merely a slogan but the cornerstone of our entire approach. Our LM Envision platform was purposely designed to bring together diverse IT environments under one seamless, integrated experience.
Enterprises have complex IT ecosystems. By delivering comprehensive visibility into your IT infrastructure—whether it’s on-premise, hybrid, or cloud-based— we help organizations streamline operations, minimize expenses, and grow with confidence.
LogicMonitor’s hybrid observability approach empowers IT and CloudOps teams through relentless focus on our three pillars of innovation:
- Layered Intelligence in every aspect of our platform
- Delivering a Unified Experience
- Extensive Hybrid Coverage
Our latest features support these pillars by helping organizations deliver high service availability, reduce the time required to solve problems, and identify root causes faster.
Interested in learning more? Join us for the accompanying Winter Release webinar, titled “Unleashing Hybrid Observability: LogicMonitor’s Latest Product Innovations.” This will take place on Tuesday, February 27th at 11 am PST, where our product team will demo the new capabilities described below!
Modern IT Operations Observability Challenges
In the rapidly evolving digital landscape, modern IT teams face a multifaceted set of challenges that test their agility, efficiency, and innovation. These challenges, while distinct, are deeply interconnected, impacting the ability of organizations to maintain a competitive edge and operational excellence. Here, we delve into the core issues confronting today’s IT operations teams and explore strategic approaches to overcome them.
High Complexity
- Modern IT environments blend legacy systems, cloud platforms, and new technologies, creating significant complexity. This mix, alongside rapid application and infrastructure growth, challenges visibility and control.
- A widening skills gap, due to rapid tech advancement exceeding the supply of skilled professionals, further complicates efficient IT ecosystem management.
Addressing these issues requires robust observability solutions and a strategic focus on workforce development.
Efficient Operations
- The spread of IT assets across various domains leads to governance, cost, and focus challenges, a situation worsened by a traditional, reactive approach to incident management.
- IT teams under pressure to achieve more with less need solutions that automate tasks, optimize resource management, and improve incident response times.
Adopting such technologies allows a shift from reactive to strategic operations, boosting service levels and operational flexibility.
Speed of Innovation
- Aligning IT more closely with business goals is crucial for fostering service agility and innovation.
- Challenges like cloud migration and overcoming the perception of IT as an innovation barrier necessitate reevaluating IT’s organizational role.
- Embracing agile methodologies, continuous delivery, and a culture of experimentation and quick iteration are key.
By positioning IT as a strategic business asset, organizations can create an environment that supports and drives growth and transformation.
Why LM Envision
Our LM Envision platform integrates AI-driven insights, automation, and cloud-native capabilities to streamline and simplify IT operations. This enables IT businesses to effectively tame complexity, boost operational efficiency, and foster innovation at an accelerated pace.
We want to transform IT teams from a support role into a key driver of business success. This will empower them to not only anticipate and respond to current demands but also to shape future technological landscapes.
What’s New in Layered Intelligence
LM Co-Pilot (Preview)
LogicMonitor’s new Generative AI tool, LM Co-Pilot, revolutionizes account setup and day-to-day administration. With its interactive dialogue and real-time assistance, it accelerates processes, reduces errors, and enhances the user experience. By simplifying manual multi-step workflows and multi-page administrative tasks (like adding devices or new users) into a curated, chat-like experience, LM Co-Pilot frees up IT teams to work on more engaging tasks.

Currently, LM Co-Pilot is only available in preview mode. If you want to participate in our Controlled Availability program, please contact your LogicMonitor account representative.
Stay tuned in the coming months as we roll out new LM Co-Pilot capabilities, including Support, which will leverage Natural Language Processing (NLP) to summarize documentation and answer queries about LM Envision features, and Troubleshooting, which will automate workflows for rapid troubleshooting and resolution of complex hybrid infrastructure issues.
Log Analysis (Preview)
When troubleshooting business-impacting events in a hybrid environment, users typically need complex queries to scan logs across the different services, applications, and resource types (e.g., network devices, load balancers, databases, and cloud resources). This time-consuming process usually requires deep domain knowledge.

Log Analysis simplifies troubleshooting by quickly surfacing contextually relevant logs through advanced ML techniques and visual filtering. Log Analysis automatically analyzes and categorizes log messages, providing sentiment scores based on log level, keywords, negative phrases, and custom dimensions. This helps users quickly detect the severity of log messages and prioritize the key phrases that apply to their most pressing issues.
Now, time-consuming work such as determining severity and finding relevant logs is handled by LogicMonitor’s AI, which enables operations and support teams to be more effective when solving problems.

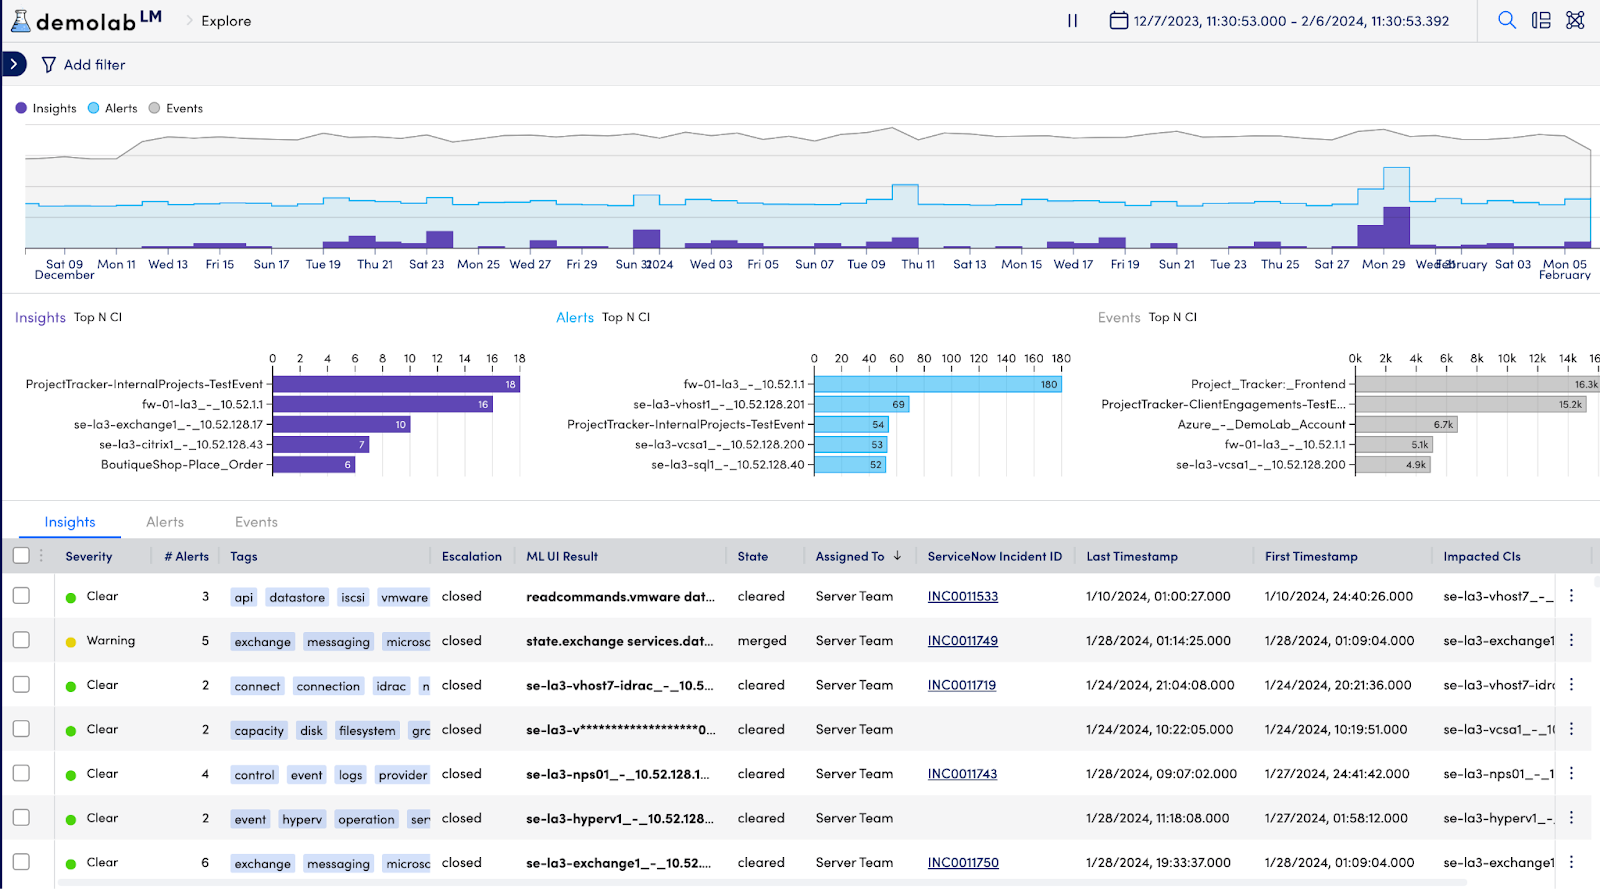
Edwin AI
Edwin AI puts AI to work and supercharges IT productivity by automating alert correlation, contextualization, prioritization, and incident management, all personalized to a business’s unique needs. Edwin AI extracts the richest, most relevant context from LogicMonitor and ServiceNow CMDB for a highly accurate and customizable correlation.
Let’s say a core switch link has gone down due to a config issue in your campus, generating an alert storm with hundreds of access points and switches being impacted. Edwin AI will combine the context of devices as switches, APs, and campus location from LogicMonitor to help correlate this storm of alerts into a single actionable insight. Edwin AI automatically summarizes all the underlying events for the level one NoC engineers in the ServiceNow ticket.
By combining natural language processing and unsupervised machine learning, Edwin AI cuts through the noise to elevate the most important issues. As a result, IT and CloudOps teams can diagnose problems faster, reduce MTTR, increase efficiency, and prevent problems from exploding into costly downtime and business-critical incidents. Dexda acts as a single source of truth across your entire environment, optimizing incident response and accelerating MTTR.
Unlike other solutions, Edwin AI uses open and customizable Machine Learning models, offering personalized IT at scale. Essentially, it’s like having an extra ITOps engineer on your team!
Ready to gain better context into issues you’re already collecting with LogicMonitor’s personalized approach to AIOps? Reach out to your LogicMonitor account representative, or email us at [email protected] to get started with Edwin AI today!
What’s new in Unified Experience
New User Interface (GA)
Introduced over the summer, our new user interface (now GA) has a more modern look and feel. It demonstrates LogicMonitor’s mission of creating an industry-leading Unified Experience across all IT environments: hybrid, cloud, and on-prem.
This quarter, we’ve added a new log dashboard widget that displays logs for a single resource or group of resources. Thus making it easier than ever to share aggregated log information with stakeholders for faster troubleshooting.
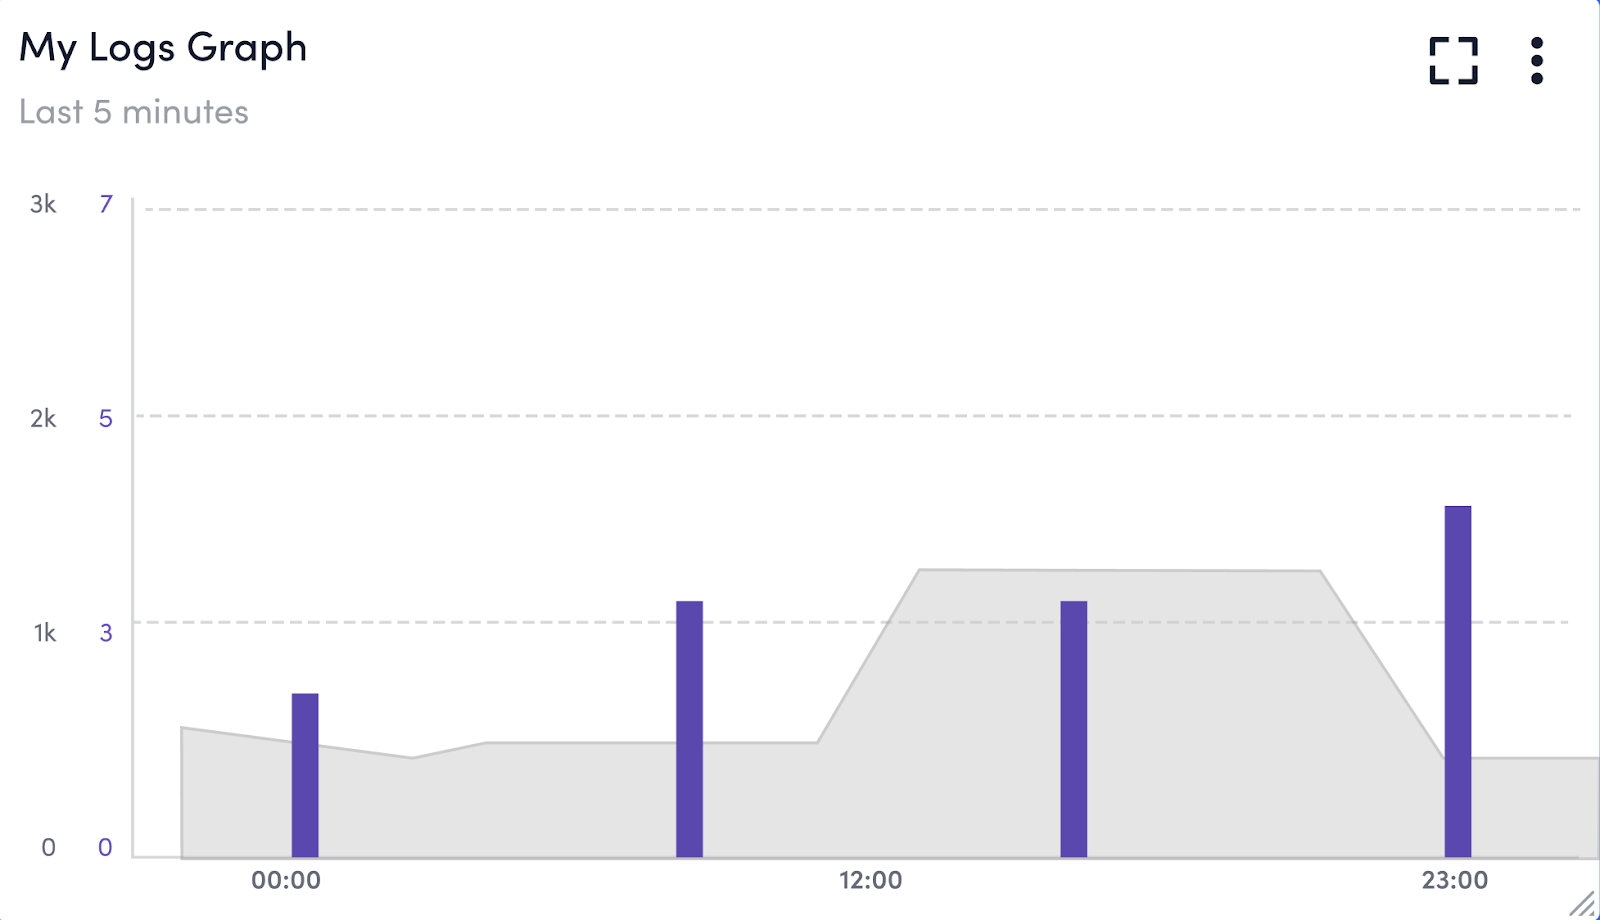
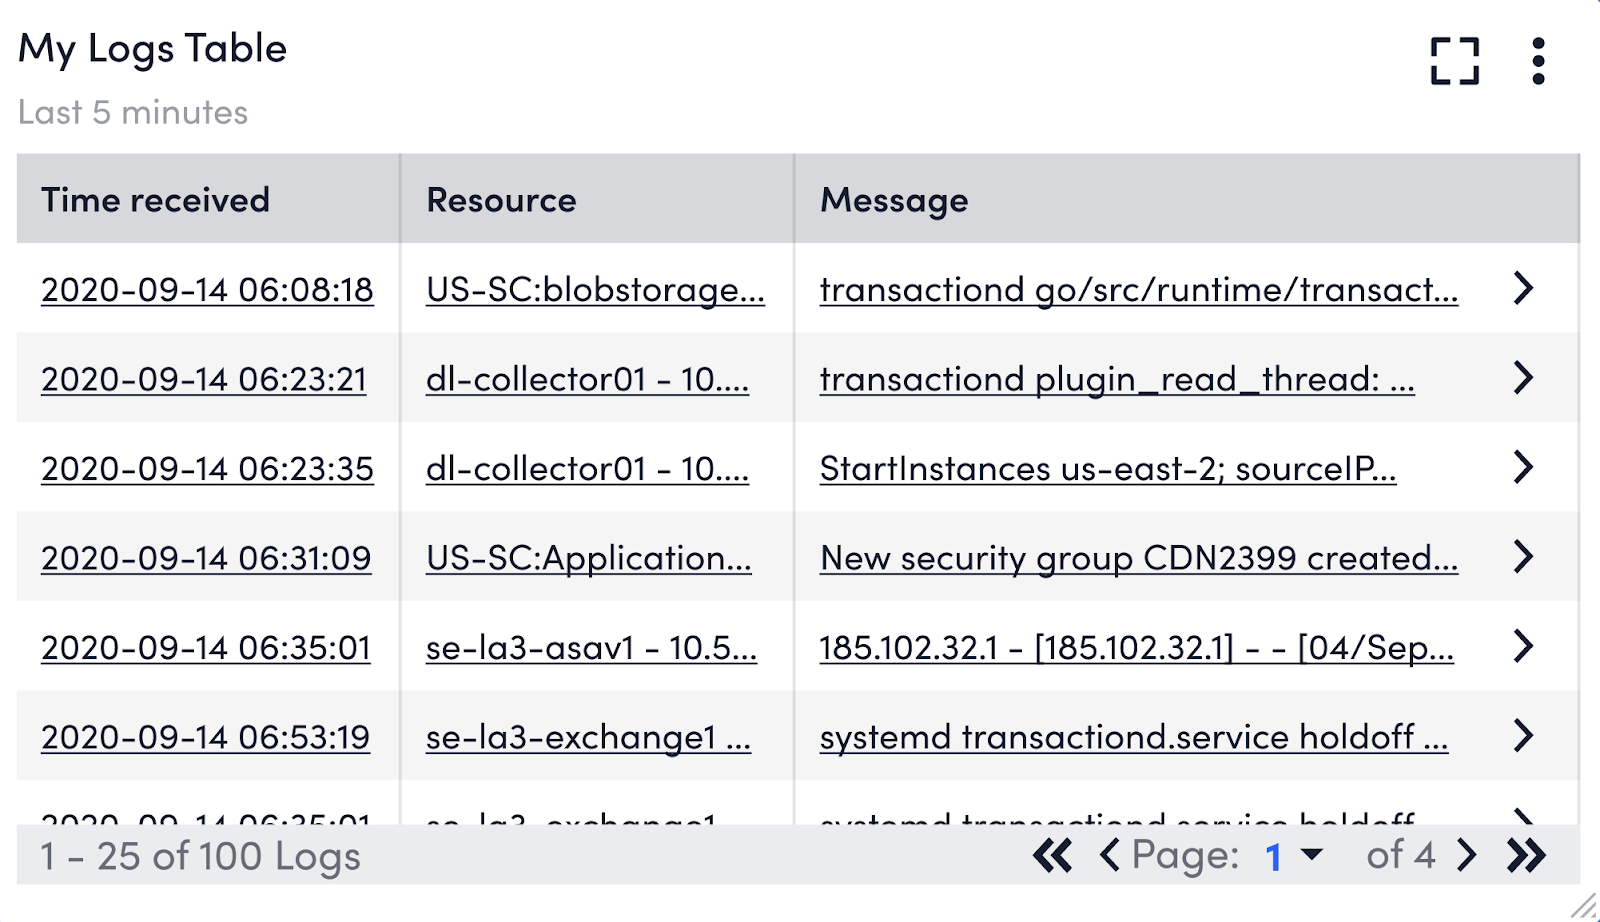
LM Envision’s latest features, like the log dashboard widget, are being added exclusively to the new user interface. Simply toggle on the “New UI Preview” button to take advantage of the log dashboard widget and other new features such as:
Click here for more information on the new UI or visit the documentation.
Resource Explorer (GA)
As highlighted in the fall release blog, LM Envision’s new Resource Explorer (now in GA) helps operations teams quickly organize and visualize their entire hybrid multi-cloud environment in just a few clicks.
Resource Explorer surfaces key insights into business performance by clearly displaying overall resource and application health. Teams can easily isolate high priority issues for faster speed of execution and greater agility with comprehensive visibility across thousands of resources in a single, organized view. Easily filter and group views based on tags such as location, cloud provider, alerts, and more to spot problems, reduce unplanned downtime, and maintain your service levels.
As a reminder, you must toggle on the new UI to take advantage of Resource Explorer. For more information, watch the demo or check out the documentation!

Organize on-premises and multi-cloud resources in a single view.
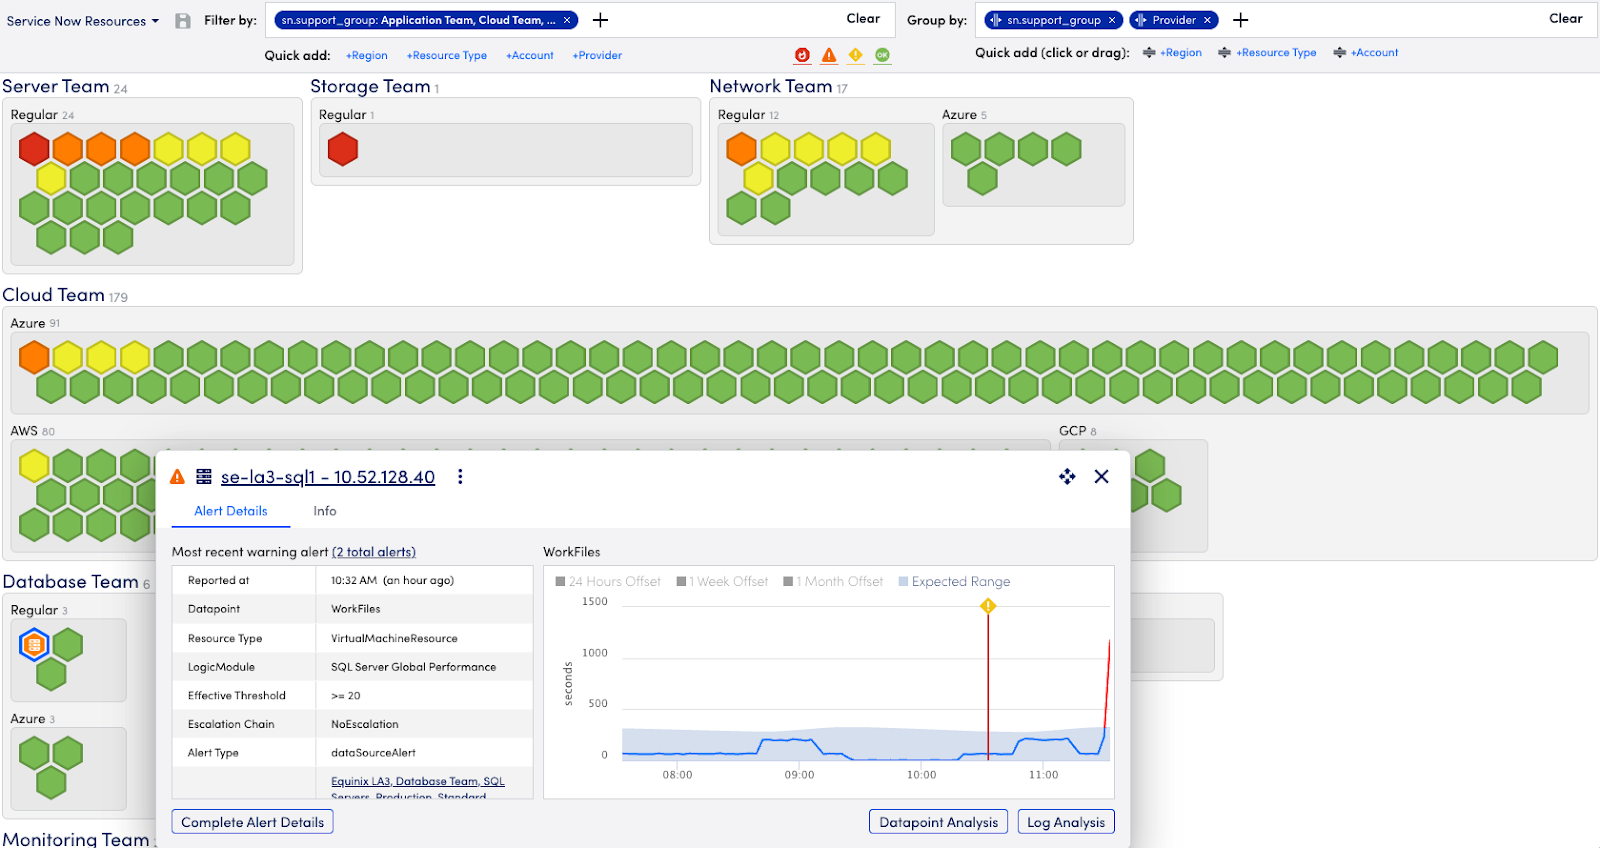
Drill down into a resource at a known location to isolate an issue.
What’s new in Hybrid Coverage
Cloud-Managed Networking
There are many areas in which IT teams are modernizing their network services and infrastructure, including SD-WAN, Cameras, Environmental Sensors, and Wireless Access Points. Whether augmenting or pivoting from MPLS/VPN connectivity services to SDN or embracing cloud-managed networking, LogicMonitor continues to expand its breadth of coverage and deliver on our promise of unified hybrid observability.
Several previously previewed capabilities are now Generally Available, including support for:
- VMware SD-WAN (formerly VeloCloud)
- Cisco Catalyst Center-managed Wireless Access Points
- Cisco Meraki Wireless Access Points
- Cisco Meraki Environmental Sensors
Our integration with Cisco Catalyst Center (previously Cisco DNA Center) is of particular note.
For more information, check out these additional resources:
Forward Together
Our journey is far from over. As we continue to innovate, our focus remains on empowering our customers with the solutions and insights needed to achieve operational excellence. Hybrid Observability powered by AI isn’t just what we do—it’s who we are. We’re excited about the future and invite you to join us on this transformative journey.
In our pursuit, we’re not just aiming to lead; we’re striving to change the game. By continuously evolving and adapting, we’re not only meeting the needs of today’s digital world but also shaping the future of IT monitoring.
Welcome to the next chapter in IT innovation. Welcome to LogicMonitor’s vision of Hybrid Observability powered by AI. To learn more about our latest innovations, make sure to join our upcoming webinar, “Unleashing Hybrid Observability: LogicMonitor’s Latest Product Innovations”
Introduction from Taggart Matthiesen, Chief Product Officer
LogicMonitor’s latest product innovations deliver on our commitment to creating a unified experience, supported by a strong foundation in layered intelligence and hybrid observability.
What’s new?
- Continuing our investment in the new unified experience enabling more cohesive and intuitive experiences
- More intelligence and automation so your teams can spend less time on inefficient troubleshooting, and more time innovating
- Expanding our monitoring scope to eliminate more blind spots and downtime with the extensibility you expect from LogicMonitor
Unified Experience
LogicMonitor empowers ITOps and CloudOps teams to optimize and scale their IT environments, deliver high service availability, and control costs with LM Envision’s hybrid multi-cloud observability platform.
As previewed in the summer release blog, LM Envision’s new UIv4 (now in GA) offers a modern and intelligent new platform design built to maximize user productivity, offer intuitive platform administration, and provide a smarter, cohesive, and accessible experience. With LM Envision’s new UI, LogicMonitor customers can visualize their entire environment to improve uptime and drive business-critical initiatives at speed and scale. Please note that you must toggle on the new UI to take advantage of many of the new features in our Fall release, including Resource Explorer, Dashboard Filters and Datapoint Analysis.
Resource Explorer
As cloud environments explode in complexity, size, and costs, our customers will benefit from a single unified view that streamlines visibility across on-prem infrastructure, multiple cloud resources, and cloud service providers. LogicMonitor’s Resource Explorer helps teams quickly organize and visualize their entire hybrid multi-cloud deployments to clearly see overall resource and application health. Teams gain comprehensive visibility across thousands of resources, and can easily isolate high priority issues in order to accelerate resolutions.
Resource Explorer provides customers with normalized views and properties across any hybrid environment. Easily filter and group views based on tags such as location, cloud provider, alerts, and more to spot problems, reduce unplanned downtime, and maintain your service levels. Problem areas are clearly identified at Resource Explorer’s top view and users can access the contextual details in just a few clicks. Drill down views allow users to locate virtual machines or resources that require attention, to quickly pinpoint the root cause and increase MTTR.
Please note, you must switch over to the New UI by clicking the toggle switch in the header to enable these features. For more information, visit https://logicmonitor.com/support/resources-new-ui-overview.


Dashboard Filters
With UIv4 now in GA, we continue to expand the platform experience with the latest UIv4 feature, Dashboard Filters. Dashboard Filters enables our dashboard creators and consumers to consolidate information into a single pane of glass. Through this new capability, users will be able to leverage filters to hone in on selected resource properties and see the results across widgets on their dashboards. No longer will dashboard creators need to clone and modify queries, nor will dashboard consumers need to spend time navigating the UI in between different dashboards. Remember, you must switch over to the New UI to enable this feature.

Layered Intelligence
Edwin AI
Edwin AI is a new AIOps offering that can reduce alert noise by up to 80%! It ingests events from LM Envision and adds context from ServiceNow CMDB to seamlessly transform millions of alerts into a handful of ServiceNow incidents. Advanced machine learning techniques automatically identify features in the alert data to deduplicate and correlate disparate alerts into connected “Insights” based on time, resources involved, environment, and other significant features of the enriched alert data. The Insights are then correlated so only a handful of Incidents are escalated into ServiceNow as tickets, with a plain English summary that immediately helps Level 1 incident response staff identify the root cause and escalate the ticket to the relevant experts.
Edwin AI comes with the following features:
- Pre-defined, open & customizable Machine Learning Models: With Edwin AI, there is no need to train the AI model, saving your team weeks of manual tagging. Out-of-the-box ML models and integrations with the LM Envision Platform and ServiceNow ensure that IT teams can experience an immediate time-to-value and ROI! In addition, unlike other AIOps vendors, Edwin AI is not a black box. Users can see at a glance WHY certain events are correlated, edit our pre-defined ML models or define their own correlation models to target the alert and enriched CMDB data that makes sense for their business.
- Incident Summary (NLP): Edwin AI generates a plain English textual summary of the Incident in the ServiceNow ticket. Automatically generated Tags to help with “what”, “why” and the “how” of an insight.
- Adaptive Correlation: Edwin AI automatically re-clusters alerts when it identifies a more optimal clustering option. This avoids any delay in escalating insights to ServiceNOW.
- Insight timeline: Pinpoint the causal alert and identify patterns in the alert sequence and instances on the insight timeline
- ServiceNow ready: Edwin AI includes a seamless bi-directional integration with ServiceNOW Incident module, that automatically enriches Edwin AI alerts with ServiceNOW CMDB data to drive additional context for ML correlations.
- MSP ready: Edwin AI supports multi-tenancy with correlations scoped to each tenant.

With Edwin AI, our customers have experienced improved MTTR, SLA’s and faster Root Cause Analysis. In addition, ITOps can finally be proactive instead of reactive. For more information about Edwin AI, please visit https://logicmonitor.com/edwin-ai
Log Alerting Enhancements
Alert fatigue and alert overload is a constant struggle in IT. Log messages in particular can be repetitive in nature, generating noisy alerts for each redundant match. Log Alerting Enhancements provides better granularity and flexibility for monitoring systems through logs, by allowing users to create or suppress alerts based on certain conditions. This can be used for example with audit logs for logging in – you expect both successful and failed login attempts at any given time, but one failed login does not need to generate an alert. With Log Alerting Enhancements, the failed login attempts can be suppressed until it occurs multiple times in a given time window, such as 5 failed logins in a span of 10 minutes, potentially indicating an issue.

Datapoint Analysis
As previewed in our summer release blog, Datapoint Analysis correlates metrics across data sources to enable faster troubleshooting by creating a correlation score. The correlation score is calculated based on:
- Other datapoints from the same instance
- The same datapoint on other instances within the same resource
- The same datapoint on other resources that share the same collector ID
The higher the correlation score for a particular datapoint, the more correlated that datapoint is to the datapoint associated with the alert.
You can now access this new feature from either the Alerts page or the Alerts tab on the new Resources page by going to the Alert Overview tab and clicking on the new “Datapoint Analysis” button. Again, you must switch over to the New UI to take advantage of this new feature.

Hybrid Coverage
SNMP Traps as Logs
SNMP Traps as Logs, now in Beta, is an exciting improvement that will allow Network Managers to do more with their SNMP traps by processing them via logs instead of as individual alerts. This will help users take advantage of other logs features like more scalable search and filtering capabilities, query tracking, automated anomaly detection, and conditional alerting. SNMP variable binds and OID names are automatically translated by LogicMonitor for easier troubleshooting. In addition, this feature includes up to 1 year of SNMP trap data retention.
Previously, EventSources would only generate alerts from SNMP Traps without the ability to view and search raw Traps.
Please note, customers must subscribe to LM Logs to use this feature.

New Modules
LogicMonitor continues to expand coverage for market-leading SD-WAN solutions with brand new monitoring packages for Cisco Catalyst SD-WAN and HPE Aruba EdgeConnect SD-WAN.

LogicMonitor designed these modules with a common look and feel, while following vendors’ best practices, to make it easier for customers to monitor enterprise scale and heterogeneous SD-WAN environments in the context of broader hybrid infrastructures. These modules enable customers to start monitoring entire SD-WAN infrastructures in minutes and dramatically reduce the effort to maintain synchronization with ServiceNow CMDB. Each package provides automatic mapping of SD-WAN topologies, allowing customers to visualize their connections and alert conditions with underlay and overlay networks and or connected devices. Finally, both support key LogicMonitor features like Network Traffic Analysis, Root Cause Analysis, Role Based Access Control, and Log Anomaly Detection.
Cisco Catalyst SD-WAN modules are available now in LM Exchange and Aruba EdgeConnect SD-WAN modules are scheduled for general availability in December.
We’ve also added official support for Oracle MySQL 8.x and with new monitoring capabilities common to our Microsoft SQL Server and Oracle Database modules, i.e. database size and database backup monitoring.
Finally, we’ve updated our Enterprise Backup and Recovery Software monitoring by introducing formal support for Veeam Backup & Replication v12.
More Information
Looking for more fall release details and demos? Don’t forget to register for our upcoming webinar on November 16th at 11am PST, with LogicMonitor’s product leaders for a conversation about how our recent innovations can help you simplify your complex hybrid multi cloud environment!
Got questions about these new features? Click here to join our fall release Community AMA (Ask Me Anything) Group where project managers will answer your burning questions! On December 5th we will have a live AMA, join the group for more details!
Christina Kosmowski, CEO of LogicMonitor, is here today to introduce the latest innovations for our quarterly Summer 2023 Launch, which is focused on extending visibility wherever your business demands through unified monitoring across your entire hybrid cloud ecosystem!
How is it already August? As I look back at the intensely busy spring and summer we had here at LogicMonitor, I can’t help but romanticize the idea of journeys and road trips. The feeling of sunshine coming through the front windscreen, the anticipation bubbling when you peep the next sight on your itinerary, the longing for an ice-cold popsicle at the next pit stop.
August also brings with it the excitement of unveiling our Summer Launch features: the capabilities we took care to improve upon – or build from scratch – based on the destinations our users told us they are trying to reach. You asked for easier access to metrics that matter, so we built intuitive out-of-the-box dashboards and workflows, offering simplicity without compromising on customization. You asked for more efficient ways to optimize resources from the start, so we automated more laborious processes. A hallmark of this launch is our customer-centric commitment to flexibility, ensuring that with LM in the passenger’s seat, the sun never sets on your business’ journey to modernization.
-Christina Kosmowski
CEO, LogicMonitor
Intelligence and Automation
LogicMonitor has always utilized intelligence and automation through agentless collectors to automatically discover new devices and configuration changes, prebuilt workflows, intelligent alerting with dynamic alert thresholds, and logs-based anomaly detection.
We are excited to announce several new features to drive our customers’ ability to surface key insights while reducing alert fatigue and cutting back on manual tasks. These include a controlled release of Edwin AI, Datapoint Analysis, Logs Query Tracking, a new Jira Service Management integration, and a beta release of Event-Driven Ansible.
Edwin AI
Edwin AI ingests events from LM Envision and seamlessly transforms them into episodes. Advanced machine learning techniques automatically identify features in the alert data to correlate the disparate alerts into connected insights based on time, resources involved, environment, and other significant features of the enriched alert data.
Furthermore, Edwin AI’s insights use advanced Natural Language Processing (NLP) to automatically summarize the alerts in a correlation into their most succinct form, vastly reducing the time it takes for support teams to reason about the mass of alerts and drive down MTTR.
The resulting streamlined list of specific actions gives ITOps, Engineers, DevOps, and MLOps teams the time, space, and data needed to prioritize resolving business-critical issues faster than their competitors.
Other capabilities include:
- Adaptive correlation – Edwin AI will automatically re-cluster alerts when it identifies a more optimal clustering option. This avoids any delay in escalating insights to ServiceNOW.
- Extensible correlation – Create user defined correlation models to target the alert and enriched CMDB data that makes sense for your business. You define how your correlations behave.
- ServiceNow Ready – Automatically enriches Edwin AI alerts with ServiceNOW CMDB data to drive additional context for ML correlations. Edwin AI includes a seamless bi-directional integration with ServiceNOW Incident module.
- MSP Ready – Edwin AI supports multi-tenancy with correlations scoped to each tenant.
Edwin AI represents our latest step in delivering AIOps to our customers – whether enterprise or MSPs! To learn how LogicMonitor leverages AIOps, visit https://logicmonitor.com/aiops

Datapoint Analysis
Datapoint Analysis uses advanced machine learning techniques to narrow down the list of metrics across different resources to surface a common pattern during a time of incident.
In the past, users had to search for additional, related metrics in order to diagnose an issue on the Resources page, which takes significant time and effort. This new feature, which is currently in Beta, provides relevant, correlated metrics to help practitioners reduce MTTR and increase productivity.

Logs Query Tracking
Logs Query Tracking creates LM datapoints from log data such as number of events and anomalies for KPI and trend analysis. In the past, it was difficult to provide business insights and track trends in log data. Now, when you mark a saved search for tracking, the query runs every 5 minutes and stores the number of logs and number of anomalies as instance data. Having this information as metrics helps customers view trends over time in LogicMonitor Dashboards and create alerts with static and dynamic thresholds when log counts fall outside an expected range. For more information about Logs Query Tracking, visit https://logicmonitor.com/support/logs-query-tracking. To learn about LM Logs, visit https://logicmonitor.com/logs.

Jira Service Management
LogicMonitor’s new fully released Jira Service Management integration is a bi-directional ticketing integration jointly developed with Atlassian to automate your incident management workflows in Jira based on LogicMonitor alerts. This integration enables LogicMonitor to create, update, and close Jira incidents based on LogicMonitor alerts. It also enables Jira to acknowledge alerts based on incident status.
Event-Driven Ansible
LogicMonitor has partnered with Red Hat to launch Event-Driven Ansible, a jointly developed solution to assist with auto-remediation and auto-troubleshooting. By integrating with the industry standard configuration management tool, we are allowing our customers to trigger remediation workflows on the basis of an alert, so when Event-Driven Ansible receives alerts from LogicMonitor, it can automatically determine the next steps and act in accordance with predefined rules.
When an event is triggered, Event-Driven Ansible will automatically execute the desired action via Ansible Playbooks or direct execution modules, with the ability to chain multiple events together into more complex automation actions. To learn more about our Ansible integration visit: https://logicmonitor.com/support/ansible-integration
If you are interested in signing up for a Closed Beta (available for LogicMonitor customers who have enabled UIv4), please contact your Customer Success Manager or Account Executive.
Unified Platform Experience
The LogicMonitor team has been hard at work creating new features that help customers easily access the metrics that matter and maximize productivity with a more cohesive and intuitive product experience. These features include a new UI, cloud updates, Log ingestion and Log alerts enhancements, and new capabilities in DEM (Digital Experience Monitoring) like Synthetic web checks.
UIv4
LM Envision’s new UIv4 offers a modern and intelligent new platform design built to maximize user productivity, offer intuitive platform administration, and provide a smarter, cohesive, and accessible experience. With LM Envision’s new UI, LogicMonitor customers can focus on uptime and business-critical initiatives at speed and scale to propel their observability journey forward.
LM Envision’s New UI provides the fewest clicks to get users where they are trying to go, intuitive next steps, pre-set defaults, consistency of bulk actions, better search and filtering, all coupled together with modern react components that make for fast, reliable, consistent execution of common tasks. The new UI offers:
- Improved usability to optimize IT workflows, reducing the complexities enterprises commonly face across their hybrid and multi-cloud environments
- Increased productivity to perform actions faster and leverage tightly integrated automation capabilities to proactively resolve issues before they cause business disruptions
- Intuitive instrumentation to immediately access meaningful data when you need it with a modern look and feel so you can focus on business-critical initiatives
- Consistent platform-wide experience with tree navigation, search, filters, icon placement, and more for increased clarity and efficient access to key information
It’s easy to switch over to the new UI – simply click the toggle switch in the header! For more information, visit https://logicmonitor.com/support/resources-new-ui-overview.

Cloud
We recently added new support for AWS, Azure and Kubernetes in Topology Mapping, so customers can now visually see which resources are connected, and use this for troubleshooting.

In addition, LogicMonitor now has 20 new Azure and AWS out-of-the-box dashboards which will help us deliver value to the customer and decrease time to value. These new dashboards will highlight key metrics and provide useful service-specific views for understanding service health, performance, and availability. In addition, the dashboards populate automatically for new cloud accounts added into LogicMonitor. For existing accounts, you can find the dashboard definitions in our AWS GitHub repository and Azure GitHub Repository and import the JSON file directly into your LogicMonitor account. For more information, see Importing Dashboards in the product documentation.


Logs
LogSource UI is a new graphical UI for simplifying log collection and configurations, that allows for log enrichment by adding metadata values. In the past, LM Logs Collection required configuration file edits which could be difficult and confusing for some users. LogSource UI simplifies the setup and configuration for log collection so it’s easier to bring log data into LM Log enrichment.
In addition, we have added advanced enrichment capabilities so users can add additional data to their logs for faster searching and filtering. For example, they could add LM Properties to the logs and search based on those values. For more information, visit https://logicmonitor.com/support/logsource-overview


Digital Experience Monitoring (DEM)
Synthetic Web Checks provides Selenium based recorded web checks with multiple steps and MFA support. In the past, customers could only see timing information for the entirety of the test. Now you can create a test with multiple steps to logically group all your website’s operations, where each step is treated as an individual device. This helps you navigate through all of your website’s operations, and provides granular slicing of the data to display information that is more relevant for alerting and troubleshooting.

SaaS Monitoring
In SaaS monitoring, we added support for M365 logs and Okta logs so users can clearly understand why problems happen, pinpoint the root cause of anomalies, and quickly troubleshoot with M365 logs (including Azure AD, Sharepoint, Exchange, General Audit, and DLP) and Okta logs alongside alerts.
In the past, customers had no easy way to get M365 logs or Okta logs into LogicMonitor. By combining metrics and logs, customers will have a better troubleshooting experience to help them further reduce MTTR. For more information about our SaaS monitoring solution, please visit https://logicmonitor.com/saas-monitoring
Extensibility
LogicMonitor gives customers the flexibility and control to monitor your entire IT environment, eliminate blind spots to prevent downtime, while propelling enterprise growth and transformation. To that end, we have expanded support across our entire portfolio including Platform, Cloud and Container Monitoring.
Platform
As part of our Cloud-managed networking offering, we recently added native integrations to simplify onboarding and streamline monitoring for Cisco Meraki, Cisco Catalyst SD-WAN, and Palo Alto Prisma SD-WAN, with HPE Aruba EdgeConnect SD-WAN coming soon.
LogicMonitor has also added a new Wireless Access Points SKU with support for Cisco Meraki and Juniper Mist. Monitoring wireless access points as discrete resources, rather than instances, makes it easier to count how many devices a customer has, while providing richer data, a better user experience, and access to more LM features. The Wireless Access Points SKU also provides an affordable price at less than one-fifth of the current Network Monitoring list price.
In addition, our customers can now experience next generation coverage monitoring for VMware vSphere, to provide faster discovery and onboarding of new ESXi Hosts and Virtual Machines, and rationalize data points to reduce redundant alerts.

Cloud
We know your cloud deployments span multiple cloud providers, which is why we’ve expanded our Azure offering to help you contain costs across your multi cloud estate and maximize your Azure investments. Azure cost management by tag will help you:
- Quickly adjust resources and accurately predict your Azure spend
- Define custom Azure tags (such as application, environment, createdBy) to analyze costs based on region, application, or custom groupings, and see where costs are allocated
- Clearly see over and underutilized resources to optimize workloads and eliminate unnecessary costs
To learn how to gain deeper insights from your Azure data alongside your on-premises estate, check out our webinar, “On-demand Going Beyond Azure Monitoring with LogicMonitor.”

Our new coverage of Azure Premium FrontDoor allows you to get visibility into FrontDoor performance data and metrics for better visibility into network health and user experience, alongside the rest of their hybrid environment. This will enable you to:
- Reliably reach your users, scale confidently, and reduce content delivery costs
- Gain visibility into user traffic patterns to predict demand changes, identify bottlenecks, and quickly make decisions to optimize application performance and customer experience
We’ve also added a MongoDB Atlas Integration to enable you to monitor Atlas managed databases with LogicMonitor’s cloud (API-based) integration. MongoDB Atlas database resources discovered are billed as cloud resources. With this integration, customers can:
- Gain real-time visibility and proactive anomaly detection across your MongoDB Atlas databases
- Monitor key metrics such as CPU and memory usage, throughput, and disk metrics to identify issues and quickly take action
- Proactively detect anomalies in your clusters to address performance issues and prevent unplanned downtime.
On July 26th, we also announced our expanded relationship with AWS, showcasing our hybrid multi cloud monitoring coverage, and describing the tremendous innovation we offer to help AWS customers accelerate their cloud migration, reduce risk, and visualize their hybrid estate. Learn more here: logicmonitor.com/blog/extend-visibility-wherever-your-business-demands
Container monitoring
As your deployments mature and your developers orchestrate multiple containerized applications, we added several new container monitoring features to make management and troubleshooting easier. These improvements include:
- Certified compatibility with support for Kubernetes 1.25 and 1.26
- LM Container charts, that help you get started quickly with consolidated helm charts, to easily manage complex deployments and ensure consistency across environments.
- Support for monitoring Kubernetes Helms Charts, which helps customers:
- Clearly see the health and performance of your Kubernetes applications
- Quickly respond when configured metrics exceed thresholds or deviate from patterns and take action on critical issues to detect issues or anomalies early on
- Support for monitoring Kubernetes API server and scheduler, so you can make real-time capacity planning decisions to adjust ephemeral resources according to demand changes.
More Information
Missed our Summer Launch webinar? Don’t worry, you can still catch all the details and demos! We hosted a webinar on August 22nd featuring LogicMonitor’s Chief Product Officer, Taggart Matthieson, and LogicMonitor’s Senior Director of Product Marketing, Bill Emmett. They discussed how our latest product innovations can help you unlock intelligence and extensibility in your hybrid IT environments. You can watch the recorded session here: LogicMonitor Webinar
Have questions or feedback about the new features discussed in the webinar and blog? We held an Ask Me Anything (AMA) event with our Product Managers on August 29th. You can read the recap or continue the conversation in our LM Community: Summer Launch AMA