Developers are increasingly using Kubernetes’ open-source platform to manage containerized workloads and services. Kubernetes containers became popular because it was impossible to define a resource boundary for multiple applications in a traditional CPU environment, and resource misuse created an inefficient environment.
Kubernetes solves the problem by allowing applications to work as isolated containers inside a single operating system. These lightweight containers have their own filesystem, CPU share, memory, storage space, etc. You can move the container across clouds and OS distributions, which makes them a powerful resource. Currently, there are three different Kubernetes certifications that you can take to develop your knowledge and skills even further. Keep reading to see which one is right for you.
Why should I get Kubernetes certifications?
Kubernetes certifications create new opportunities for career growth. A recent survey by Cloud Native Computing Foundation suggests that Kubernetes is the go-to choice for more than 78% of organizations, and nearly 84% of companies run containers in production. Such trends are also visible in the 2021 Red Hat OpenShift report, which states that more than half of IT companies intend to increase the use of containers in the future.
Many organizations shortlist employment candidates who hold the Kubernetes certification, so getting certified helps you stand out and often means less competition when you’re looking for a new job. Companies are also willing to pay more to K8s engineers because hiring managers realize that very few individuals are skilled in this emerging field.
Kubernetes certifications paths
The Linux Foundation manages Kubernetes certification. There are currently five certifications. These are:
- Certified Kubernetes Application Developer (CKAD)
- Certified Kubernetes Administrator (CKA)
- Certified Kubernetes Security Specialist (CKS)
- Kubernetes and Cloud Native Security Associate (KCSA)
- Kubernetes and Cloud Native Associate (KCNA)
Developer path: As the name suggests, a developer builds and manages Kubernetes applications. You will design, build, and configure apps. Developers can define the resources that applications will use and troubleshoot relevant issues.
Administrative path: The administrative path focuses on managing the Kubernetes environment. Administrators may install, manage, and configure production-grade Kubernetes clusters. They’re the people behind the Kubernetes operations.
The administrative path also leads to certification as a Kubernetes Security Specialist. The CKS certification ensures best practices and covers the necessary skills to secure container-based apps and platforms from threats. It is important to note that you must hold a Certified Kubernetes Administrator license before pursuing a Kubernetes Security Specialist license.
Foundational cloud-native path: This path is designed for beginners and professionals seeking to understand cloud-native ecosystems. The KCNA certification validates knowledge of Kubernetes fundamentals, while the KCSA certification focuses on cloud-native security principles, making them excellent starting points for a cloud-native career.
Certified Kubernetes Application Developer (CKAD)
The Certified Kubernetes Application Developer exam is developed by Linux Foundation and the Cloud Native Computing Foundation. It’s a two-hour online exam that tests the candidate’s ability to perform the responsibilities of a Kubernetes developer. The two-hour exam is the first step for many new individuals.
Prerequisites
There is no prerequisite to take CKAD; however, prior experience in an IT field will help candidates easily grasp the concepts. The exam will not test candidates on material related to container runtimes and microservice architecture, but it assumes that you should know these contents.
To pass the exam, you should be comfortable with the following:
- An OCI-Compliant container Runtime.
- Concepts and architectures related to Cloud Native application.
- Knowledge of programming languages such as Java, Python, and Node.js.
Content
The course content consists of seven domains and competencies. These include core concepts, configuration, multi-container pods, observability, pod design, service and networking, and state persistence.
The exam
For the CKAD exam, candidates must score 66% or above to become certified. The exam consists of performance-based tasks that candidates must solve in a command line. Each test is proctored online using audio, video, and screen-sharing feeds, allowing the examiner to view candidates’ desktops.
It will cost you $300 to take the Certified Kubernetes Application Developer exam, but you may be eligible for a bundled discount when opting for training and the exam. The certification is valid for three years.
Certified Kubernetes Administrator (CKA)
Certified Kubernetes Administrator certificate ensures you can install, configure, and manage production-grade Kubernetes clusters. After passing the exam, you also become eligible to take the CKS exam.
Prerequisites
Although this certificate does not have prerequisites, candidates should preferably have prior experience in the IT field. The exam is designed for Kubernetes administrators, IT professionals, and cloud administrators.
To pass the exam, candidates should be comfortable in:
- Understanding the key concepts of Kubernetes networking, storage, security, and maintenance.
- Establishing basic use cases for end-users.
- Knowledge of application lifecycle, troubleshooting, and API object primitives.
Content
The exam question tests candidates’ knowledge of five key subjects. Nearly 40% of the content covers storage and troubleshooting. Another 15% is dedicated to workloads and scheduling. Cluster architecture, installation, and configuration comprise almost 25% of the exam’s questions. The remaining 20% tests your knowledge of services and networking.
The exam
You must score at least 66% to pass the CKA exam. The exam is proctored online, and you can review documents installed by the distribution. Candidates can also review the exam content instructions presented in the command line terminal. The Procter will allow you to open one additional tab on the Chrome browser to access particular online assets.
The cost of the exam is $300, which includes a free retake. The certification is valid for three years. You will receive the result within 36 hours after the completion of the exam.
Certified Kubernetes Security Specialist (CKS)
The two-hour exam for Certified Kubernetes Security Specialist evaluates candidates based on the best practices required to secure the Kubernetes environment. To pass the exam, candidates must demonstrate knowledge of securing container-based applications and the Kubernetes platform during build, deployment, and runtime.
Prerequisites
To sit in the exam, you need to pass the Certified Kubernetes Administrator exam first. You may purchase the CKS certification before the actual exam, but you can only take the exam after completing the prerequisite.
Here are some of the important points to grasp before the exam:
- Understand a broad range of best practices required to secure a Kubernetes environment.
- Basic knowledge of dealing with Kubernetes and cloud security issues in a real-world environment.
- Ability to set up clusters, run security audits, detect threats, and do static analysis.
Content
The exam is divided into six modules. The cluster setup comprises 10% of the overall content, while cluster hardening and system hardening make up 30%. The remaining 60% evaluates supply chain security, microservice vulnerability, and managing runtime security.
The exam
The exam, which consists of 15 to 20 performance-based tasks, costs $300 to register for. During the exam, you can access Kubernetes documentation, tools, and app armor. Unlike the two other certifications, CKS certification is valid for two years.
Certified Kubernetes and Cloud Native Security Associate (KCSA)
The Kubernetes and Cloud Native Security Associate (KCSA) exam is designed by the Linux Foundation to validate foundational cloud-native security skills. It serves as a starting point for those new to Kubernetes security or cloud-native technologies. The exam evaluates a candidate’s understanding of Kubernetes security concepts, cloud-native infrastructure, and industry best practices.
Prerequisites
There are no formal prerequisites for the KCSA exam. However, having a basic understanding of Kubernetes and IT security concepts can be helpful.
To pass the exam, candidates should be comfortable in:
- Understanding Kubernetes cluster components and their security features.
- Applying security fundamentals for cloud-native environments.
- Managing container security using best practices.
Content
The exam is divided into six modules. The overview of cloud-native security accounts for 14% of the content, while Kubernetes cluster component security and Kubernetes security fundamentals each comprise 22%. The Kubernetes threat model and platform security cover 16% each, and compliance and security frameworks comprise the remaining 10%.
The exam
The KCSA exam costs $250 and is an online, proctored, multiple-choice test. Candidates have 12 months from the purchase date to schedule and complete the exam. Two exam attempts are included. The certification is valid for three years.
Certified Kubernetes and Cloud Native Associate (KCNA)
The Kubernetes and Cloud Native Associate (KCNA) exam is designed by the Linux Foundation to validate foundational knowledge of Kubernetes and the wider cloud-native ecosystem. It is an entry-level certification for those new to cloud-native technologies, providing a strong starting point for IT professionals and developers.
Prerequisites
The KCNA exam has no prerequisites, making it accessible to beginners and IT professionals who want to develop cloud-native skills.
To pass the exam, candidates should be comfortable in:
- Understanding Kubernetes fundamentals and container orchestration.
- Recognizing cloud-native architecture principles.
- Applying cloud-native observability and application delivery practices.
Content
The exam is divided into five modules. Kubernetes fundamentals account for 46% of the content, container orchestration makes up 22%, and cloud-native architecture covers 16%. Cloud-native observability and application delivery account for 8% of the total.
The exam
The KCNA exam costs $250 and is an online, proctored, multiple-choice test. Candidates have 12 months from the purchase date to schedule and complete the exam, with one free retake included. Like the CKS certification, the KCNA certification is only valid for two years.
Kubernetes certifications comparison table
| Criteria | CKAD | CKA | CKS | KCSA | KCNA |
| Prerequisites | None, but IT experience recommended | None, but IT experience recommended | Must pass CKA first | None | None |
| Exam Format | Performance-based tasks | Performance-based tasks | Performance-based tasks | Multiple-choice | Multiple-choice |
| Exam Length | 2 hours | 2 hours | 2 hours | Online, proctored | 90 minutes |
| Exam Cost | $300 (with possible bundled discount) | $300 (includes free retake) | $300 | $250 (two attempts included) | $250 (one free retake included) |
| Certification Validity | 3 years | 3 years | 2 years | 3 years | 2 years |
Certified Kubernetes Administrator (CKA) vs. Certified Kubernetes Application Developer (CKAD)
Many people need clarification about the two certifications. Because of their relevancy and similarities, they can’t decide which certification to pursue. Here’s our take on the subject.
If you have basic app development experience or are new to Kubernetes, starting as a Certified Kubernetes Application Developer may be better. The certification mainly tests your cloud-native developer and DevOps skills. In contrast, the Certified Kubernetes Administrator exam requires a thorough knowledge of the entire Kubernetes infrastructure and Linux system.
While both exams test various similar features, the Certified Kubernetes Administrator takes it up a notch by evaluating your problem-solving skills in installing, troubleshooting, maintaining, and upgrading. It also means that getting CKAD certification may be a better approach for anyone relatively new to the Kubernetes environment.
Additional cloud native certifications
As the cloud-native ecosystem continues to expand, several certifications complement Kubernetes expertise by focusing on specific cloud-native technologies. These certifications enable IT professionals to deepen their knowledge in specialized areas such as monitoring, service mesh, and cloud-native application delivery.
Prometheus Certified Associate (PCA)
The Prometheus Certified Associate (PCA) certification validates a candidate’s knowledge of observability and monitoring using Prometheus. This exam covers Prometheus fundamentals, querying with PromQL, and setting up alerts and dashboards.
Istio Certified Associate (ICA)
The Istio Certified Associate (ICA) certification focuses on the Istio service mesh, emphasizing service discovery, traffic management, and microservice security. It is ideal for developers and operators of microservice-based applications.
Other cloud native certifications
- Helm Certified Associate: Focuses on using Helm to simplify Kubernetes application deployment and management. Candidates learn about creating, managing, and maintaining Helm charts and handling Helm releases and repositories.
- Fluent Certified Associate: Emphasizes centralized logging, data processing, and log aggregation in cloud-native environments. Candidates learn about configuring Fluentd for log collection, filtering, and forwarding in distributed systems.
- Envoy Certified Associate: Validates expertise in using Envoy proxy for securing, managing, and routing microservice traffic. Candidates learn about configuring Envoy for service discovery, load balancing, traffic routing, and applying security policies such as TLS encryption and access control.
What are the overall benefits of Kubernetes certification?
Containers and the cloud are rapidly changing the IT landscape. Besides a potential rise in pay, new career opportunities, and respect from your peers, Kubernetes certifications allow everyone to integrate the newly acquired knowledge into their existing environment.
The certification allows developers to create container-based management systems. Kubernetes’s flexible environment enables developers to use a variety of programming languages and frameworks to strengthen the existing cloud infrastructure.
Operations can use Kubernetes to bridge the gap between developers and users who are not adept at learning all the scripts and tools. The team can use the technology and expertise gained from certifications to package an application with its required infrastructure.
Security professionals can use Kubernetes and containers to increase the development speed while keeping everything secure. The end-to-end toolchain supporting the existing cloud-native infrastructure creates an attack surface, which is often challenging to defend. Kubernetes can help solve this problem.
How to prepare for Kubernetes exams
A few essential tips will come in handy when preparing for Kubernetes exams:
- You can review the exam guide on the Linux Foundation’s official website. It will help you get the latest updates in each domain.
- Don’t ignore the significance of hands-on training even if you have prior experience and know-how of Kubernetes. Competent training instructors can also answer unresolved queries.
- Master the Linux command line and practice problems using a text editor. Learn systems services because the exam environment relies on them.
- Get used to the exam console as it is different from stand-alone platforms. Shortcuts that work on other platforms may not work here.
- You should also learn how to set up and administer a cluster from scratch. Various online resources can help you do it.
- Maintain your speed by memorizing where to find specific topics in the documentation. Since you only need to solve two-thirds of the questions, skip time-consuming questions and solve them if you have the time.
Taking the next step
Achieving Kubernetes certifications and learning Kubernetes skills can transform your IT career by enhancing your technical expertise, boosting your resume, and opening up exciting job opportunities. Whether you’re just starting with Kubernetes or seeking advanced cloud-native security skills, these certifications validate your capabilities and set you apart in the tech industry.
Take the next step in managing your Kubernetes environment with LogicMonitor’s container monitoring solution. Our scalable, dynamic monitoring platform provides real-time visibility into your Kubernetes and Docker applications, automatically adapting to changes in containerized resources. Identify and resolve performance issues quickly while focusing on innovation.
IT automation uses software and technology to handle repetitive IT tasks automatically, reducing the need for manual work and accelerating processes like infrastructure management and application deployment. This transformation is essential for IT teams needing to scale efficiently, as seen in the case of Sogeti, a Managed Service Provider (MSP) that provides tech and engineering resources worldwide.
Sogeti had a crucial IT challenge to solve. The MSP operates in more than 100 locations globally and uses six different monitoring tools to monitor its customers’ environments. It was a classic example of tool sprawl and needing to scale where multiple teams of engineers relied on too many disparate tools to manage their customers’ environments. It soon became too arduous for the service provider to collect, integrate, and analyze the data from those tools.
Sogeti had teams of technicians managing different technologies, and they all existed in silos. But what if there was a way to combine those resources?
IT automation provided a solution.
After working with LogicMonitor, Sogeti replaced the bulk of its repeatable internal processes with automated systems and sequences. The result? Now, they could continue to scale their business with a view of those processes from a single pane of glass.
Conundrum cracked.
That’s just one example of how IT automation tools completely revolutionizes how an IT services company like an MSP or DevOps vendor can better execute its day-to-day responsibilities.
By automating repeatable, manual processes, IT enterprises streamline even the most complicated workflows, tasks, and batch processes. No human intervention is required. All it takes is the right tech to do it so IT teams can focus on more strategic, high-priority efforts.
But what exactly is IT automation? How does it work? What are the different types? Why should IT companies even care?
IT automation, explained
IT automation is the creation of repeated software processes to reduce or eliminate manual or human-initiated IT tasks. It allows IT companies with MSPs, DevOps teams, and ITOps teams to automate jobs, save time, and free up resources.
IT automation takes many forms but almost always involves software that triggers a repeated sequence of events to solve common business problems—for example, automating a file transfer. It moves from one system to another without human intervention or autogenerates network performance reports.
Almost all medium and large-sized IT-focused organizations use some automation to facilitate system and software processes, and smaller companies benefit from this tech, too. The most successful ones invest heavily in the latest tools and tech to automate an incredible range of tasks and processes to scale their business.
The production, agricultural, and manufacturing sectors were the first industries to adopt IT automation. However, this technology has since extended to niches such as healthcare, finance, retail, marketing, services, and more. Now, IT-orientated companies like MSPs and enterprise vendors can incorporate automation into their workflows and grow their businesses exponentially.
How does IT automation work?
The software does all the hard work. Clever programs automate tasks that humans lack the time or resources to complete themselves.
Developers code these programs to execute a sequence of instructions that trigger specific events from specific operating systems at specific times. For example, programming software so customer data from a customer relationship management system (CRM) generates a report every morning at 9 a.m. Users of those programs can then customize instructions based on their business requirements.
With so many benefits of IT automation, it’s no wonder that two-thirds of CFOs plan to accelerate the automation of repetitive tasks within their companies.
Why do businesses use IT automation?
IT-focused businesses use automation for various reasons:
- It makes life easier for tech teams. For example, engineers and technicians at MSP companies no longer have to execute tasks like network performance analysis, data security management, or reporting manually. The software takes care of everything for them so they can better focus their efforts on other tasks.
- It makes life easier for non-tech teams. Employees across all departments within an IT-focused organization benefit from automation because they can carry out responsibilities on software and systems with less manual work. For example, administrative employees in a DevOps consulting firm can generate payroll reports without manually entering information into a computer by hand.
- It helps CIOs and executives scale their businesses because other employees, such as engineers and MSP professionals, can complete jobs with minimum effort. Automation frees up tech resources and removes as much manual IT work as possible, allowing IT-centered organizations to improve their margins and grow.
- It helps CIOs and executives fulfill client-orientated objectives by improving service delivery. Automation can also advance productivity across an organization, which results in better service level agreement (SLA) outcomes. Again, the right automation software reduces as much manual work for tech teams so businesses can grow and carry out responsibilities more efficiently.
- It allows MSPs and other IT companies, especially smaller ones, to survive in ever-competitive environments. By automating IT processes, these enterprises can stay competitive with more tech resources and reduced manual labor.
- It allows for improved profitability in IT companies. For example, MSPs can onboard more clients without hiring new engineers. That’s because automated systems delegate tasks and resources seamlessly.
- It reduces costs for IT companies by saving time and improving operational efficiencies. For example, by freeing up human resources, enterprises can focus on generating more sales and revenue. As a result, CIOs and executives have more money to spend on labor and can add highly skilled IT professionals to their tech teams.
Key benefits of IT automation
IT automation delivers many advantages that extend beyond simple task delegation. Let’s look at a few benefits your organization will see.
Enhanced organizational efficiency
With the complexity of modern IT infrastructure, modern environments may handle thousands of requests daily—everything from password resets to system failures. Automation can help reduce the time it takes to handle many of those requests. For example, look at an IT telecommunications company with a lot of infrastructure. They can automate their network configuration process, cutting the deployment time from a few weeks to less than a day.
Reduce errors
Human error in IT environments can be costly. Errors can lead to unexpected system downtime, security breaches, and data entry errors—all of which you can avoid by standardizing consistency and standards through automation. Automation helps your team eliminate routine data entry and other tasks and greatly reduces the chance of human error. For example, your team may decide to create backup scripts for more complicated setups to ensure you always have reliable backups.
Faster service delivery
Automation helps speed up responses to common IT requests. If your IT team is stuck needing to perform every task manually, it increases incident response time and the length of time your customer waits on the other end of the line for a fix. Automation speeds up common tasks—setting up VPN access, account resets, report creation, and security scans—allowing your team to focus on finding the root cause of problems, deploying resources, and bringing systems back online.
Streamlined resource allocation
Your organization’s IT needs may fluctuate depending on how many users you have and their activities. A strict guide for resource usage may result in some users being unable to work efficiently because of slow systems. Automation can help by automating resource allocation. For cloud services, you can scale your servers based on demand, and for network traffic, you can dynamically adjust traffic routes based on usage.
Enhanced compliance and security
Automated systems can help your team maintain detailed audit trails and enforce consistent security policies. They can also help with continuous monitoring, allowing your team to get alerts immediately when your solution detects suspicious activity. Additionally, your IT systems can automatically generate compliance reports, such as SOC 2, for review, helping your team find potential problems and comply with audit requests.
Different IT automation types
IT companies benefit from various types of IT automation.
Artificial intelligence
A branch of computer science concerned with developing machines that automate repeatable processes across industries. In an IT-specific context, artificial intelligence (AI) automates repetitive jobs for engineers and IT staff, reduces the human error associated with manual labor, and allows companies to carry out tasks 24 hours a day.
Machine learning
Machine learning (ML) is a type of AI that uses algorithms and statistics to find real-time trends in data. This intelligence proves valuable for MSPs, DevOps, and ITOps companies. Employees can stay agile and discover context-specific patterns over a wide range of IT environments while significantly reducing the need for case-by-case investigations.
Robot process automation
Robot Process Automation (RPA) is a technology that instructs ‘robots’ (machines) to emulate various human actions. Although less common in IT environments than in AI and ML, RPA still provides value for MSPs and other professionals. For example, enterprises can use RPA to manage servers, data centers, and other physical infrastructure.
Infrastructure automation
IT infrastructure automation involves using tools and scripts to manage computing resource provisioning with manual intervention. This includes tasks like server provisioning, bandwidth management, and storage allocation. This allows for dynamic resource usage, with the most resources going to the users and applications with the most need.
How can businesses use IT automation?
A proper automation strategy is critical for IT companies. CIOs and executives should decide how to achieve automation within their organizations and then choose the right tools and technologies that facilitate these objectives.
Doing so will benefit your business in many ways.
- Improve your company’s operation by removing redundant tasks and freeing up time to work on more mission-critical jobs
- Enhance customer satisfaction by more quickly responding and resolving problems
- Improve employee satisfaction by making sure business systems stay online, helping meet their expectations and improving their ability to do their jobs
Here are some examples of how IT companies use automation:
Templating/blueprints
Companies can automate templates and blueprints, promoting the successful rollout of services such as network security and data center administration.
Workflow/technology integration
Automation allows companies to integrate technology with workflows. As a result, CIOs and executives complete day-to-day tasks more effectively with the latest hardware and software. For example, automating server management to improve service level management workflows proves useful if clients expect a particular amount of uptime from an MSP.
AI/ML integration
AI and ML might be hard for some companies to grasp at first. However, teams can learn these technologies over time and eventually combine them for even more effective automation within their organizations.
Auto-discovery
Automated applications like the LogicMonitor Collector, which runs on Linux or Windows servers within an organization’s infrastructure, use monitoring protocols to track processes without manual configuration. Users discover network changes and network asset changes automatically.
Auto-scaling
IT companies can monitor components like device clusters or a VM in a public cloud and scale resources up or down as necessary.
Automated remediation/problem resolution
Hardware and software can provide companies like MSPs with all kinds of problems (downtime, system errors, security vulnerabilities, alert storms, etc.). Automation, however, identifies and resolves infrastructure and system issues with little or no human effort.
Performance monitoring and reporting
Automation can automatically generate regular performance reports, SLA reports, compliance reports, and capacity planning forecasts. It can also generate automated alerting systems in case of problems and report trends to help your business with capacity planning.
Best practices for automation success
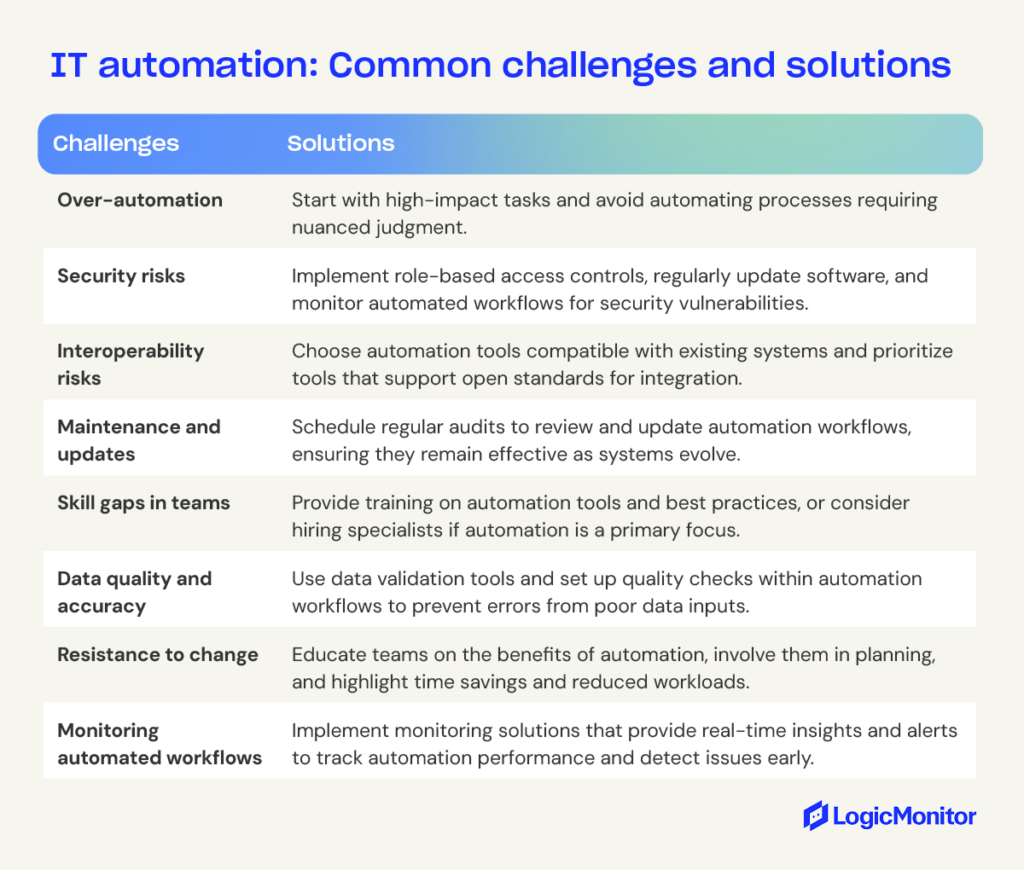
Successfully automating IT in business requires careful planning and thoughtful execution. Follow these best practices to avoid the common mistakes and maximize efficiency:
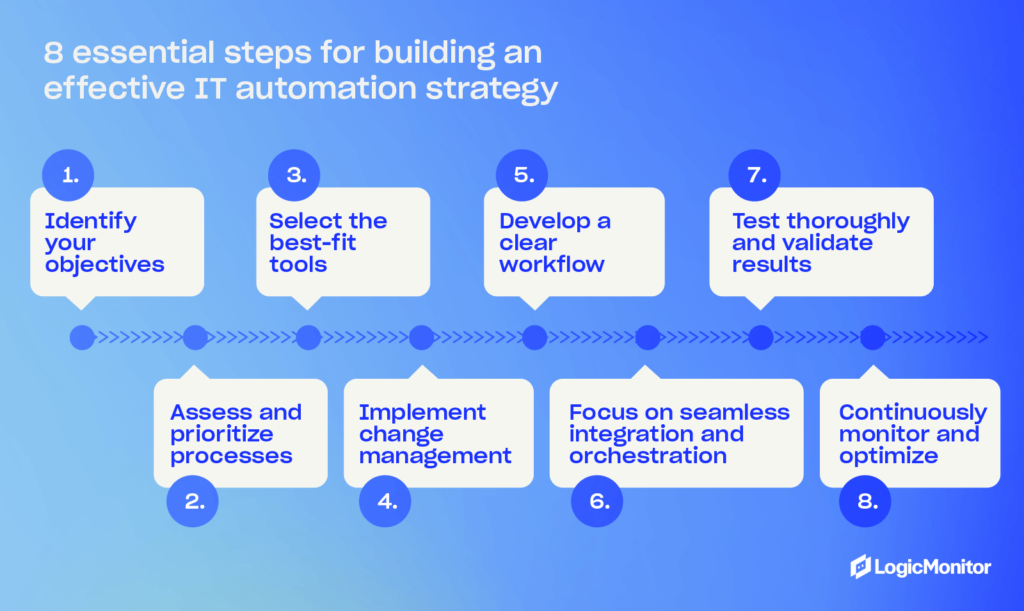
- Align automation and business goals: Don’t just start automating everything possible without a plan. Begin by identifying what you want to achieve with automation. Look for areas to reduce operational costs, improve service, and enhance customer satisfaction, and start with the areas that have the most impact and help you reach your goals. Consider asking stakeholders and employees about their biggest friction points and the ability to automate them.
- Start small: Investing in IT automation is an ongoing task, and you may not do things right the first time. Start small with quick wins. Learn what works for your business and pilot your initial automation tasks to test how they work. Eventually, begin scaling as you gain insights from smaller projects to inform larger, more impactful ones.
- Focus on security: Although your team may not be working with data manually as much, security is still a must with IT automation. Integrate secure protocols at every layer of your systems and processes. Look at your regulatory requirements to determine your needs, and regularly audit your systems to identify potential weaknesses.
- Document everything: If things go wrong, you need detailed records about your automation process. Create documents that detail every system, automation tools and scripts that belong to those systems, and common troubleshooting tips for quickly dealing with problems. Make documentation available to team members so all your team members can look up how things work and manage their designated automation systems.
- Monitor performance: Establish metrics that indicate the success of your automation efforts. Look for improvements in uptime, response time, and other performance data. Regularly look for areas that don’t meet your performance metrics and investigate areas of improvement.
IT Automation Pros and Cons
Here are some pros and cons of automation for those working in IT:
Pros
- Enhanced productivity (improved workflows, higher production rates, better use of technologies and human resources, freeing up IT resources, etc.).
- Better customer/client outcomes (improved SLAs, faster and more consistent services, higher-quality outputs, enhanced business relationships, etc.).
- Reduced total cost of ownership (auto-discovery tools prevent expensive errors, freeing up labor resources, automatic discovery of cost-cutting technologies, etc.).
Cons
- Automation requires an initial cost investment and engineers’ time to set up. That’s why IT-focused companies should choose a cost-effective automation platform that generates an ongoing return on investment.
- Some team members may find it difficult to adopt automation technologies. The best course of action is to select a simplified automation tool.
- Automation may amplify security issues. Software and configuration vulnerabilities can quickly spread in your organization before being detected, which means security considerations and testing must be done before introducing automation.
Read more: The Leading Hybrid Observability Powered by AI Platform for MSPs
Will IT automation replace jobs?
There’s a misconception that IT automation will cause job losses. While this might prove true for some sectors, such as manufacturing, IT-focused companies have little to worry about. That’s because automation tools don’t work in silos. Skilled IT professionals need to customize automation tools based on organizational requirements and client demands. MSPs that use ML, for example, need to define and determine the algorithms that identify real-time trends in data. ML models might generate data trends automatically, but MSPs still need to select the data sets that feed those models.
Even if automation takes over the responsibilities of a specific team member within an IT organization, executives can upskill or reskill that employee instead of replacing them. According to LogicMonitor’s Future of the MSP Industry Research Report, 95% of MSP leaders agree that automation is the key to helping businesses achieve strategic goals and innovation. By training employees who currently carry out manual tasks, executives can develop a stronger, higher-skilled workforce that still benefits from IT automation.
Future of IT automation
AI, machine learning, and cloud computing advancements are significantly altering how businesses manage their IT infrastructure. As these technologies continue to evolve, how you manage your business will change along with them.
Here’s what to expect in the future of IT automation:
Intelligent automation
Traditional automation tools use a rules-based approach: a certain event (e.g., time of day, hardware failure, log events) triggers an action through the automation systems.
Advanced AI operations tools are changing that with their ability to predict future events based on data. That leads to more intelligent automation that doesn’t require a rules-based system. These systems understand natural language, recognize patterns, and make decisions based on real-time data. They allow for more responsive IT systems that anticipate and fix problems.
Hybrid cloud automation
The growing adoption of cloud environments—which include private, public, and on-prem resources—requires your business to adopt new strategies to manage infrastructure and automate tasks. You need tools that seamlessly integrate with all environments to ensure performance and compliance where the data resides.
Hybrid environments also allow for more flexibility and scalability for IT infrastructure. Instead of being limited by physical constraints, your business can use the cloud to scale computing resources as much as needed. Automated provisioning and deployment means you can do this at scale with minimal IT resources.
Edge computing automation
As workforces and companies become more distributed, your business needs a way to provide resources to customers and employees in different regions. This may mean a web service for customers or a way for employees to access business services.
Edge devices can help supply resources. Automation will help your business manage edge devices, process data on the edge, and ensure you offer performant applications to customers and employees who need them.
Choosing the right IT automation platform
Successful data-driven IT teams require technology that scales as their business does, providing CIOs and executives with ongoing value. LogicMonitor is the world’s only cloud-based hybrid infrastructure monitoring platform that automates tasks for IT service companies like MSPs.
LogicMonitor features include:
- An all-in-one monitoring platform that revolutionizes digital transformation for MSPs and DevOps/ITOps teams worldwide.
- Complete 360-degree visibility of utilization, network performance, resource consumption, cloud instances, and much more.
- Full observability of technologies and resources such as servers, data centers, and cloud-based environments.
- The ability to identify problems with legacy tools before they happen.
- Real-time reports and forecasts that reduce internal costs, improve SLA outcomes, and power engineers and other IT professionals.
- No additional hardware maintenance or technical resources. LogicMonitor is ready out of the box.
Final Word
IT automation has revolutionized the IT sector, reducing the manual responsibilities that, for years, have plagued this industry. MSPs no longer need to enter network performance data into multiple systems, physically inspect servers, manage and provision networks manually, analyze performance reports, or perform other redundant tasks manually. Automation does a lot of the hard work so that these IT professionals can focus on far more critical tasks. By incorporating cloud-based infrastructure monitoring, AI, machine learning, and other new technologies, your IT executives improve productivity, enhance workflows, reduce IT resources, promote better client outcomes, and reduce costs over time.
The scene is familiar to any IT operations professional: the dreaded 3 AM call, multiple monitoring tools showing conflicting status indicators, and teams pointing fingers instead of solving problems. For managed service providers (MSPs) supporting hundreds or thousands of customers, this challenge multiplies exponentially. But at AWS re:Invent 2024, Synoptek’s team revealed how they’ve fundamentally transformed this reality for their 1,200+ customer base through AI-powered observability.
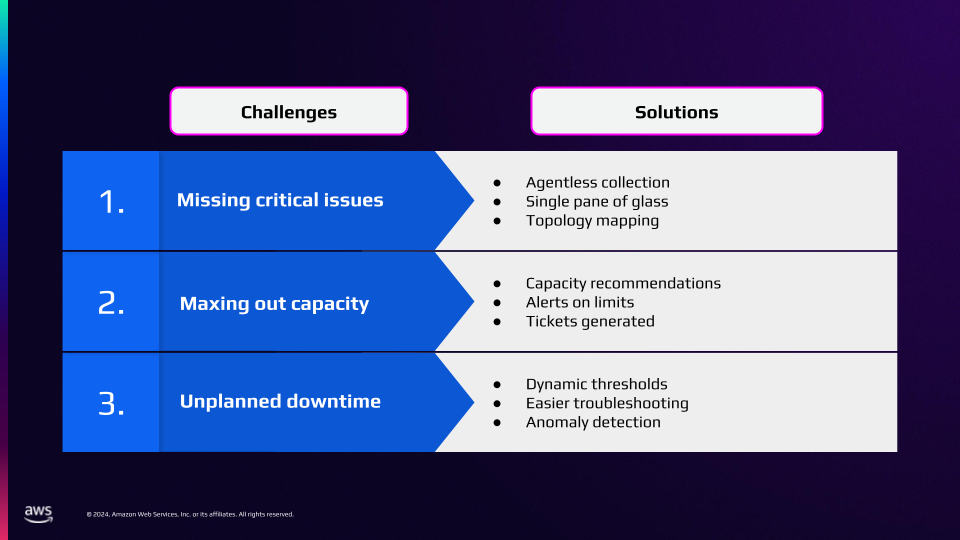
The true cost of tool sprawl: When more tools mean more problems
“In the before times, our enterprise operations center was watching six different tools looking for alerts and anomalies,” shares Mike Hashemi, Systems Integration Engineer at Synoptek.
This admission resonates with MSPs worldwide, where operating with multiple disparate tools has become an accepted, if painful, norm.
The true cost of this approach extends far beyond simple tool licensing. Neetin Pandya, Director of Cloud Operations at Synoptek, paints a stark picture of the operational burden: “If we have more than thousand plus customers, then we need one or two engineers with the same skill set into different shifts…three engineers for a single tool, every time.” This multiplication of specialized staff across three shifts creates an unsustainable operational model, both financially and practically.
The complexity doesn’t end with staffing. Each monitoring tool brings its own training requirements, maintenance overhead, and integration challenges.
Case in point: when different tools show conflicting statuses for the same device, engineers waste precious time simply verifying if alerts are real instead of solving actual problems. This tool sprawl creates a perfect storm of increased response times, decreased service quality, and frustrated customers.
Breaking free from traditional constraints
Synoptek’s transformation began with a fundamental shift in their monitoring approach. Rather than managing multiple agent-based tools, they moved to an agentless architecture that could monitor anything generating data, regardless of its location or connection method.
Hashemi shares a powerful example: “We had a device that was not network connected. But it was connected to a Raspberry Pi via serial cable…they realized that they had to watch that separate from the monitoring system. And they said, ‘Hey, can we get this in there?’ And I said, ‘yeah, absolutely, no problem.'”
This flexibility with LogicMonitor’s hybrid observability powered by AI platform, LM Envision, proves crucial for MSPs who need to support diverse client environments and unique monitoring requirements. But the real breakthrough came with the implementation of dynamic thresholds and AI-powered analysis.
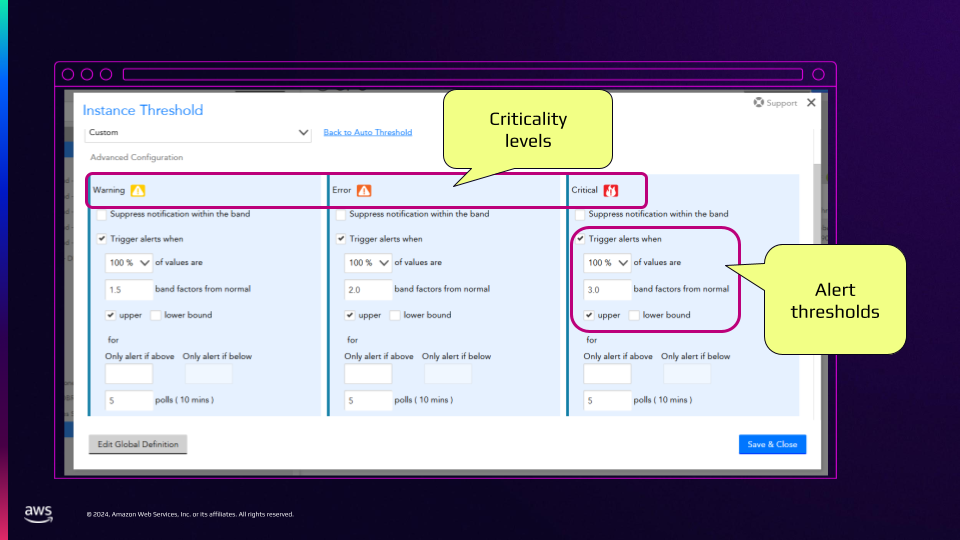
Traditional static thresholds, while simple to understand, create a constant stream of false positives that overwhelm operations teams. “If a server CPU spikes up for one minute, drops back down, it’s one CPU in a cluster… you’re going to get an alert, but who cares? The cluster was fine,” Hashemi explains. The shift to dynamic thresholds that understand normal behavior patterns has dramatically reduced this noise.
The cost optimization breakthrough
Perhaps the most compelling aspect of Synoptek’s transformation emerged in an unexpected area: cloud cost optimization. Pandya describes a common scenario that plagues many organizations: “For a safer side, what they do, they can just double the size and put it and deploy at that time. And they don’t know, and they are putting a lot of monthly recurring costs.”
Through comprehensive monitoring and analysis of resource utilization patterns, Synoptek has helped clients achieve an average of 20% reduction in cloud costs. This isn’t just about identifying underutilized resources; it’s about understanding usage patterns over time and making data-driven decisions about resource allocation.
The AI revolution: Empowering teams, not replacing them
The implementation of AI-powered operations will mark a fundamental shift in how Synoptek delivers services, with early indications pointing towards at least an 80% reduction in alert noise. But what happens to Level 1 engineers when alert volumes drop so dramatically? Synoptek saw an opportunity for evolution.
“Our L1 engineers who are appointed to see the continuous monitoring, that is no longer needed. We put them into more proactive or business strategic work…especially into DevOps operations support,” Pandya explains. This transformation represents a crucial opportunity for MSPs to elevate their service offerings while improving employee satisfaction and retention.
A new era for managed services providers
As Pandya concludes, “The biggest benefit is not only monitoring the cloud platform, we can manage all of our hyperscale and hybrid platforms as well. And it’s all in one place.” This unified approach, powered by AI and automation, represents the future of managed services.
The transformation journey isn’t without its challenges. Success requires careful planning, from selecting the right pilot clients to training teams on new capabilities. But the results, like improved service levels, reduced costs, and more strategic client relationships, make the effort worthwhile.
For MSPs watching from the sidelines, the message is clear: the future of IT operations lies not in having more tools or more data, but in having intelligent systems that can make sense of it all. The key is to start the journey now, learning from successful transformations like Synoptek’s while adapting the approach to specific business needs and client requirements.
Monitoring once provided straightforward insights into IT health: you collected data, identified metrics to monitor, and diagnosed issues as they arose. However, as IT infrastructure evolves with cloud, containerization, and distributed architectures, traditional monitoring can struggle to keep pace. Enter observability, a methodology that not only enhances visibility but also enables proactive issue detection and troubleshooting.
Is observability simply a buzzword, or does it represent a fundamental shift in IT operations? This article will explore the differences between monitoring and observability, their complementary roles, and why observability is essential for today’s IT teams.
In this blog, we’ll cover:
- What is monitoring?
- What is observability?
- Key differences between monitoring vs. observability
- How observability and monitoring work together
- Steps for transitioning from monitoring to full observability
What is monitoring?
Monitoring is the practice of systematically collecting and analyzing data from IT systems to detect and alert on performance issues or failures. Traditional monitoring tools rely on known metrics, such as CPU utilization or memory usage, often generating alerts when thresholds are breached. This data typically comes in the form of time-series metrics, providing a snapshot of system health based on predefined parameters.
Key characteristics of monitoring:
- Reactive by nature: Monitoring often triggers alerts after an issue has already impacted users.
- Threshold-based alerts: Notifications are generated when metrics exceed specified limits (e.g., high memory usage).
- Primary goal: To detect and alert on known issues to facilitate quick response.
An example of monitoring is a CPU utilization alert that may notify you that a server is under load, but without additional context, it cannot identify the root cause, which might reside elsewhere in a complex infrastructure.
What is observability?
Observability goes beyond monitoring by combining data analysis, machine learning, and advanced logging to understand complex system behaviors. Observability relies on the three core pillars—logs, metrics, and traces—to provide a holistic view of system performance, enabling teams to identify unknown issues, optimize performance, and prevent future disruptions.
Key characteristics of observability:
- Proactive approach: Observability enables teams to anticipate and prevent issues before they impact users.
- Unified data collection: Logs, metrics, and traces come together to offer deep insights into system behavior.
- Root cause analysis: Observability tools leverage machine learning to correlate data, helping identify causation rather than just symptoms.
An example of observability: In a microservices architecture, if response times slow down, observability can help pinpoint the exact microservice causing the issue, even if the problem originated from a dependency several layers deep.
For a deeper understanding of what observability entails, check out our article, What is O11y? Observability explained.
Key differences of monitoring vs. observability
Monitoring and observability complement each other, but their objectives differ. Monitoring tracks known events to ensure systems meet predefined standards, while observability analyzes outputs to infer system health and preemptively address unknown issues.
| Aspect | Monitoring | Observability |
| Purpose | To detect known issues | To gain insight into unknown issues and root causes |
| Data focus | Time-series metrics | Logs, metrics, traces |
| Approach | Reactive | Proactive |
| Problem scope | Identifies symptoms | Diagnoses causes |
| Example use case | Alerting on high CPU usage | Tracing slow requests across microservices |
Monitoring vs. observability vs. telemetry vs. APM
Monitoring and observability are not interchangeable terms, but they do work together to achieve a common goal. Monitoring is an important aspect of an observability workflow, as it allows us to track the state of our systems and services actively. However, monitoring alone cannot provide the complete picture that observability offers.
Observability encompasses both monitoring and telemetry as it relies on these components to gather data and analyze it for insights into system behavior. Telemetry provides the raw data that feeds into the analysis process, while monitoring ensures that we are constantly collecting this data and staying informed about any changes or issues in our systems. Without telemetry and monitoring, observability cannot exist.
Application Performance Monitoring (APM) tools give developers and operations teams real-time insights into application performance, enabling quick identification and troubleshooting of issues. Unlike traditional monitoring, APM offers deeper visibility into application code and dependencies.
How monitoring and observability work together
Monitoring and observability are complementary forces that, when used together, create a complete ecosystem for managing and optimizing IT systems. Here’s a step-by-step breakdown of how these two functions interact in real-world scenarios to maintain system health and enhance response capabilities.
Monitoring sets the foundation by tracking known metrics
Monitoring provides the essential baseline data that observability builds upon. Continuously tracking known metrics ensures that teams are alerted to any deviations from expected performance.
- Example: Monitoring tools track key indicators like CPU usage, memory consumption, and response times. When any of these metrics exceed set thresholds, an alert is generated. This serves as the initial signal to IT teams that something may be wrong.
Observability enhances monitoring alerts with contextual depth
Once monitoring generates an alert, observability tools step in to provide the necessary context. Instead of simply reporting that a threshold has been breached, observability digs into the incident’s details, using logs, traces, and correlations across multiple data sources to uncover why the alert occurred.
- Example: If monitoring triggers an alert due to high response times on a specific service, observability traces can reveal dependencies and interactions with other services that could be contributing factors. Analyzing these dependencies helps identify whether the latency is due to a database bottleneck, network congestion, or another underlying service.
Correlating data across monitoring and observability layers for faster troubleshooting
Monitoring data, though essential, often lacks the detailed, correlated insights needed to troubleshoot complex, multi-service issues. Observability integrates data from various layers—such as application logs, user transactions, and infrastructure metrics—to correlate events and determine the root cause more quickly.
- Example: Suppose an e-commerce application shows a spike in checkout failures. Monitoring flags this with an error alert, but observability allows teams to correlate the error with recent deployments, configuration changes, or specific microservices involved in the checkout process. This correlation can show, for instance, that the issue started right after a specific deployment, guiding the team to focus on potential bugs in that release.
Machine learning amplifies alert accuracy and reduces noise
Monitoring generates numerous alerts, some of which are not critical or might even be false positives. Observability platforms, particularly those equipped with machine learning (ML), analyze historical data to improve alert quality and suppress noise by dynamically adjusting thresholds and identifying true anomalies.
- Example: If monitoring detects a temporary spike in CPU usage, ML within the observability platform can recognize it as an expected transient increase based on past behavior, suppressing the alert. Conversely, if it identifies an unusual pattern (e.g., sustained CPU usage across services), it escalates the issue. This filtering reduces noise and ensures that only critical alerts reach IT teams.
Observability enhances monitoring’s proactive capabilities
While monitoring is inherently reactive—alerting when something crosses a threshold—observability takes a proactive stance by identifying patterns and trends that could lead to issues in the future. Observability platforms with predictive analytics use monitoring data to anticipate problems before they fully manifest.
- Example: Observability can predict resource exhaustion in a specific server by analyzing monitoring data on memory usage trends. If it detects a steady increase in memory use over time, it can alert teams before the server reaches full capacity, allowing preventive action.
Unified dashboards combine monitoring alerts with observability insights
Effective incident response requires visibility into both real-time monitoring alerts and in-depth observability insights, often through a unified dashboard. By centralizing these data points, IT teams have a single source of truth that enables quicker and more coordinated responses.
- Example: In a single-pane-of-glass dashboard, monitoring data flags a service outage, while observability insights provide detailed logs, traces, and metrics across affected services. This unified view allows the team to investigate the outage’s impact across the entire system, reducing the time to diagnosis and response.
Feedback loops between monitoring and observability for continuous improvement
As observability uncovers new failure modes and root causes, these insights can refine monitoring configurations, creating a continuous feedback loop. Observability-driven insights lead to the creation of new monitoring rules and thresholds, ensuring that future incidents are detected more accurately and earlier.
- Example: During troubleshooting, observability may reveal that a certain pattern of log events signals an impending memory leak. Setting up new monitoring alerts based on these log patterns can proactively alert teams before a memory leak becomes critical, enhancing resilience.
Key outcomes of the monitoring-observability synergy
Monitoring and observability deliver a comprehensive approach to system health, resulting in:
- Faster issue resolution: Monitoring alerts IT teams to problems instantly, while observability accelerates root cause analysis by providing context and correlations.
- Enhanced resilience: Observability-driven insights refine monitoring rules, leading to more accurate and proactive alerting, which keeps systems stable under increasing complexity.
- Operational efficiency: Unified dashboards streamline workflows, allowing teams to respond efficiently, reduce mean time to resolution (MTTR), and minimize service disruptions.
In short, monitoring and observability create a powerful synergy that supports both reactive troubleshooting and proactive optimization, enabling IT teams to stay ahead of potential issues while maintaining high levels of system performance and reliability.
Steps for transitioning from monitoring to observability
Transitioning from traditional monitoring to a full observability strategy requires not only new tools but also a shift in mindset and practices. Here’s a step-by-step guide to help your team make a seamless, impactful transition:
1. Begin with a comprehensive monitoring foundation
Monitoring provides the essential data foundation that observability needs to deliver insights. Without stable monitoring, observability can’t achieve its full potential.
Set up centralized monitoring to cover all environments—on-premises, cloud, and hybrid. Ensure coverage of all critical metrics such as CPU, memory, disk usage, and network latency across all your systems and applications. For hybrid environments, it’s particularly important to use a monitoring tool that can handle disparate data sources, including both virtual and physical assets.
Pro tip:
Invest time in configuring detailed alert thresholds and suppressing false positives to minimize alert fatigue. Initial monitoring accuracy reduces noise and creates a solid base for observability to build on.
2. Leverage log aggregation to gain granular visibility
Observability relies on an in-depth view of what’s happening across services, and logs are critical for this purpose. Aggregated logs allow teams to correlate patterns across systems, leading to faster root cause identification.
Choose a log aggregation solution that can handle large volumes of log data from diverse sources. This solution should support real-time indexing and allow for flexible querying. Look for tools that offer structured and unstructured log handling so that you can gain actionable insights without manual log parsing.
Pro tip:
In complex environments, logging everything indiscriminately can quickly lead to overwhelming amounts of data. Implement dynamic logging levels—logging more detail temporarily only when issues are suspected, then scaling back once the system is stable. This keeps log data manageable while still supporting deep dives when needed.
3. Add tracing to connect metrics and logs for a complete picture
In distributed environments, tracing connects the dots across services, helping to identify and understand dependencies and causations. Tracing shows the journey of requests, revealing delays and bottlenecks across microservices and third-party integrations.
Adopt a tracing framework that’s compatible with your existing architecture, such as OpenTelemetry, which integrates with many observability platforms and is widely supported. Configure traces to follow requests across services, capturing data on latency, error rates, and processing times at each stage.
Pro tip:
Start with tracing critical user journeys—like checkout flows or key API requests. These flows often correlate directly with business metrics and customer satisfaction, making it easier to demonstrate the value of observability to stakeholders. As you gain confidence, expand tracing coverage to additional services.
4. Introduce machine learning and AIOps for enhanced anomaly detection
Traditional monitoring relies on static thresholds, which can lead to either missed incidents or alert fatigue. Machine learning (ML) in observability tools dynamically adjusts these thresholds, identifying anomalies that static rules might overlook.
Deploy an AIOps (Artificial Intelligence for IT Operations) platform that uses ML to detect patterns across logs, metrics, and traces. These systems continuously analyze historical data, making it easier to spot deviations that indicate emerging issues.
Pro tip:
While ML can be powerful, it’s not a one-size-fits-all solution. Initially, calibrate the AIOps platform with supervised learning by identifying normal versus abnormal patterns based on historical data. Use these insights to tailor ML models that suit your specific environment. Over time, the system can adapt to handle seasonality and load changes, refining anomaly detection accuracy.
5. Establish a single pane of glass for unified monitoring and observability
Managing multiple dashboards is inefficient and increases response time in incidents. A single pane of glass consolidates monitoring and observability data, making it easier to identify issues holistically and in real-time.
Choose a unified observability platform that integrates telemetry (logs, metrics, and traces) from diverse systems, cloud providers, and applications. Ideally, this platform should support both real-time analytics and historical data review, allowing teams to investigate past incidents in detail.
Pro tip:
In practice, aim to customize the single-pane dashboard for different roles. For example, give SREs deep trace and log visibility, while providing executive summaries of system health to leadership. This not only aids operational efficiency but also allows stakeholders at every level to see observability’s value in action.
6. Optimize incident response with automated workflows
Observability is only valuable if it shortens response times and drives faster resolution. Automated workflows integrate observability insights with incident response processes, ensuring that the right people are alerted to relevant, contextualized data.
Configure incident response workflows that trigger automatically when observability tools detect anomalies or critical incidents. Integrate these workflows with collaboration platforms like Slack, Teams, or PagerDuty to notify relevant teams instantly.
Pro tip:
Take the time to set up intelligent incident triage. Route different types of incidents to specialized teams (e.g., network, application, or database), each with their own protocols. This specialization makes incident handling more efficient and prevents delays that could arise from cross-team handoffs.
7. Create a feedback loop to improve monitoring with observability insights
Observability can reveal recurring issues or latent risks, which can then inform monitoring improvements. By continually refining monitoring based on observability data, IT teams can better anticipate issues, enhancing the reliability and resilience of their systems.
Regularly review observability insights to identify any new patterns or potential points of failure. Set up recurring retrospectives where observability data from recent incidents is analyzed, and monitoring configurations are adjusted based on lessons learned.
Pro tip:
Establish a formal feedback loop where observability engineers and monitoring admins collaborate monthly to review insights and refine monitoring rules. Observability can identify previously unknown thresholds that monitoring tools can then proactively track, reducing future incidents.
8. Communicate observability’s impact on business outcomes
Demonstrating the tangible value of observability is essential for maintaining stakeholder buy-in and ensuring continued investment.
Track key performance indicators (KPIs) such as MTTR, incident frequency, and system uptime, and correlate these metrics with observability efforts. Share these results with stakeholders to highlight how observability reduces operational costs, improves user experience, and drives revenue.
Pro tip:
Translating observability’s technical metrics into business terms is crucial. For example, if observability helped prevent an outage, quantify the potential revenue saved based on your system’s downtime cost per hour. By linking observability to bottom-line metrics, you reinforce its value beyond IT.
Embrace the power of observability and monitoring
Observability is not just an extension of monitoring—it’s a fundamental shift in how IT teams operate. While monitoring is essential for tracking known issues and providing visibility, observability provides a deeper, proactive approach to system diagnostics, enabling teams to innovate while minimizing downtime.
To fully realize the benefits of observability, it’s important to combine both monitoring and observability tools into a cohesive, holistic approach. By doing so, businesses can ensure that their systems are not only operational but also resilient and adaptable in an ever-evolving digital landscape.
Automation has been a bit of a buzzword in the IT community in the last few years. Companies around the world are looking for ways to scale and automate routine tasks so they can focus on more strategic initiatives. But “automation” is a word that can cover a lot of workflows and can mean something different to every team.
What do we mean when we talk about automation here at LogicMonitor?
Generally, I like to divide LogicMonitor’s automation capabilities into a few different buckets: we use it for provisioning, workflow orchestration, and event-driven automation. In this blog, we’ll take a look at what tools we have available at LogicMonitor to support each category and where you can start introducing automation into your environment.
Resource provisioning with Hashicorp Terraform
The first step in any automation journey is automating infrastructure creation. Usually this is done by adopting a practice known as Infrastructure as Code (IaC). IaC has been around for years. It is a methodology that essentially creates something like a recipe for your infrastructure. IaC helps you set the definitions as a file for whatever you are trying to deploy, making it repeatable, version-able, and shareable. It establishes the file and avoids human error by creating infrastructure exactly the way you want it, when you want it. It is fast, low risk (because it can be peer reviewed), and allows teams to focus on other, more interesting tasks.
LogicMonitor has native support for two IaC tools out of the box: Redhat Ansible and Hashicorp Terraform. Both of these collections were initially created by our internal team for monitoring our own environment. But now it is, and will continue to be, an open source offering from LogicMonitor at no extra cost to our customers. These collections are now maintained, fully supported, and will continue to be updated by our teams. First, let’s discuss Hashicorp Terraform.
Hashicorp Terraform
LogicMonitor’s Terraform collection is intended to be used during resource provisioning. As folks use Terraform to create their infrastructure, we want to make it easy to add the new resources to LogicMonitor so they are monitored from the beginning. We wanted the experience to be repeatable. For example, if you are a MSP onboarding a new customer, why not use Terraform to replicate the onboarding experience for all of your customers? For enterprises, as teams grow and as your business scales, using Terraform will save you time and money and simplify your team’s ability to monitor resources in LogicMonitor.
Our Terraform Provider has a strong emphasis on resource and device provisioning, and we are constantly updating it. Last year, we added AWS account onboarding, and we recently started adding support for Azure cloud account onboarding.
Managing resources with Redhat Ansible
Now that the resources are provisioned, how are you going to manage them? Routine maintenance is a large part of our IT lives, from keeping things up to date at a scheduled maintenance pace, to troubleshooting on the fly to help diagnose common problems.
We use Ansible here at LogicMonitor for a lot of our workflow orchestration work. As maintenance or upgrades happen, why not communicate to your monitoring platform that work is being done? Schedule downtime with LogicMonitor as part of your Ansible playbook using our LogicMonitor Module. Maybe as part of your remediation playbooks you want to modify a collector group or get information from any of your monitored objects. That is all possible with our certified collection.
Onboarding new customers or setting up a new section of your LogicMonitor environment? We make all of that easy with our Ansible modules, allowing you to create alert rules, escalation chains, and device groups. If you use Ansible in your environment to deploy new infrastructure, our Ansible collection will also give you the opportunity to add these new devices to LogicMonitor for day-one monitoring.
We are always updating and enhancing these collections. If there is something that you would like to see added to these collections, please reach out and file a feedback ticket. We want to understand how you are using our collections today and how you want to use them in the future!
Event-driven automation with Stackstorm
This is the most exciting frontier of our automation journey here at LogicMonitor. This type of automation has a few names that you may have heard of: event-driven or alert-driven automation, “if this, then that” (IFTT) automation, or a self-healing enterprise. The fundamental idea behind this type of automation is that an automated action is taken based off of an event that has occurred. In the case of LogicMonitor, it would mean an alert is generated, triggering another action. The alert details are processed following a set of rules, and an automation is triggered to remediate the cause of the alert.
Imagine the following scenario: You have a windows server that is running out of disk space, and you’re getting alerts about an almost full disk. Traditionally, a tech would see the alert in LogicMonitor (or it would be routed via one of our integrations to a ticketing system), the tech would examine the alert and gather the appropriate information from LogicMonitor (what device is having the issue), VPN into the internal network, and open a remote session with the server. Maybe the tech has a playbook they call to clear common temp files, maybe it is a script, or maybe the tech has to manually do it. The tech finds the files and deletes them, logs out of the system, updating the ticket or worklog, and confirms the alert. In its entirety, this process, though a relatively simple task, takes significant time and resources.
Now imagine the above scenario happened at 1 A.M., routing to an on-call engineer, waking them up. Time is precious, so why not automate these simpler tasks and allow the tech to focus on things that they find interesting or challenging (or let them sleep as low effort, on-call alerts are resolved on their own)?
With event-driven automation, when simple alerts occur, an automation tool processes the alert payload and matches it against a set of rules and triggers that playbook to clear those temp files and resolve the alert.
Our primary offering into event-driven automation is with Stackstorm, an open source event-driven automation tool that is sponsored by the Linux Foundation. The Stackstorm Exchange allows a level of plug-and-play within your environment to not only receive or act within LogicMonitor but to take action in any other environments you may have. Stackstorm has a very robust engine and can handle any type of workflow, whether a simple task or a complicated upgrade plan.
Looking ahead with Event-Driven Ansible
Our Ansible and Terraform collections have a lot of overlap to support teams who may prefer one over the other (or teams that use both), and the same is true with event-driven automation. An exciting development in the market is the entrance of a new offering from Red Hat Ansible called Event-Driven Ansible.
The LogicMonitor team has been working with and experimenting with Event-Driven Ansible when it was released into developer preview late last year. As a Red Hat partner, we are working diligently on building a community source that will plug into Event-Driven Ansible to make it easier for our customers to start experimenting with it. To learn more about Event-Driven Ansible check out https://www.ansible.com/use-cases/event-driven-automation.
If you would like to learn more about our future work with Event-Driven Ansible or are interested in participating in a beta with us before release, please fill out a form to get started!
The IT services industry has continued to grow in the backdrop of high demand for innovative solutions across all industries. Global spending surpassed $1.3 trillion in 2022. Managed services account for much of this spending with managed service providers (MSP) at the heart of the impressive growth.
MSPs make up the largest part of the IT service industry, delivering an extensive host of IT solutions from data storage, Networks and Infrastructure, security, Software as a Service (SaaS), communication services, support, and other essential business solutions. But in today’s fast-paced business environment, client demands change rapidly and MSPs have to adapt quickly to these changing market needs.
MSPs struggle to offer multiple IT Services, and this causes challenges in meeting clientele’s requirements. To overcome this challenge, IT service providers now heavily rely on Remote Monitoring Management (RMM) tools. With RMM, MSPs seamlessly manage clients’ needs remotely and resolve any issues.
While RMM solutions can ease most of the challenges in your MSP, they come with multiple challenges. If you want to move to the next level of IT service management, optimize your systems to overcome myriad challenges with RMM solutions such as inability to scale, weak automation protocol, weak reporting, and complexity of the technology. This post explores how you can leverage unique solutions to go beyond RMM and towards IT service management (ITSM).
How MSPs Are Currently Using RMM
As a managed service provider (MSP), you have a daunting task on your hands to meet diverse clientele needs. Your clientele probably spans multiple industries across different time zones. With a clientele base this wide, you would have to devote a lot of resources to guarantee reliable service delivery.
The traditional break-fix model that MSPs relied on no longer works. You can’t have someone physically visiting your clients’ offices to sort out technical hitches. This is where a dedicated Remote Monitoring Management (RMM) tool. RMM software is integral to network management and asset monitoring by MSPs. Your team gets tools that allow visibility over connected endpoints (client’s devices/networks). With RMM solutions, you can effectively monitor everything that happens on your managed networks and consider the action to improve network performance.
A dedicated Remote Monitoring Management (RMM) tool helps your company standardize connected IT assets and ensure optimal performance. Your IT experts can remotely check on the connected IT assets and evaluate their performance against the standards.
Two of the biggest complaints against MSPs have always been poor response time and downtime. With the best RMM solutions, your IT professionals can now monitor systems, track issues, allocate tasks, and automate maintenance jobs. With this efficient technology, you have all assets under your watch in your control. You gain insight into how your managed networks and assets perform, and carry out maintenance work remotely.
For managed IT service providers, RMM software is a godsend in improving the customer experience. It’s easier to maintain the best SLA levels through ongoing remote maintenance of managed networks. More importantly, MSPs can meet the stringent compliance standards in the industry through improved network performance, remote monitoring, and network security.
With the agents installed on the client’s system, your MSP has real-time data on which to base its decision. Reporting and analytics are two of the major benefits of leveraging RMM solutions. Ultimately, the constant stream of data helps to:
- Reduce downtime: You can foresee emerging problems and resolve them remotely, which improves customer satisfaction levels.
- Respond faster: With real-time monitoring, any issue that emerges on a clients’ website receives immediate attention for resolution.
- Leverage automation benefits: You can automate updates, maintenance works, and other tasks under the managed service agreement, such as creating system restore points, deleting temporary files or internet history, device reboot/shutdown, disk check, and running scripts.
- Enhance productivity: Your team also has more time on its hands to improve your services now that RMM continuously monitors the client’s systems. This boosts productivity levels in your company.
- Reduce costs: Your MSP enjoys the cost-cutting benefits that come with remote management of clients’ systems. Your IT experts can resolve issues remotely without leaving the office.
How MSPs Are Currently Using ITSM
With IT service management (ITSM), an organization can leverage the complete range of benefits from information technology. This is a popular concept in managed IT services, with the principal goal being to deliver maximum value to the IT services consumer.
The key players in ITSM are the MSP, end users (employees and customers using), and IT services offered by the MSP (from applications, hardware, and infrastructure), quality factors, and the costs. Managed services providers (MSPs) work with clients to deliver a host of IT solutions to meet the needs of such clients through a mix of IT solutions, people, and processes.
Unfortunately, MSPs still consider ITSM basic IT support, which means these service providers don’t harness the full potential of this IT concept. If you embrace ITSM in your organization, you have your IT teams overseeing all IT assets from laptops and servers to software applications.
ITSM doesn’t just focus on the final delivery of the IT services but spans the life-cycle of an IT service. An MSP works with the client from the conceptualization of the strategy, design, transition up to the launch/live operation of the service and maintenance.
Why Should MSPs Focus On Moving Past RMM to ITSM?
Unlike RMM, ITSM goes beyond detecting and resolving day-to-day issues on a client’s system. As an MSP, your IT team is integral in service delivery and handles end-to-end management of these IT services. You can leverage different ITSM tools to manage such services effectively.
While most MSPs are comfortable using RMM for enhanced service delivery, ITMS can make life easier for your IT team with structured delivery and documentation. If you implement ITSM for your managed services company, you streamline operations and save on costs with predictable operations.
Another way MSPs are leveraging ITSM is in decision-making. One of the most challenging roles of an IT manager is to make decisions on the fly. Implementing ITSM gives the team actionable IT insights into your operations. You have more control over your organization which helps in better decision making.
There’s a need for the next-gen MSP to move from RMM to ITSM. Some benefits for this shift include:
- Efficiency and productivity gains with defined roles and responsibilities.
- Benefits that come with a structured approach to service management.
- Aligning IT with your MSP’s business objectives/priorities.
- Helping to standardize service delivery.
- Help MSP set and meet realistic expectations for service.
- Facilitating cross-department collaboration.
- Faster response to major IT incidences.
- Building an empowered IT team.
- Improved service delivery.
- Reduced IT costs.
- Reduced regulatory and security risks.
- Increased profitability.
- Higher customer satisfaction.
- Reduced incident life cycles.
- Improved compliance and reduce risk through compliance in IT service design, delivery, and management.
- Reduced downtime because of more efficient alerting with ITSM.
How To Improve ITSM
For a managed services provider, ITSM is essential in the highly competitive industry. You can leverage the best ITSM tools to improve productivity, deliver higher quality services, and much more. For this reason, continuously improve your ITSM strategy.
Below are some ideas you can integrate into your system for better IT service management:
- Setting clear and achievable short and long-term goals: Use the SMART model (Specific, Measurable, Actionable, Relevant, and Time-Bound) when you come up with goals to make it easier to assess progress
- Assess the current situation and needs/ITSM maturity level: Don’t implement any changes for the sake of it but carry out an audit to identify weaknesses you can eliminate. This ensures you invest in appropriate ITSM solutions.
- Establish clear KPIs: The KPIs and metrics help you track the ITMS performance. They include the number of incidents, customer satisfaction score (CSAT), first contact resolution (FCR) rate, average incident resolution time, and the number of service requests.
- Strategize on winning upper management support: Executive agreement eases the update of your MSP’s ITSM capabilities.
- Consider the options to implement ITSM changes: Brainstorm with the team to identify the best techniques to update your ITSM operations. ITIL is one of the trusted frameworks for ITSM best practices, but you can look at alternatives. Make sure you bring everyone on board through training before you implement any changes to ITSM.
- Automation: In today’s fast-paced business environment, automation comes handy if you wish to improve ITSM in your MSP. With the right automation tools, you boost efficiency and help cut costs of any ITSM changes. Automation also reduces the risk of errors, improved predictability, productivity, and reliability, while enhancing customer experience.
- Choose the right ITSM software: To get the most of ITSM, choose the right software to suit your company. Go for a single ITSM software that helps manage everything from one place.
- Incremental changes: Any changes to ITSM require time and a continual service improvement (CSI) approach. Track and measure the progress as you implement the changes to avoid disruptive action that might ruin customer satisfaction.
How To Reduce Costs With ITSM
One of the main advantages of the ITSM platform is the reduction of IT costs. Most businesses that would like to harness the immense benefits of IT solutions can’t because of the associated high costs. With ITSM, organizations can now take their operations to another level by integrating a whole range of IT solutions.
With the competitive nature of the IT industry, MSPs have to identify innovative solutions to cut costs. ITSM helps in cost reduction through higher employee productivity, streamlined business processes, and reduced cost of IT systems.
Some tactics that can help reduce costs with ITSM include:
- Shifting to the cloud: This saves on capital expenditures for equipment such as servers and network equipment. You only pay monthly operating expenses.
- Implementing agile practices: MSPs have to move from the traditional organizational structure and embrace agile collaborative practices. The shift to agile can cut costs through faster fixes and reduced failure rates.
- Automation: Automated managed IT solutions guarantee better service delivery and cut costs on repetitive tasks. From job scheduling to clients’ system monitoring, automated IT service management can help cut costs of operations.
- Use of contractors: Your company can streamline its ITSM platform by recruiting external contractors for service delivery when you need specific tasks done.
- Optimization: By optimizing your ITSM system to reduce downtime, which can eat into your bottom line.
Automating With ITSM To Save Time
MSPs face an enormous challenge in service delivery, and this is where ITSM automation comes in handy. By automating business processes, you improve service delivery, cut costs and more importantly, save time. Time is an invaluable asset in the IT service industry and can make or break your organization.
Automating with ITSM streamlines repetitive tasks from your operations and eliminates redundancy. Automating these functions also enhances the quality of service and boosts the customer experience.
You can also make faster transitions in your business in case of changes when you automate ITSM functions. Other benefits include:
- Easier employee onboarding.
- Automated workflows.
- Faster system updates.
- Automated ticketing for faster resolution of issues by the IT desk.
Automation enables organizations to streamline IT processes, reduce costs, and improve service delivery. By automating routine tasks such as software updates, patching, and backup, IT teams can focus on higher-value activities that require more specialized skills.
Automation can also help to reduce errors and improve consistency, which can increase efficiency and reduce downtime. In addition, automation can provide real-time monitoring and analytics that enable IT teams to proactively identify and address issues before they become critical.
Use ITSM to elevate customer service
ITSM helps MSPs deliver better customer service in several ways:
- Clear service level agreements (SLAs): ITSM involves establishing clear SLAs with clients that specify the level of service they can expect. This can help to manage client expectations and ensure that MSPs are delivering services that meet or exceed those expectations. SLAs can cover response times, uptime guarantees, and other metrics that are important to clients.
- Proactive service management: ITSM is designed to be proactive, rather than reactive. By proactively monitoring IT infrastructure and identifying potential issues before they become critical, MSPs can prevent service disruptions and minimize downtime. This helps to ensure that clients are always able to access the IT services they need.
- Consistent service delivery: Consistency is key with ITSM, which creates a standardized model for service delivery. This helps to ensure that all clients receive the same level of service, regardless of their size or complexity. Consistent service delivery makes the difference in trust building with clients and improving overall experience. Big or small, everyone wants to feel that expert attention to detail
- Communication and reporting: This can include regular performance reports, incident notifications, and other updates as defined by each customer. Effective communication and reporting can help to build trust and confidence with clients, demonstrating that MSPs are actively managing their IT services.
- Continuous service improvement: ITSM involves a continuous improvement mindset, where MSPs are always looking for ways to improve their services. This can include gathering client feedback, monitoring performance metrics, and implementing process improvements. By continuously improving their services, MSPs can stay ahead of the curve and deliver even better service to their clients over time.
By establishing clear SLAs, being proactive, delivering consistent service, communicating effectively, and continuously improving services, MSPs can differentiate themselves in a competitive market and build long-term client relationships based on trust and reliability.
Advanced Security With ITSM Function
ITSM promotes collaboration between IT and security systems. When these two components work together, there’s improved security through automatized alerts, identifying potential risks, faster resolution of security threats. All these give your clients peace of mind.
The IT service industry is volatile and fast-paced, with innovations and solutions emerging every day. To survive in such a turbulent business landscape, your managed services company must adapt fast and embrace the latest solutions. While RMM solutions have served MSPs for a long time, the next-gen MSP has to embrace IT service management (ITSM) solutions to survive. ITSM guarantees better service delivery, reliability, higher productivity, advanced security, cost reduction, and other benefits that give your MSP a competitive edge.
Originally published June 10, 2021. Updated March 2023.
The success of any managed service provider (MSP) is dependent on the people who work for it. When MSP employees are dissatisfied, unhappy, or unengaged they will be less motivated, efficient, and productive. Employees make or break a company, so it’s vitally important to keep them satisfied with their work.
How To Empower Your Employees
It’s a known maxim that companies benefit tremendously from happy workers. This is an easy idea to wrap one’s mind around since it intuitively makes sense. If an employee is happy and engaged with their employer, they work harder. If they are unhappy, they tend to be less productive.
A famous study from the University of Warwick found that “happy employees were 12% more productive, while dissatisfied workers proved 10% less productive”. This is a 22% swing in productivity from employee happiness alone! It is critically important for MSPs to focus on their employee happiness levels if they want to achieve long-term business growth.
So, what can you do to empower MSP employees? How can you keep them happy and engaged?

Resolve Blockers
One of the most de-motivating things for employees can be the inability to complete work effectively due to a third-party dependency. When an employee’s work is frequently blocked by the work of a different team, an inefficient process, a lack of documentation, technical debts, or any number of other potential bottlenecks, it can be extremely difficult for the employee to be productive. They can begin to feel like they aren’t accomplishing anything in their day-to-day work, which can drive down efficacy and motivation. These types of blockers should be found and remedied as quickly as possible.
Allow For Autonomy
Recent research has shown that employee autonomy is essential for an employee’s:
- Engagement
- Happiness
- Motivation
- Productivity
Whether it be autonomy over the details of how to perform or do their actual work, autonomy over their personal work-life balance, or autonomy over their ability to choose what they actually work on, giving more autonomy to employees is an easy way to empower them and enhance company efficiency.
Here are some interesting research points related to autonomy:
- The results of a study performed by the University of Birmingham in 2017 showed that “employees with a higher level of autonomy in their work reported positive effects on their overall well-being and higher levels of job satisfaction.”
- A similar study from Cornell found that “employees with more freedom over their work are more likely to come up with innovative solutions that can make the company more competitive.”
It’s clear that giving employees the ability to have a say in different aspects of their work creates network effects that can lead to increases in company efficiency and can lead to long-term growth.
Increase Mentor-Mentee Work
At some MSPs, peer work is reserved for new employees who are trying to learn the ropes. A new employee is onboarded through a standard process, and they learn from their more experienced coworkers for the first month or two before being able to effectively complete tasks on their own.
Despite this common trend, it has been empirically shown that strong personal relationships between coworkers lead to significantly higher job satisfaction. An easy way to help coworkers create meaningful relationships at work is through a mentor-mentee program.

When there is a mentor-mentee relationship in place, the more senior employee can teach another team member how to effectively solve more difficult issues, how to improve their code or work, how to manage their time more effectively, or any number of general tips they have learned over time on the job.
By creating this relationship, both employees will feel more engaged in their work and in the company itself. This type of peer work can also engender a sense of empowerment in the mentor as they begin to feel responsible for the success of their mentee. The mentee gets the benefit of creating a meaningful relationship inside the company while simultaneously becoming more effective in their job.
Give Employees Ownership
Another great way to improve employee engagement is to give them more ownership of their work. By allowing employees to have full ownership of what they are working on from start to finish, employees can become more engaged and excited with the work itself. There’s an innate sense of pride that comes with creating a product, feature, tool, etc. from scratch, and being the owner of a major project can be particularly empowering for an employee.
Gamify the workplace
Overwhelmingly, IT professionals love games. Gamifying the workplace is the perfect opportunity to create stronger connections in the workplace, as well as improve problem-solving times and focus on innovation.
Every company is different and effective gameplay can vary from team to team, so keeping things fluid is helpful when thinking about gamification. Games can vary from something as simple as recognition-based work apps, to hackathons and everything in between. Studies show that gamifying the workplace in a way that shows off employee achievements improves productivity, engagement, and loyalty.
Reduce Employee Burnout
MSPs are designed to automate, optimize, and standardize processes that other companies do not want to be responsible for on their own. By the nature of this business model, individual MSPs tend to solve the same problem many different times for multiple clients. This leads to one of the largest issues with MSP employee’s motivation: burnout.
Worker fatigue is an inevitable effect stemming from repetitive work. When an employee’s work begins to feel like the same thing over and over again, it’s only natural for their motivation to decrease. Low motivation leads to lower productivity, and ultimately lower company efficiency.
Here are some ideas to reduce monotony for technical workers:
- Mix in complex tasks with simple tasks. Having variability in the difficulty of work can help to prevent employees from feeling fatigued.
- Allow MSP employees to work on projects for different clients to create variability in their day-to-day work.
- Ensure that the least interesting tasks are not always going to the same employees.
Provide time for certifications
MSP practitioners are often very certification-oriented in their goals for growth as employees. Considering many MSP jobs require certifications to prove IT skills, helping employees continue their journeys to gain new certifications is crucial to empowerment. Providing reserved time for a new certification course, or even fund allotments to help practitioners pay for certification courses can help empower employees in a variety of ways. Allowing time to focus on education lets MSP employees learn new skills, refine skills, and level up into new roles in their careers.
Interested in what the top certifications for IT Professionals are?
- Best IT professional certifications for careers
- Best Agile certifications
- A guide to Kubernetes certifications
- A guide to AWS certifications
Create 80-20 Programs
Larger tech companies (such as Google, Facebook, Microsoft, etc.) have some version of an 80-20 program for their employees. These programs vary from company to company, but the main idea is that employees do their day jobs from Monday to Thursday (80%), but on Friday (20%) they are free to work on any project within the company that appeals to them. This allows employees to sample work in different areas of the company and learn new skills while still being productive. It also creates the potential for internal lateral moves over time, if the employee wants to eventually switch roles.
Introducing these programs and providing employees with this degree of autonomy over their work has shown huge increases in productivity at the companies that have implemented them. It’s also a great way to reduce employee fatigue as they are able to work on problems that interest and excite them on a weekly basis and have the ability to move positions after some time.
Happiness Is Key
It is well known that there is a correlating relationship between employee happiness and employee productivity. When it comes to an individual’s work, empowered employees are both happier and more motivated to see the success of their respective companies. More often than not, this empowerment directly leads to higher productivity and efficiency within the company itself.
MSP companies should do everything in their power to keep employees feeling empowered. To do this, MSPs can try to provide ways for employees to feel ownership over their work, mix up individual work to avoid burnout, reduce bottlenecks, and facilitate mentor-mentee relationships.

Want to see how you can improve operational efficiency with monitoring best practices? Watch our webinar today!
Last updated September 2022.
There are many types of data compatible with SQL Server, and it’s important to understand what they are to avoid issues with non-compatible data types. Understanding the compatible data types is also fundamental to understanding the data type precedence, which determines what type of data will result when working with objects of two different types.
In this guide, we’ll go through all of the data types SQL Server supports, along with the process of defining custom data types using Transact-SQL or the Microsoft .NET Framework.
Contents
- What Is SQL Server?
- Why Are Data Types Important?
- What Are the Different Data Categories?
- Defining Custom Data Types
- Choosing the Right Data Type
What Is SQL Server?
Before we dive into the many data types SQL Server supports, here’s a quick recap on what SQL Server is. Microsoft developed SQL Server to serve as a relational database management system (RDBMS). SQL Server utilizes SQL, the standard language for using relational databases of all kinds.
Microsoft’s SQL Server is no longer exclusive to the Windows environment and is now available on Linux, which is great news for those interested in using SQL Server. Additionally, Microsoft’s cloud platform, known as Azure, supports SQL Server. So, if you need a place to host it, there’s no better place to look than the native solution.
Microsoft markets it as “the cloud that knows SQL Server best,” and Azure SQL Server indeed benefits from seamless integration, simplicity, and reliability since both the server and cloud infrastructure are developed and maintained by the same company.
Regardless of where you host SQL Server, though, it’s critical to note SQL Server uses a slightly different SQL language. Microsoft has developed Transact-SQL (T-SQL), which is very similar to standard SQL but defines a set of proprietary concepts necessary to program SQL Server.
If you are familiar with SQL, using Transact-SQL will not be difficult, and you’ll be able to utilize SQL Server with ease. But another critical aspect of effectively using SQL Server is understanding all of the data types it supports.
Why Are Data Types Important?
The wrong data type can lead to issues with database performance, query optimization, and data truncation. These problems are often first realized by the development team as they are the ones tracking speed and performance. Still, problems can trickle down to the entire organization, causing data integrity issues and other serious challenges.
If you’re new to SQL Server, the sheer number of data types may be overwhelming. However, they are neatly organized and well-documented, making it a bit easier to find what you need as long as you understand what type of data you are planning to store. Of course, while you can reference as you go along, gaining knowledge of SQL Server data types is paramount to efficiency and optimization in the long haul. Once you dive in, you’ll see that there is some overlap, and knowing when to choose float point over decimal or opt for variable-length over fixed is only possible if you fully understand all of your options.
What Are the Different Data Categories?
Below is a look at each category of data within SQL Server, along with all of the data types that fit within each one.
Exact Numerics
When using an exact numeric data type, it’s important to understand your options so that you can select the smallest data type suitable for your use case. It’s also necessary to choose the data type corresponding to the kind of numeral you’re storing—like money or smallmoney for currencies.
- tinyint: The smallest integer storage type, capable of storing numbers between 0 and 255.
- smallint: Integer storage type with twice the size, up to 2 bytes.
- int: Integer storage type with up to 4 bytes of storage.
- bigint: The largest integer storage type capable of holding up to 8 bytes of data.
- decimal and numeric: These synonymous terms refer to the same data type, which is characterized by its fixed scale and precision.
- bit: This data type always has a value of 1, 0, or NULL. You can convert true/false data to a bit, where 1 equals True, and 0 equals False.
- smallmoney: This data type represents monetary values and allows up to two decimals.
- money: This is another monetary data type but allows up to four decimals.
Unicode Character Strings
If you’re unfamiliar with Unicode, it is a universal standard that assigns a unique number to every character, allowing written text to be encoded and represented consistently. For example, “hey” in Unicode would be broken down as follows: U+0048 (“H”), U+0065 (“E”), and U+0059 (“Y”).
SQL Server supports the full range of Unicode character data using these character strings. They can be fixed or variable.
- nchar: Fixed in size, recommended for use when the data sizes in a column are consistent.
- nvarchar: Variable in size, recommended for use when data sizes in a column vary considerably.
- ntext: Scheduled for removal in future versions of SQL Server, designed as a variable-length data type for Unicode. Microsoft recommends nvarchar(max) instead.
Approximate Numerics
When numeric data cannot be represented exactly, it is referred to as “floating point” numeric data, and you would use approximate-number data types to store it. With floating-point data types, the number is written using scientific notation, so 825,000 would be stored as 8.5 x 10⁵.
Floating-point numbers can be incredibly large or incredibly small. Both floating-point and decimal data types can store a number with a decimal—the difference is that floats require less storage space while decimals are more precise. SQL Server supports two kinds of approximate numerics with the float and real data types.
- float: Double precision floating number, which equates to 8 bytes or 64 bits.
real: Single precision floating number, which equates to 4 bytes or 32 bits.
Character Strings
Character strings have a self-explanatory name: These data types are used to store characters. They can be fixed or variable in size.
- char: Fixed-size string data that uses a static memory location. Ideal when you know the length of the string and all strings in a column will be the same
- varchar: Variable-sized string data that uses a dynamic memory location. Use if you are unsure of the length of the string or when the length of strings in a column will vary considerably.
- text: Scheduled for removal in future versions of SQL Server, designed as a variable-length data type for non-Unicode data. Microsoft recommends replacing it with varchar (max).
Binary Strings
Binary data types support either fixed or variable strings of data. The difference between character strings and binary strings is the data they contain: Character strings typically store text but could also store numbers or symbols. Binary strings typically store non-traditional data in the form of bytes, such as pictures.
- binary: Fixed length, ideal to use when the data sizes in a column are consistent.
- varbinary: Variable length is ideal when data sizes in a column vary considerably.
- image: Scheduled for removal in future versions of SQL Server, designed to store variable-length binary data. Microsoft recommends replacing it with varbinary (max).
Date and Time
These data types are explicitly designed for storing dates and times. Some support timezone awareness and others do not. When dealing with dates and times, it’s crucial to choose a data type that keeps entries consistent in format and select a data type that’s flexible enough to support the level of detail you need (i.e., time of day, timezone, etc.).
- date: Defines the date. The default format is YYYY-MM-DD but can be formatted in over 20 different ways, including DMY, DYM, and YMD.
- datetimeoffset: Defines a date and time of day. This data type is timezone aware.
- datetime2: Extension of the above data type with an optional fractional seconds precision.
- datetime: Similar to datetime2 but with less fractional seconds precision.
- smalldatetime: Defines a date and time of day, but seconds are always zero.
- time: Defines a time of day but without timezone awareness.
Other Data Types
Additional data types exist in SQL Server, but they don’t quite fit into any of the above categories. For that reason, these data types simply exist under “other.” The other data types include the following:
- rowversion: Used for version stamping rows within a table. A simple incrementing number that does not preserve date or time.
- hierarchyid: Variable length system data type used to represent the position in a hierarchy.
- uniqueidentifier: A globally unique identifier (GUID) capable of storing up to 16 bytes.
- sql_variant: Stores various data types supported by SQL. The most important part of sql_variant is that it is variable. For example, one sql_variant column could contain an int in one row and a binary value in another. In order for arithmetic operations, like SUM or PRODUCT to be applied, the type must be first cast to something that works with that operation.
- xml: Stores XML data.
- Spatial Geometry Types: Represents data in a flat coordinate system.
- Spatial Geography Types: Represents data in a round-earth coordinate system.
- table: Special data type used to store a result for processing at some point later.
Defining Custom Data Types
In the event that you have a custom data type that is not specific in any of the above categories, you can still bring it onto SQL Server, so long as you set it up in advance. Using either Transact-SQL or the Microsoft .NET Framework, developers can define custom data types for their projects.
While creating a custom data type, SQL Server’s interface has some tools to help you generate Transact-SQL. The fields you’ll need to specify are schema, name, underlying data type, length, allowing nulls, the size in bytes, optional fields in a default value, and any rules the data type must follow. For example, an email field would likely use a varchar underlying type and must contain an @ and a ., alongside a list of disallowed characters. You’d then set a max length that suits your needs, and the number of bytes would be automatically populated in the interface.
Microsoft offers more information if you need to create your own data type.
Choosing the Right Data Type
When working with SQL Server, it’s crucial that you choose the correct data type for any data you are working with. Failing to do so could lead to data quality issues or data loss, like in instances where you use a data type to store date and time when it is not intended to do so. The wrong data type can also negatively impact querying and performance.
For instance, if you need to store integers, you might assume you can’t go wrong by simply choosing an exact number data type. However, unnecessarily using the bigint type to store a small, simple number like age will lead to wasted resources.
Most would tell you to choose from smallint, integer, bigint, or decimal any time you’re working with numeric data. If you’re dealing with very big numbers, they might suggest decfloat or float. But, this advice is too simplistic and general when you’re dealing with specific use cases.
For instance, you might be working with an inventory system that requires four-digit values and leading zeros. Or, you might be storing Social Security numbers, which need to be properly formatted with hyphens as XXX-XX-XXXX. As you can imagine, there are many complex applications for SQL Server where general guidelines aren’t good enough for choosing the right data type. For that reason, knowing all of the data types available is the first step in choosing the best data type for any information you need to store. Fortunately, you don’t have to memorize all of the data types and their range of information. Microsoft has excellent documentation that takes you through every data type discussed here if you ever need more detailed information in the future.
Virteva serves organizations that want better outcomes for IT support. Those organizations that want to delight users, leverage the strengths of their partners, and constantly seek continuous improvement of their environment.
Virteva believes that this new era of IT support requires a different mindset to thrive. We focus on enabling our clients and our end-users to be productive, secure, and have effortless experiences. To that end, Virteva has made significant investments in innovative technology and created scalable processes supported by people that push themselves to meet and exceed the expectations of its customers. Virteva, a Microsoft Gold Partner with multiple Advanced Specializations in Modern Workplace, helps organizations optimize the value from their Microsoft investment through Professional and Managed Services offerings that start with business outcomes and end-user success. Leveraging learnings from deployments and ongoing management of IT Operations, Virteva is uniquely placed to serve customers through a strong user-centric culture, industry-leading technology, and efficient processes to deliver an unmatched IT Experience.
Question: What was the main problem your customer was facing and why was it important that it was solved?
Zach’s Answer: Virteva worked with a large hospitality organization that wanted real-time call volume trends so they could act more proactively and improve their employee and customer experience. They wanted to better correlate call volume to incident management to resolve issues more rapidly.
Question: What solution(s) did Virteva come up with to address this problem using LogicMonitor?
Zach’s Answer: Virteva offers Service Desk services in a shared services model, so our first reaction was to investigate capabilities in our Cisco phone system or Quality Management (QM) system to provide this access. However, there were data privacy risks that we couldn’t solve because of the multi-tenant situation. Then we thought of LogicMonitor because we have successfully leveraged the dashboarding capabilities via API for other solutions, but not with our Cisco phone system.
Question: What were the positive business impacts for your client that came out of this creative approach?
Zach’s answer: When we brought in the data, we found visualizations of call volume that we’ve never been able to provide before. When we showed our customer, it was beyond any expectation that they had. We were able to show real-time and historical call volume data, this allowed them to answer questions that were previously unanswered.
Question: Have you been able to utilize this same strategy with other customers to help them achieve great results?
Zach’s Answer: We are currently in the process of expanding our platform of dashboards within LogicMonitor to bring to our customers. We are excited to be building dashboards more than just our Service Desk, but also our O365 services, Azure, and Microsoft licensing, and we will continue working with our customers to understand how else we can improve their operational capabilities via LogicMonitor.
Question: Were there any other aspects of this great success story that you wanted to mention?
Zach’s Answer: “It’s worth noting that we were working with the VP of IT Service Management who was very concerned about the user experience and IT’s ability to respond to volume on the Service Desk. Let’s call this reacting proactively – meaning that we are trying to be proactive around responding to users’ needs by setting up systems, processes, and capabilities to react faster than we were before. IT needs to move from reactive to proactive to be a value driver for the business. However, the reality is in the support business, it’s not always possible to do that, so the next best thing is to ensure that when you have to react, that you have proactively put in place the things needed to execute to be as efficient as possible.
At Virteva, we strive to be an organization that works with customers to find innovative solutions, that wants to enable your organizations IT operational success and is focused on improving the IT Experience. We are excited to be able to execute on that promise via great solutions, like LogicMonitor.
Outages remain widespread

2020 and 2021 cyberattacks
An overwhelming 88% of MSPs say their customers have been affected by cyberattacks in the last two years. And as concerns about cyberattacks continue to increase, MSPs are not confident they have the tools to effectively manage security challenges on behalf of their enterprise customers.


Cyberattack risk reduction strategies
MSPs have wised up to the growing threat of cyberattacks and are now implementing new strategies and safeguards to better protect their customers from these incidents, including through increased levels of monitoring and automation.

If you’d like to explore how LogicMonitor can help automate and streamline your operations, find out how we can provide insight into your infrastructure, to your logs and applications to make better business decisions on logicmonitor.com/msp.
METHODOLOGY: In October 2021, LogicMonitor commissioned an independent research firm to survey 600 senior global employees working for IT Managed Service Providers (MSPs) in nine countries. The goal of LogicMonitor’s research was to understand the state of MSPs in 2022 and beyond, provide key insights into their strategic goals, and offer up recommendations on how to accelerate transformation to attain those goals