The traditional data center is undergoing a dramatic transformation. As artificial intelligence reshapes industries from healthcare to financial services, it’s not just the applications that are changing—the very infrastructure powering these innovations requires a fundamental rethinking.
Today’s data center bears little resemblance to the server rooms of the past. The world is seeing a convergence of high-density computing, specialized networks, and hybrid architectures designed specifically to handle the demands of AI workloads.

Source: Gartner (November 2024)
This transformation comes at a critical time. With analyst projections indicating that over 90% of organizations will adopt hybrid cloud by 2027, CIOs face mounting pressure to balance innovation with operational stability. AI workloads demand unprecedented computing power, driving a surge in data center capacity requirements and forcing organizations to rethink their approach to sustainability, cost management, and infrastructure design.
The New Data Center Architecture
At the heart of this evolution is a more complex and distributed infrastructure. Modern data centers span public clouds, private environments, edge locations, and on-premises hardware–all orchestrated to support increasingly sophisticated AI applications.
The technical requirements are substantial. High-density GPU clusters, previously the domain of scientific computing, are becoming standard components. These systems require specialized cooling solutions and power distribution units to manage thermal output effectively. Storage systems must deliver microsecond-level access to massive datasets, while networks need to handle the increased traffic between distributed components.
This distributed architecture necessarily creates hybrid environments where workloads and resources are spread across multiple locations and platforms. While this hybrid approach provides the flexibility and scale needed for AI operations, it introduces inherent challenges in resource orchestration, performance monitoring, and maintaining consistent service levels across different environments. Organizations must now manage not just individual components but the complex interactions between on-premises infrastructure, cloud services, and edge computing resources.
The Kubernetes Factor in Modern Data Centers
Container orchestration, particularly through Kubernetes (K8s), has emerged as a crucial element in managing AI workloads. Containerization provides the agility needed to scale AI applications effectively, but it also introduces new monitoring challenges as containers spin up and down rapidly across different environments.
The dynamic nature of containerized AI workloads adds complexity to resource management. Organizations must track GPU allocation, memory usage, and compute resources across multiple clusters while ensuring optimal performance. This complexity multiplies in hybrid environments, where containers may run on-premises one day and in the cloud the next, making maintaining visibility across the entire container ecosystem critical.
As containerized AI applications become central to business operations, organizations need granular insights into both performance and cost implications. Understanding the resource consumption of specific AI workloads helps teams optimize container placement and resource allocation, directly impacting both operational costs and energy efficiency.
Balancing Cost and Sustainability
Perhaps the most pressing challenge for CIOs is managing the environmental and financial impact of these high-powered environments. Data centers (with cryptocurrencies and AI) consumed about 460 TWh of electricity worldwide in 2022, almost 2% of total global electricity demand. This consumption could more than double by 2026, largely driven by increasing AI workloads.

Sources: Joule (2023), de Vries, The growing energy footprint of AI; CCRI Indices (carbon-ratings.com); The Guardian, Use of AI to reduce data centre energy use; Motors in data centres; The Royal Society, The future of computing beyond Moore’s Law; Ireland Central Statistics Office, Data Centres electricity consumption 2022; and Danish Energy Agency, Denmark’s energy and climate outlook 2018.
Leading organizations are adopting sophisticated approaches to resource optimization. This includes:
- Dynamic workload distribution between on-premises and cloud environments
- Automated resource scaling based on actual usage patterns
- Implementation of energy-efficient cooling solutions
- Real-time monitoring of power usage effectiveness
These optimization strategies, while essential, require comprehensive visibility across the entire infrastructure stack to be truly effective.
Hybrid Observability in the Age of the Modern Data Center
As AI workloads become more complex, the next frontier in data center evolution is comprehensive, hybrid observability. Traditional monitoring approaches struggle to provide visibility across hybrid environments, especially when managing resource-intensive AI applications.
Leading enterprises are increasingly turning to AI-powered observability platforms that can integrate data from thousands of sources across on-premises, cloud, and containerized environments.
LogicMonitor Envision is one platform that has proven its value in this new reality. Syngenta, a global agricultural technology company, reduced alert noise by 90% after implementing LM Envision and Edwin AI, the first agentic AI built for IT. The platform allowed their IT teams to shift from reactive troubleshooting to strategic initiatives. This transformation is becoming essential as organizations balance multiple priorities:
- Managing AI workload performance across hybrid environments
- Optimizing resource allocation to control costs
- Meeting sustainability goals through efficient resource utilization
- Supporting continuous innovation while maintaining reliability
These interconnected challenges demand more than traditional monitoring capabilities—they require a comprehensive approach to infrastructure visibility and control.
The Strategic Imperative for Modern Data Centers
The message for CIOs is clear: as data centers evolve to support AI initiatives, full-stack observability becomes more than a monitoring tool. It’s a strategic imperative. Organizations need a partner who can deliver actionable insights at scale, helping them navigate the complexity of modern infrastructure while accelerating their digital transformation journey.
Welcome to the second installment of our Resource Explorer series. In this blog, we’ll discuss the practical aspects of getting started with LM Envision Resource Explorer. If you’re new to Resource Explorer or want to learn more about its benefits and features, we recommend checking out our first blog in the series.
For those ready to roll up their sleeves and start using this powerful resource management tool, let’s jump into the step-by-step guide on navigating, customizing, and maximizing Resource Explorer in your environment.
Navigating to Resource Explorer
Navigating to Resource Explorer is easy.
- Make sure the New UI is turned ON. It’s at the top of the navigation bar.

- Open Resource Explorer. Select it by Resource Explorer on the left-side navigation panel (your panel may be organized differently).

Understanding Resource Explorer views
Getting into a Resource Explorer dashboard is easy with a few preset views. There are two control areas in Resource Explorer: Filters and Groups.
- Filters will control what data is shown
- Groups control how data is shown
You can type the name of any tag into either area, and typeahead assist will guide you. This includes LogicMonitor properties, cloud tags, custom properties (such as from property sources), and CMDB-enriched tags. Add tags to either control and the system will automatically suggest some tags to help you get started.

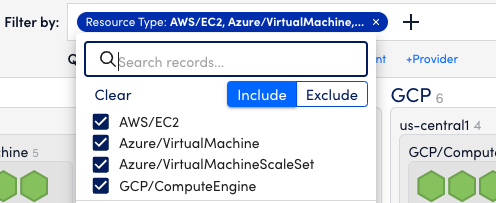
In this example, the Cloud IaaS view is filtered to only IaaS resources (virtual machines) from the cloud providers. Choose Resource Type and select to include those you wish.
In this example, the views are grouped by the cloud provider, operating region, and resource type. You can drag to reorder those tags if you want them to reflect different things. You can also save your views.

Saving your views
Once you’ve set up the right filters and groups, you can save the views to always be available. The following setup steps only need to be done once.
- Click the top-left of the view where it says Cloud IaaS in the following screenshot (yours will be different) to see the saved views.
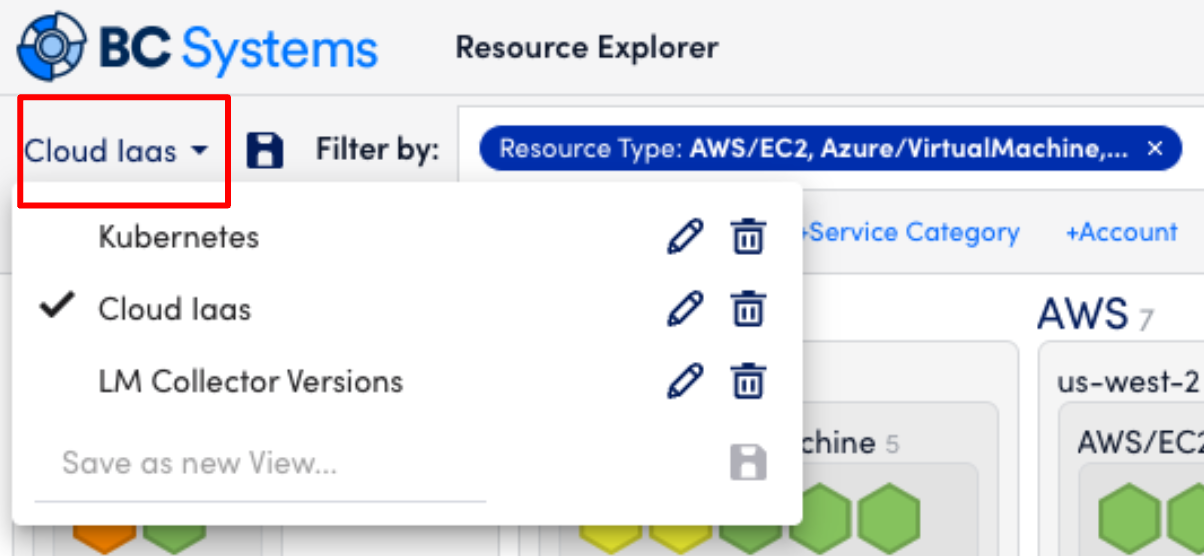
- You can save your own views. Presently, saved views are not shared across users.
Let’s walk through how to make a new saved view.
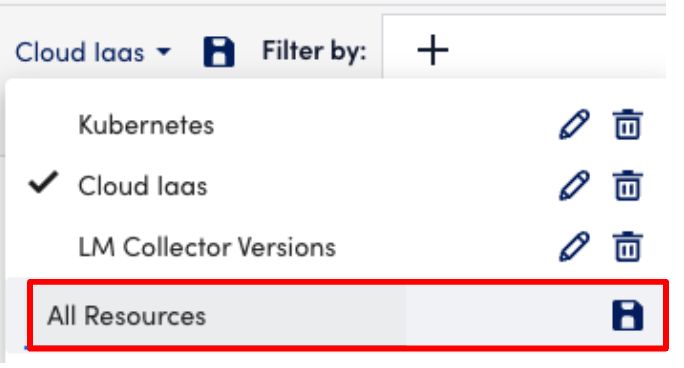
Making a saved view for all my resources
- “X” out existing filters and groups.
- Save a new view. Do not click the disk icon to the left of the filter; you will overwrite the existing saved view.
- Instead, click the current view name to open the dialog. At the bottom, type in a new name and save it. Name it All Resources.
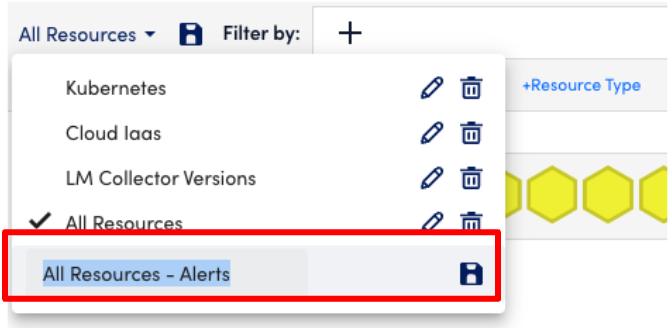
Making a saved view for only resources with active alerts
Maybe you only want to see the alerts that require attention. Are problematic resources all in one place or spread evenly? Different troubleshooting patterns emerge visually.
- Click to turn off the green resources.
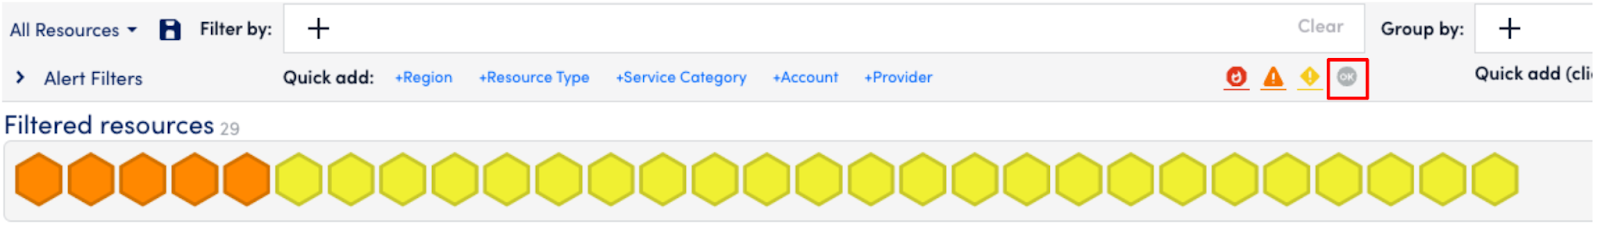
- Save this as another new view (don’t click save yet). Open the All Resources dialog and make a new name at the bottom. Then click the save icon for the new named view.
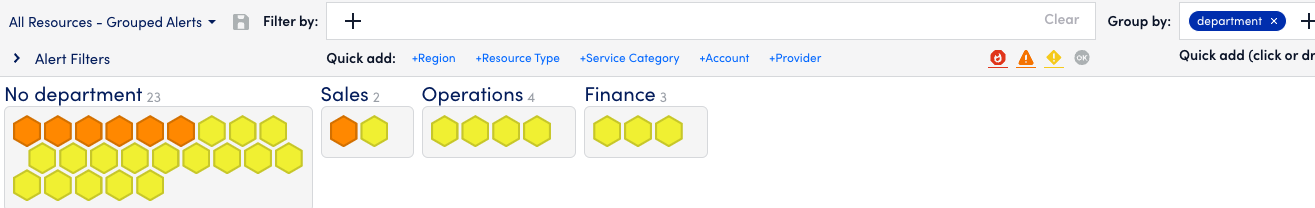
Making a saved view that organizes alerts by the teams that own them
You might have a tag for a department, owner, or something else. Use what you have to create views that matter to you.
- Click in the Group By and add department.
- Save the view like above but as All Resources – Grouped Alerts.

- It should now look like this:
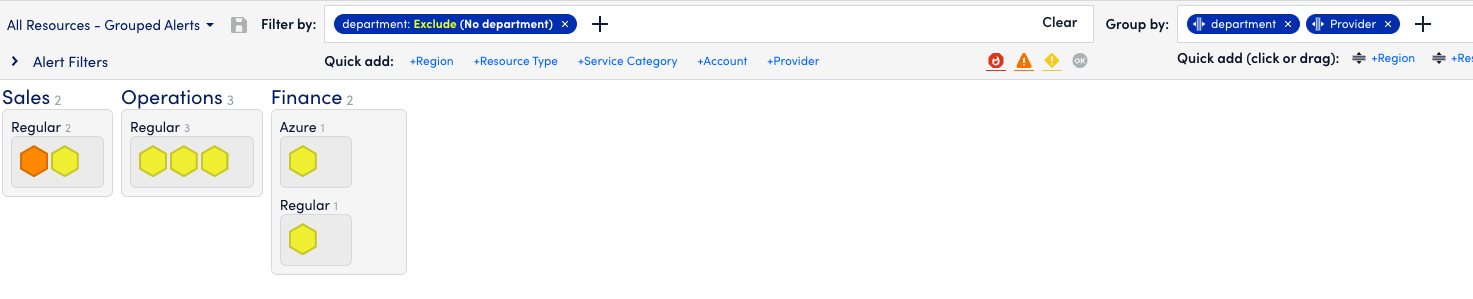
- Edit that view once more by adding Provider to the Grouping.
- Optional: Filter out No Department from the view if you wish.
- Save the view again (you can click the disk directly this time to overwrite).
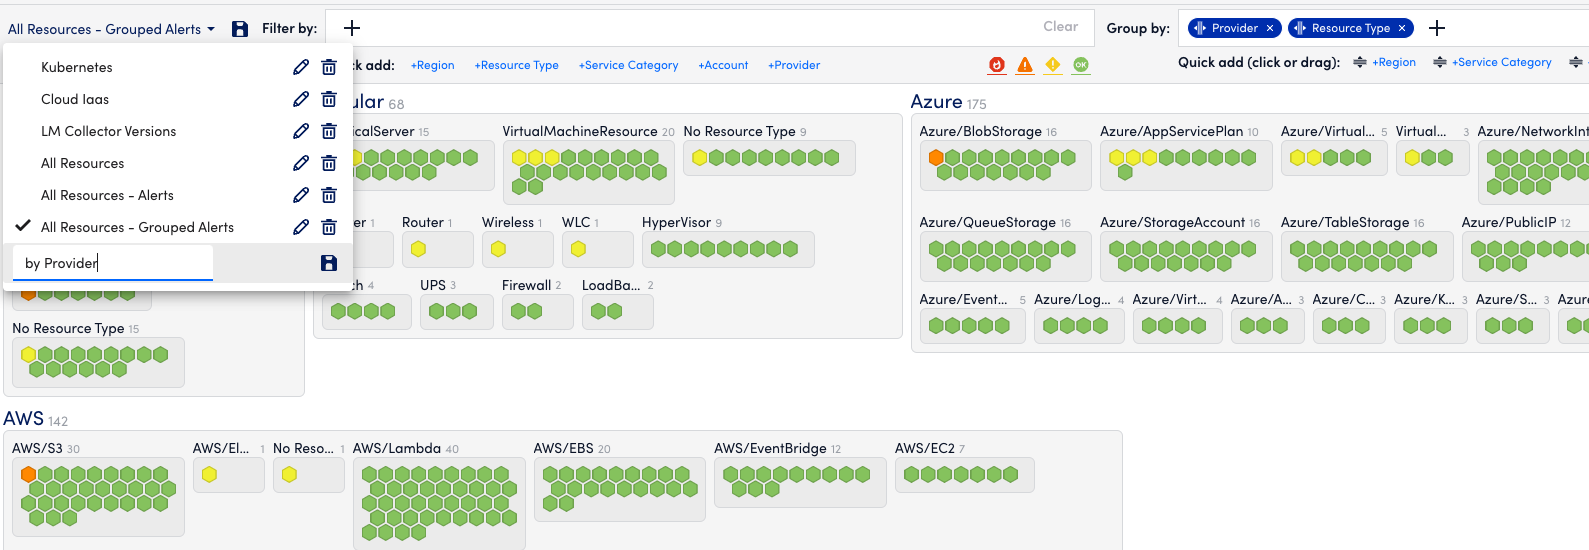
Making a saved view for all my resources, grouped by on-prem vs. cloud
- “X” out all the groups and filters again. Turn on the green resources again.
- On the Group By control, click the Provider choice in the Quick Add section.
- Repeat and add Resource Type.
- Save this as by Provider.
Organize network components by location, type, and model

Resource Explorer can be used to discover networking performance.
With this type of view, you can easily discover how network problems are unfolding.
To get the view above, which organizes your Meraki network components by location, type, and model, you would first filter by “meraki.api.network.name” and ensure that the property exists. Then group by the following:
meraki.api.network.name
Resource Type (which is an alias to multiple normalized tags!)
Auto.meraki.model
auto.os.version.description
LogicMonitor stands at the forefront of innovation in IT infrastructure monitoring, and our newest solutions help our customers optimize performance, manage costs, and gain deeper visibility into their network operations. Our vision is to empower businesses with the observability needed to navigate modern IT complexities with AI-powered solutions that drive efficiency.
The capabilities in our latest launch deliver enhancements that optimize operations for Platform Engineering and CloudOps teams to gain fast, actionable insights into cloud spend and cloud-managed network infrastructure. LogicMonitor helps shift operations teams’ focus on performance, cloud cost optimization, and efficiency, which unlocks growth and innovation.
Layered AI: Empowering ops teams with intelligent insights
LM Cost Optimization: Detailed visibility to align performance and cost
Platform Engineering and CloudOps teams are challenged with maintaining high levels of availability and efficiently using cloud resources, while preventing budgetary overruns and carefully managing costs. Addressing multi-cloud costs while optimizing performance across dispersed teams and applications is difficult with the sheer volume of resources. Making performance-impacting decisions requires deeper intelligence than what the native CSP solutions can provide.
LogicMonitor’s new Cost Optimization solution addresses balancing cloud performance with the cost of operations. LM Cost Optimization offers deep visibility into multi-cloud billing and AI-driven recommendations so teams can efficiently manage and optimize cloud investments. Layered into Hybrid Observability, LM Cost Optimization quickly and intelligently balances performance and cost management, paired with continuous telemetry and insights derived from the LM Envision platform.
LM Cost Optimization includes two key capabilities:
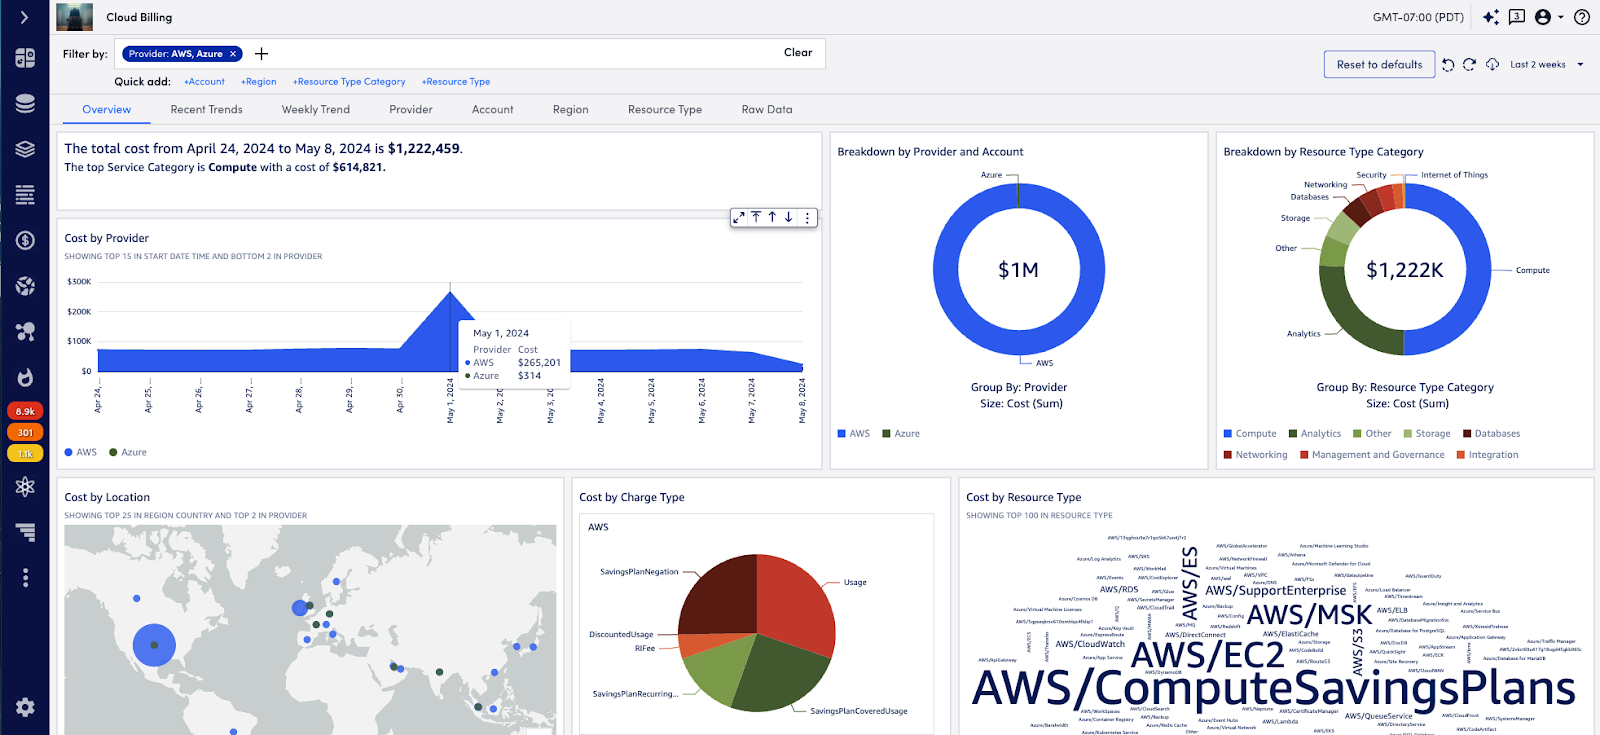
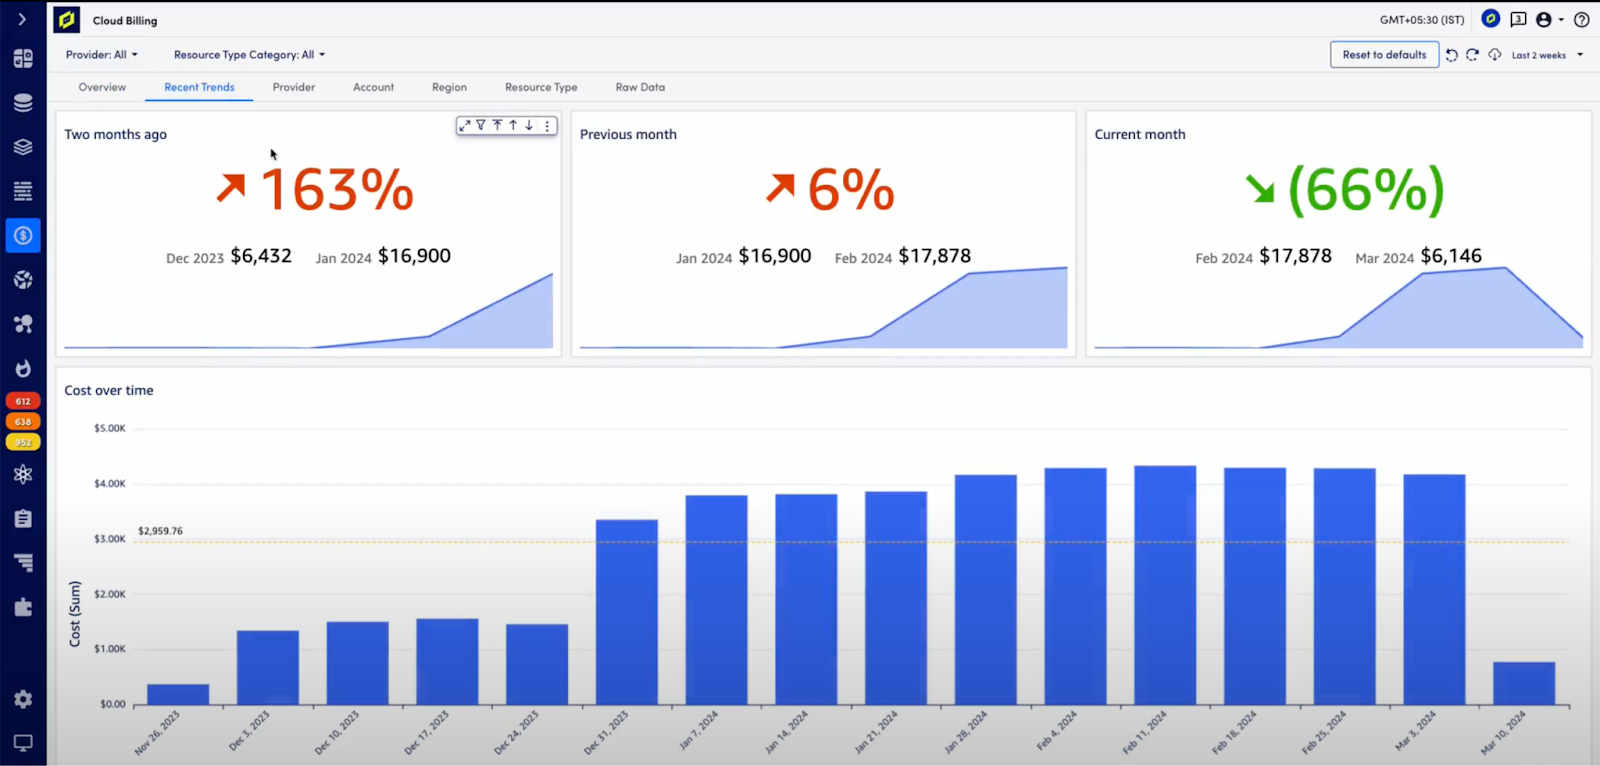
- Cloud Billing: Provides a detailed, unified view of multi-cloud (Amazon Web Services [AWS] and Azure) organizational spending. This allows teams to analyze cost data using normalized, filtered tags such as account, region, provider, resource type, and more. Additionally, customers can optimize cloud costs based on any cloud tag. With this detailed cost visibility, teams can spot trends, identify spikes and resource changes, and determine strategies for improving cost management. Teams gain deeper cloud cost insights and are empowered to make data-driven decisions that are important to their business.

- Cloud Recommendations: AI-powered recommendations to instantly modify cloud resource usage and reduce costs while balancing performance. Available for AWS compute and storage, Cloud Recommendations offers targeted recommendations to optimize platforming decisions. Leveraging observability metrics from the LM Envision platform, performance evidence increases confidence around the recommendation. This gives users deep knowledge of surrounding criteria before taking action. Organizations can manage their most expensive cloud resources and reduce expenses without compromising service levels.

LogicMonitor helps customers during and after cloud migrations to eliminate over-provisioned resources, reduce costs, and continually monitor performance. LM Cost Optimization equips organizations with the insights required to deliver highly available, reliable, and cost-effective services to their customers.
Cloud-Managed Networking
Edge and IoT requirements drive substantial data and telemetry, which has increased the need for enterprise-grade wireless coverage. Additionally, the increase in return-to-work mandates has uncovered the need for more modern wireless technologies, which has driven the need for reliable cloud-managed networking capabilities. Due to the increased demand in network infrastructure, the need to monitor and support these areas for our customers has accelerated.
This trend in network management involves new approaches: APIs, streaming telemetry, cloud-hosted, and SaaS-based. These approaches provide faster discovery time, a reduced need for SNMP polling (observability and devices), and push alerts and metrics from management platforms.
LM Envision continues to lead enterprise wireless coverage with a new integration with Ubiquiti UniFi. This integration allows LogicMonitor to offer out-of-the-box monitoring coverage for several industry-leading enterprise wireless vendors, including Cisco, Juniper, and Ubiquiti.
With the addition of Cato SD-WAN monitoring, LM Envision further strengthens LogicMonitor’s position as the leading Hybrid Observability platform for SD-WAN. This enables network operations teams to be agile, efficient, and flexible. LM Envision is supporting customers on that journey. Our customer’s management platform of choice continues to be an integrated partner in the customer’s observability solution.
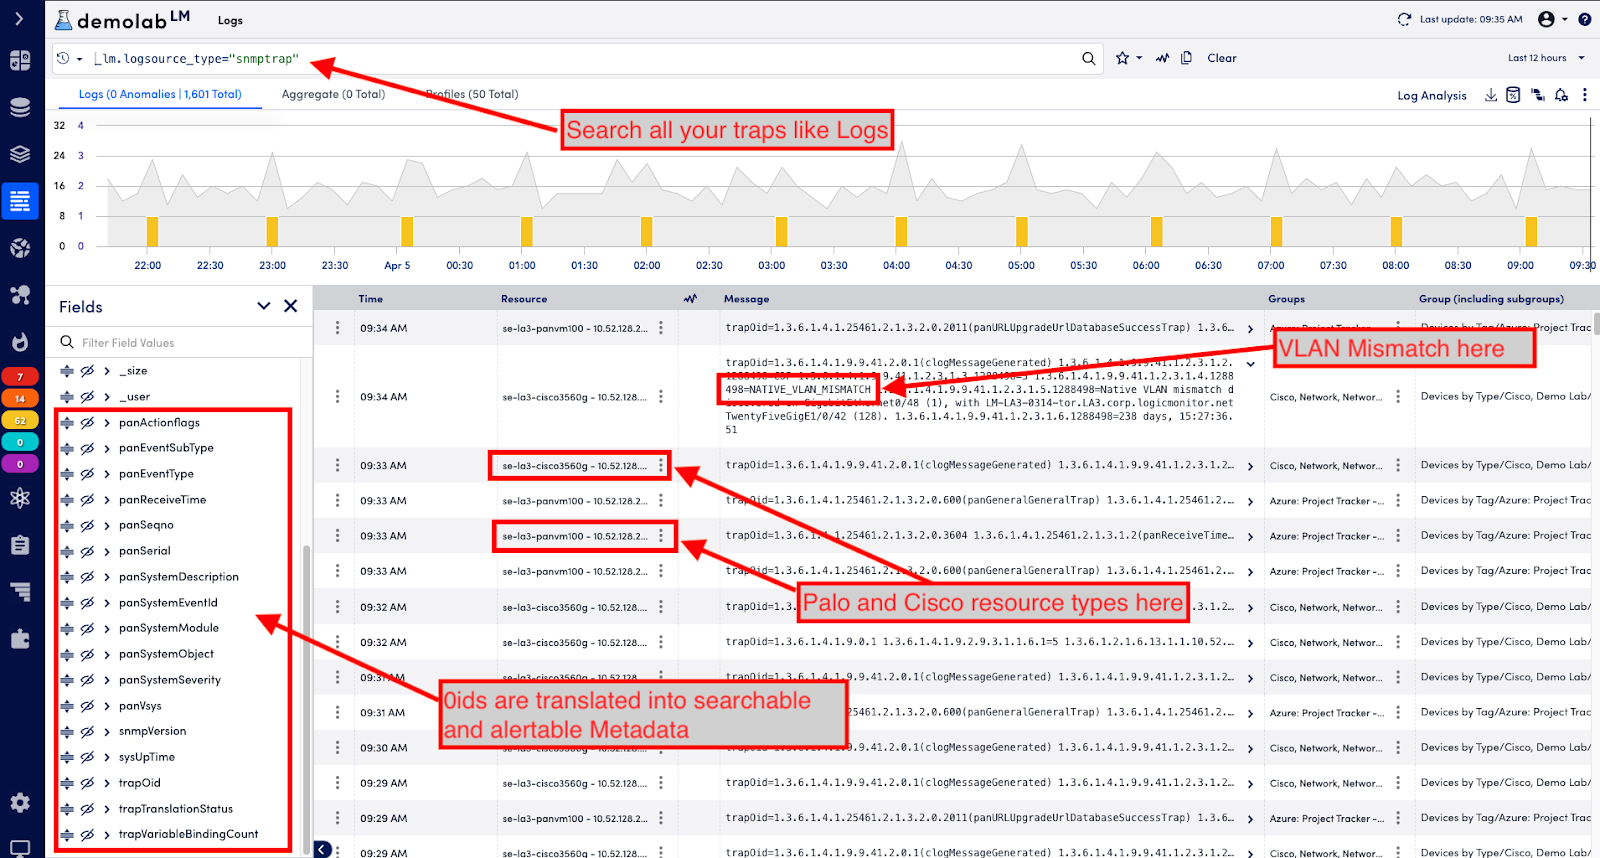
Customers can also derive greater value from SNMP traps in LM Logs. By enabling SNMP traps as a log source, traps can be retained, queried, and leverage new AI features such as anomaly detection for logs. SNMP traps can now be viewed in the same place as other network-relevant logs, such as syslog, network vendor proprietary logs, and others. Combined with stateful alert clearing, SNMP traps are treated holistically. Meta-data, resource mappings, and filters can also be applied to SNMP trap log records. Finally, through log alerts, SNMP traps can now be leveraged in strategic platform directions, including Dexda’s AI-based event correlation.

Hybrid Observability powered by AI
LogicMonitor’s latest innovations expand the benefits of hybrid observability telemetry and data. We’re innovating and significantly driving efficiency by integrating LM Cost Optimization, enhanced SD-WAN monitoring, and cloud-managed networking enhancements. These developments empower our customers with the tools and insights needed for unmatched operational excellence.

IT operations are a constant juggling act. Too many tools, too much data, and not enough time to proactively avoid outages. But what if AI could not only streamline your tools but help you make sense of the chaos? That’s the power of AIOps.
What is AIOps?
To understand AIOps and its evolving landscape, one needs to grasp its basics and current trends.
AIOps stands for Artificial Intelligence (AI) for IT Operations. It is a set of AI-driven technologies designed to improve the efficiency and automation of IT operations.
AIOps vs. Generative AI
AIOps is different from generative AI. Generative AI (GenAI) can generate text, images, or other media using generative models. Its applications range from chatbots to complex creations like art and music. Large Language Models (LLMs) are vital to GenAI. They, use massive datasets to understand, summarize, create, and predict new content.
Current trends in AIOps
Current AIOps trends show a shift to easier data accumulation. Both on-premise systems and cloud providers offer accessible REST APIs and open telemetry. This change lets enterprise IT teams get real-time insights from huge data lakes and IT tools. They leverage technologies like machine learning (ML), AI, natural language processing (NLP), and GenAI.
The challenge: DIY vs. off-the-shelf AIOps
Choosing between custom DIY and off-the-shelf options has its own challenges. While open-source options are available, they may require longer periods (18-24 months) to show value, necessitating ongoing security and technology updates.
The AIOps hype cycle is in full swing. It reflects the growing focus on leveraging AI to improve IT operations and observability. To turn hype into reality, IT leaders need to address common pain points.
Solving IT alert fatigue and data overload with AIOps
Addressing pain points in AIOps involves understanding the many challenges faced by IT teams and executives. IT teams are overwhelmed. Alert fatigue, constant context switching, and an overwhelming amount of data without actionable insights impact day-to-day operations and decrease efficiency.
For IT executives, the challenge is managing expectations. They have to do more with fewer resources. They must also use automation and efficiency to improve business availability and prevent negative publicity from service downtimes. Outdated manual workflows and tools make this even harder
Even with a tool migration, changing underlying IT processes is a culture shift. It demands extensive teamwork and reorientation, often proving more challenging than anticipated. This slows the path to desired efficiencies and business outcomes in AIOps.
The convergence of AIOps and hybrid observability
The convergence of AIOps and hybrid observability represents a significant shift in addressing modern IT challenges. This convergence is essential because of how applications are built and monitored. It requires addressing streams, traces, and metrics from various sources. This is different from traditional observability tools—highlighting the need for diverse tools to serve both legacy and modern observability stacks.
AIOps tools once focused on alert data from various sources. But convergence changes everything. Think of it as a discovery engine for hybrid infrastructures. It gives full access to rich contexts for AI/ML models. This means being able to ‘see’ the devices, and how they are being deployed for deeper troubleshooting.
For example, understanding all aspects of a switch (model, location, firmware) is key, but so is the broader context. If it’s connected to an Amazon EC2 instance, knowing the application, owner, and environment (production or lab) is vital for management.
The result: Faster problem-solving and IT efficiency
This convergence brings substantial business benefits. It speeds up troubleshooting during critical issues (P1 situations) and allows more efficient models to compress alerts in real-time. This significantly enhances IT operations’ responsiveness and effectiveness.
Developing a winning AIOps strategy
The key to a successful AIOps strategy is aligning it with your business goals. Here’s how to get started:
- Realistic vision: Establish a two-year realistic vision with clear milestones. This allows for a focused strategy that can adapt to rapid technological changes and business needs.
- Prioritize use cases: Identify and prioritize the most important use cases. Understand your exact challenges and opportunities. Address them in order of business impact and need.
- Tool/skills gap analysis: Evaluate your existing tools and skills, and identify any gaps. Assess your current abilities for your chosen uses. Make any needed changes..
- Align with business goals: A winning AIOps strategy isn’t just about technology. It’s about ensuring it delivers tangible business value. Have regular touchpoints with the management team. This is to ensure that everyone is on the same page, using the same tools, data, and context.
This holistic approach promotes collaboration. It avoids the pitfalls of siloed operations, leading to a more cohesive and effective IT environment.
LogicMonitor: Your hybrid observability solution powered by AI
LogicMonitor integrates AIOps strategies into its platform. This transforms IT environment monitoring and management. Its agentless, lightweight technology aggregates diverse telemetry into a unified system. This streamlines administration and enhances operational efficiency.
The platform uses AIOps to offer deep insights, showing a comprehensive, anomaly-focused resource view for proactive management. This allows for the early detection of potential issues and furnishes predictive insights, leading to timely resolutions.
LogicMonitor’s innovative alert system provides contextual information, fostering team efficiency and a collective understanding of deployment scenarios. These advancements reduce outage risks, expedite incident responses, and shift focus from reactive to strategic, innovative IT operations.

Discover how LogicMonitor can help. Download the “AIOps for Monitoring” eBook, or email [email protected] to get started with a free demo.
by Sarah Terry, Senior Director of Product Management & Beth Winters, Senior Product Marketing Manager
At LogicMonitor, we are deeply committed to a mission that goes beyond the conventional: revolutionizing IT monitoring through hybrid observability powered by AI. This ambition is not merely a slogan but the cornerstone of our entire approach. Our LM Envision platform was purposely designed to bring together diverse IT environments under one seamless, integrated experience.
Enterprises have complex IT ecosystems. By delivering comprehensive visibility into your IT infrastructure—whether it’s on-premise, hybrid, or cloud-based— we help organizations streamline operations, minimize expenses, and grow with confidence.
LogicMonitor’s hybrid observability approach empowers IT and CloudOps teams through relentless focus on our three pillars of innovation:
- Layered Intelligence in every aspect of our platform
- Delivering a Unified Experience
- Extensive Hybrid Coverage
Our latest features support these pillars by helping organizations deliver high service availability, reduce the time required to solve problems, and identify root causes faster.
Interested in learning more? Join us for the accompanying Winter Release webinar, titled “Unleashing Hybrid Observability: LogicMonitor’s Latest Product Innovations.” This will take place on Tuesday, February 27th at 11 am PST, where our product team will demo the new capabilities described below!
Modern IT Operations Observability Challenges
In the rapidly evolving digital landscape, modern IT teams face a multifaceted set of challenges that test their agility, efficiency, and innovation. These challenges, while distinct, are deeply interconnected, impacting the ability of organizations to maintain a competitive edge and operational excellence. Here, we delve into the core issues confronting today’s IT operations teams and explore strategic approaches to overcome them.
High Complexity
- Modern IT environments blend legacy systems, cloud platforms, and new technologies, creating significant complexity. This mix, alongside rapid application and infrastructure growth, challenges visibility and control.
- A widening skills gap, due to rapid tech advancement exceeding the supply of skilled professionals, further complicates efficient IT ecosystem management.
Addressing these issues requires robust observability solutions and a strategic focus on workforce development.
Efficient Operations
- The spread of IT assets across various domains leads to governance, cost, and focus challenges, a situation worsened by a traditional, reactive approach to incident management.
- IT teams under pressure to achieve more with less need solutions that automate tasks, optimize resource management, and improve incident response times.
Adopting such technologies allows a shift from reactive to strategic operations, boosting service levels and operational flexibility.
Speed of Innovation
- Aligning IT more closely with business goals is crucial for fostering service agility and innovation.
- Challenges like cloud migration and overcoming the perception of IT as an innovation barrier necessitate reevaluating IT’s organizational role.
- Embracing agile methodologies, continuous delivery, and a culture of experimentation and quick iteration are key.
By positioning IT as a strategic business asset, organizations can create an environment that supports and drives growth and transformation.
Why LM Envision
Our LM Envision platform integrates AI-driven insights, automation, and cloud-native capabilities to streamline and simplify IT operations. This enables IT businesses to effectively tame complexity, boost operational efficiency, and foster innovation at an accelerated pace.
We want to transform IT teams from a support role into a key driver of business success. This will empower them to not only anticipate and respond to current demands but also to shape future technological landscapes.
What’s New in Layered Intelligence
LM Co-Pilot (Preview)
LogicMonitor’s new Generative AI tool, LM Co-Pilot, revolutionizes account setup and day-to-day administration. With its interactive dialogue and real-time assistance, it accelerates processes, reduces errors, and enhances the user experience. By simplifying manual multi-step workflows and multi-page administrative tasks (like adding devices or new users) into a curated, chat-like experience, LM Co-Pilot frees up IT teams to work on more engaging tasks.

Currently, LM Co-Pilot is only available in preview mode. If you want to participate in our Controlled Availability program, please contact your LogicMonitor account representative.
Stay tuned in the coming months as we roll out new LM Co-Pilot capabilities, including Support, which will leverage Natural Language Processing (NLP) to summarize documentation and answer queries about LM Envision features, and Troubleshooting, which will automate workflows for rapid troubleshooting and resolution of complex hybrid infrastructure issues.
Log Analysis (Preview)
When troubleshooting business-impacting events in a hybrid environment, users typically need complex queries to scan logs across the different services, applications, and resource types (e.g., network devices, load balancers, databases, and cloud resources). This time-consuming process usually requires deep domain knowledge.

Log Analysis simplifies troubleshooting by quickly surfacing contextually relevant logs through advanced ML techniques and visual filtering. Log Analysis automatically analyzes and categorizes log messages, providing sentiment scores based on log level, keywords, negative phrases, and custom dimensions. This helps users quickly detect the severity of log messages and prioritize the key phrases that apply to their most pressing issues.
Now, time-consuming work such as determining severity and finding relevant logs is handled by LogicMonitor’s AI, which enables operations and support teams to be more effective when solving problems.

Edwin AI
Edwin AI puts AI to work and supercharges IT productivity by automating alert correlation, contextualization, prioritization, and incident management, all personalized to a business’s unique needs. Edwin AI extracts the richest, most relevant context from LogicMonitor and ServiceNow CMDB for a highly accurate and customizable correlation.
Let’s say a core switch link has gone down due to a config issue in your campus, generating an alert storm with hundreds of access points and switches being impacted. Edwin AI will combine the context of devices as switches, APs, and campus location from LogicMonitor to help correlate this storm of alerts into a single actionable insight. Edwin AI automatically summarizes all the underlying events for the level one NoC engineers in the ServiceNow ticket.
By combining natural language processing and unsupervised machine learning, Edwin AI cuts through the noise to elevate the most important issues. As a result, IT and CloudOps teams can diagnose problems faster, reduce MTTR, increase efficiency, and prevent problems from exploding into costly downtime and business-critical incidents. Dexda acts as a single source of truth across your entire environment, optimizing incident response and accelerating MTTR.
Unlike other solutions, Edwin AI uses open and customizable Machine Learning models, offering personalized IT at scale. Essentially, it’s like having an extra ITOps engineer on your team!
Ready to gain better context into issues you’re already collecting with LogicMonitor’s personalized approach to AIOps? Reach out to your LogicMonitor account representative, or email us at [email protected] to get started with Edwin AI today!
What’s new in Unified Experience
New User Interface (GA)
Introduced over the summer, our new user interface (now GA) has a more modern look and feel. It demonstrates LogicMonitor’s mission of creating an industry-leading Unified Experience across all IT environments: hybrid, cloud, and on-prem.
This quarter, we’ve added a new log dashboard widget that displays logs for a single resource or group of resources. Thus making it easier than ever to share aggregated log information with stakeholders for faster troubleshooting.
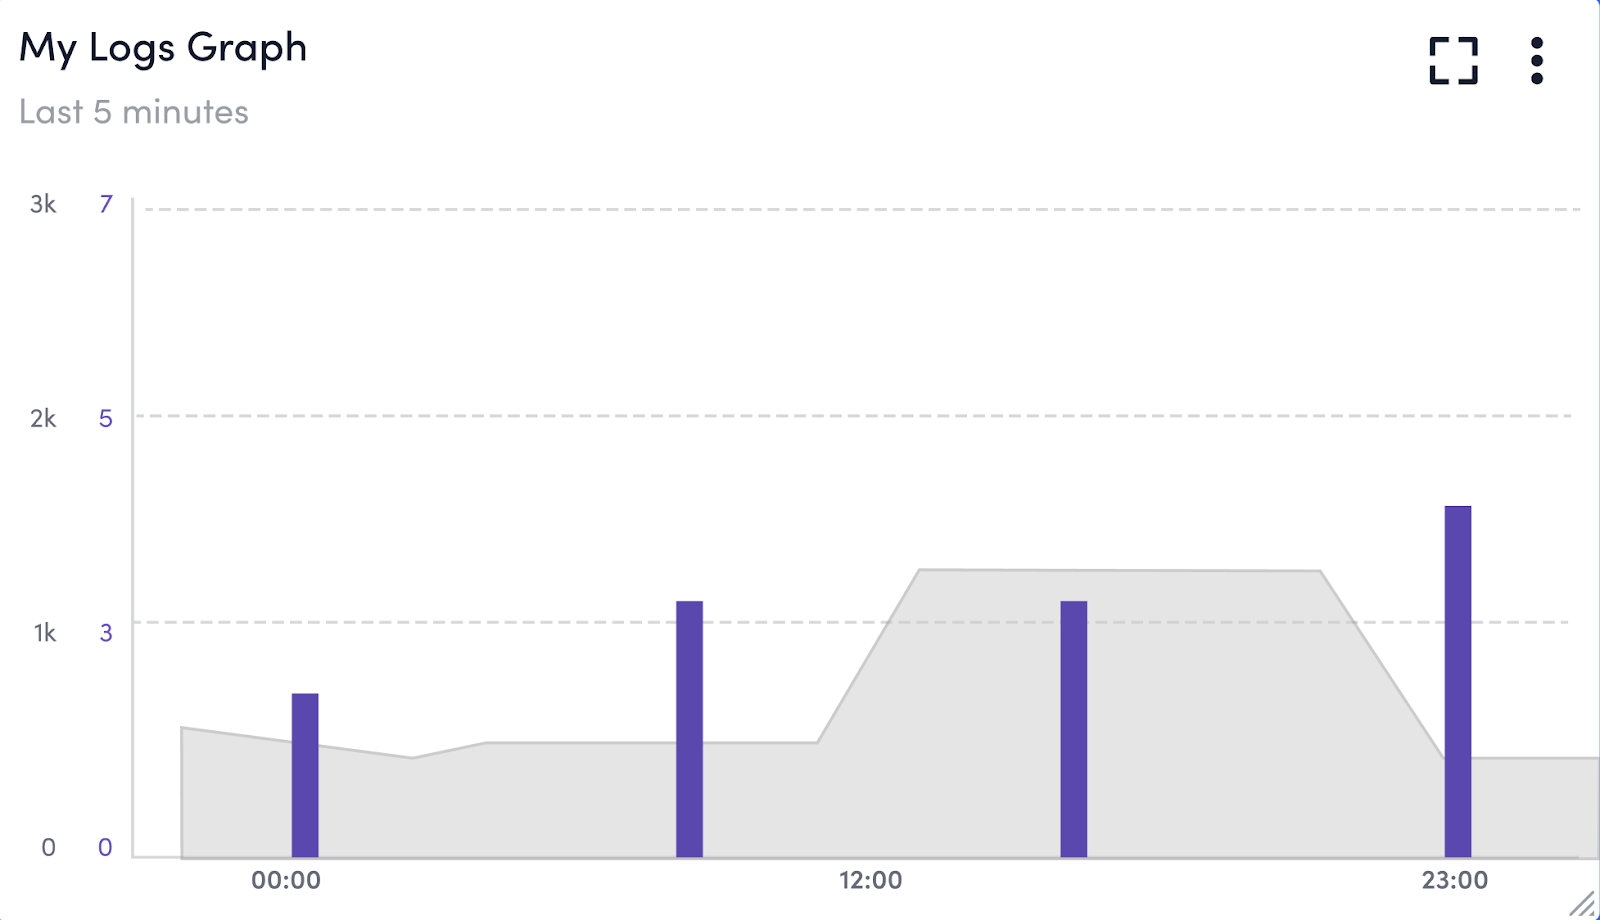
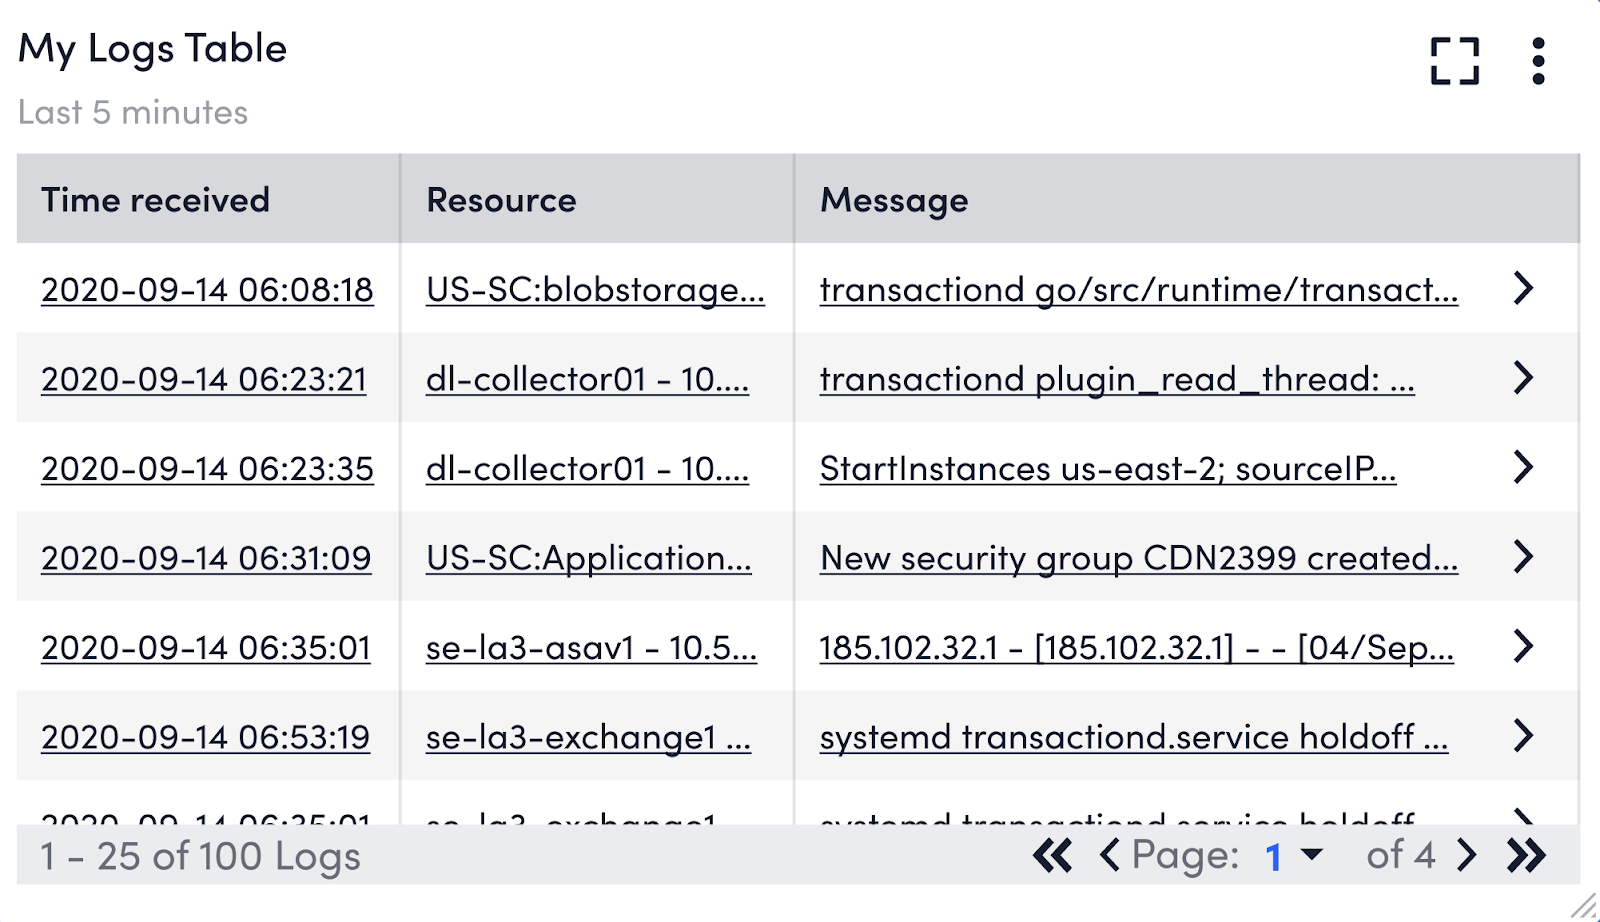
LM Envision’s latest features, like the log dashboard widget, are being added exclusively to the new user interface. Simply toggle on the “New UI Preview” button to take advantage of the log dashboard widget and other new features such as:
Click here for more information on the new UI or visit the documentation.
Resource Explorer (GA)
As highlighted in the fall release blog, LM Envision’s new Resource Explorer (now in GA) helps operations teams quickly organize and visualize their entire hybrid multi-cloud environment in just a few clicks.
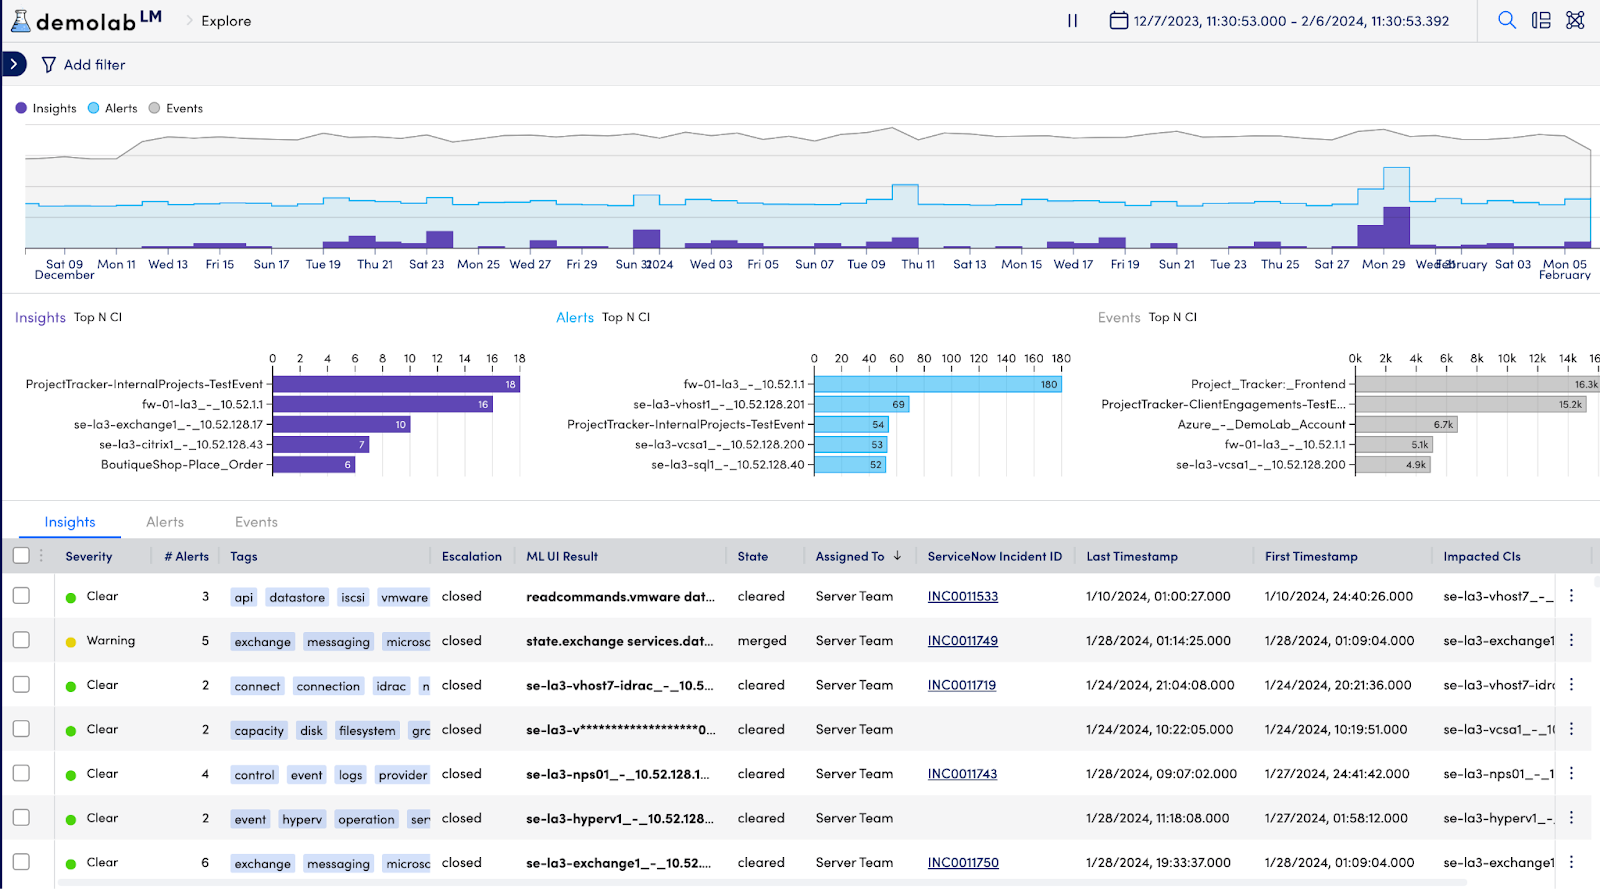
Resource Explorer surfaces key insights into business performance by clearly displaying overall resource and application health. Teams can easily isolate high priority issues for faster speed of execution and greater agility with comprehensive visibility across thousands of resources in a single, organized view. Easily filter and group views based on tags such as location, cloud provider, alerts, and more to spot problems, reduce unplanned downtime, and maintain your service levels.
As a reminder, you must toggle on the new UI to take advantage of Resource Explorer. For more information, watch the demo or check out the documentation!

Organize on-premises and multi-cloud resources in a single view.
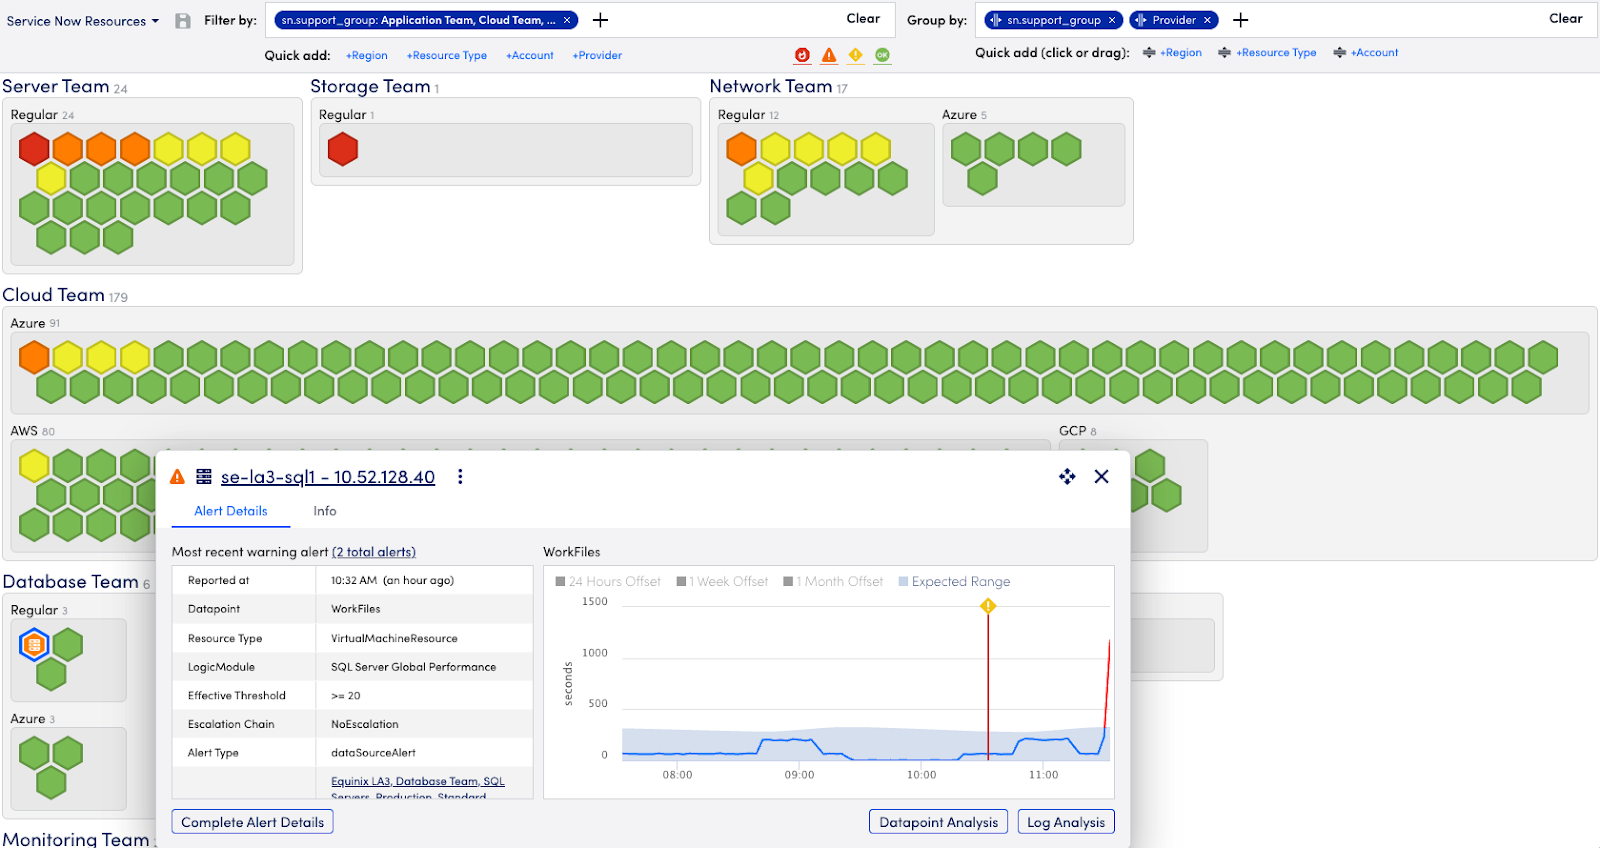
Drill down into a resource at a known location to isolate an issue.
What’s new in Hybrid Coverage
Cloud-Managed Networking
There are many areas in which IT teams are modernizing their network services and infrastructure, including SD-WAN, Cameras, Environmental Sensors, and Wireless Access Points. Whether augmenting or pivoting from MPLS/VPN connectivity services to SDN or embracing cloud-managed networking, LogicMonitor continues to expand its breadth of coverage and deliver on our promise of unified hybrid observability.
Several previously previewed capabilities are now Generally Available, including support for:
- VMware SD-WAN (formerly VeloCloud)
- Cisco Catalyst Center-managed Wireless Access Points
- Cisco Meraki Wireless Access Points
- Cisco Meraki Environmental Sensors
Our integration with Cisco Catalyst Center (previously Cisco DNA Center) is of particular note.
For more information, check out these additional resources:
Forward Together
Our journey is far from over. As we continue to innovate, our focus remains on empowering our customers with the solutions and insights needed to achieve operational excellence. Hybrid Observability powered by AI isn’t just what we do—it’s who we are. We’re excited about the future and invite you to join us on this transformative journey.
In our pursuit, we’re not just aiming to lead; we’re striving to change the game. By continuously evolving and adapting, we’re not only meeting the needs of today’s digital world but also shaping the future of IT monitoring.
Welcome to the next chapter in IT innovation. Welcome to LogicMonitor’s vision of Hybrid Observability powered by AI. To learn more about our latest innovations, make sure to join our upcoming webinar, “Unleashing Hybrid Observability: LogicMonitor’s Latest Product Innovations”
Simple Network Management Protocol (SNMP) provides a standard message format that devices being monitored and monitoring systems can all speak – even though they will be running different operating systems. SNMP is the most widely deployed management protocol; it is simple to understand (although not always to use), and enjoys ubiquitous support.
The following eBook helps to decode SNMP and the three commonly used versions, defines common acronyms used, and teaches the best practices of configuring and monitoring SNMP.
What is SNMP?
SNMP stands for Simple Network Management Protocol. In real life, it is often not simple; does not only apply to network devices; and often cannot be used for management of devices, only monitoring. It is definitely a protocol, however.
SNMP stands for Simple Network Management Protocol. SNMP provides a standard message format that devices being monitored and monitoring systems can all speak – even though they will be running different operating systems.
SNMP is mainly used for the collection of data about devices, such as CPU load, memory usage, etc. SNMP is supported on practically all network equipment (switches, routers, load balancers, for example), but also on most server operating systems, some storage devices, and even some server application software. However, the extent of what “supporting” SNMP really means can vary wildly, but more on that later.
If you’re reading this, you are probably responsible for the performance, availability and capacity of some IT infrastructure. (If you are reading this because you thought it was the complete guide to the State of New Mexico Police – this is not for you.) If you have a nontrivial (i.e. greater than zero) amount of IT infrastructure whose availability matters – because it generates revenue or enables others to do their jobs – then you need a way to be sure your infrastructure is working, and working well. If you want to sleep, you need an alternative to staying up all night watching the output of the command line tool top to watch the processes on your server. Especially if you have 1000 servers and 100 routers.
The standard way to solve this is to run a monitoring system, which queries the servers, routers, switches, and other devices, asks them how they are doing, and generates alerts (which you can receive via email, text, or voice call) if any of them report they are not doing well. (This is the computer equivalent of your mother calling your sister to see how she is doing, and then calling you with any bad news.)
SNMP provides a standard message format that the monitoring system, routers, switches, servers, storage arrays, UPS devices, etc., can all speak – even though they will be running different operating systems. Of course, there are different versions of SNMP, and different security issues, and different types of information that the different devices can report.
But if you are responsible for ensuring the performance, availability and capacity of your infrastructure, enabling and using SNMP and a monitoring system to collect and alert on data is the way to go. This system can scale from monitoring one device to tens of thousands, alerting you when something is wrong (and hopefully, letting you sleep when everything is OK.)
How SNMP Agents and Network Management Stations work
Discussions about SNMP often involve two concepts: SNMP agents, and Network Management Stations. To put it simply: a Network Management Station (NMS) asks questions; an SNMP agent answers them.
The SNMP agent is a software process that receives SNMP queries, retrieves the data being asked for, and replies back. Most routers, switches, firewalls, and other systems without a full operating system will have SNMP support built in to the software. General purpose servers (Linux, Solaris, AIX, Windows, FreeBSD, etc) may not have an SNMP agent installed by default, depending on the installation options chosen, but one can be added at any time. The most common SNMP agent for Linux and Unix based systems is the net-snmp agent, which runs as snmpd (the SNMP Daemon.) Installing, configuring and running this agent will add SNMP support to any system that supports it.
A Network Management Station is harder to pin down. It could be anything from a single linux machine with snmpwalk that is used to do ad hoc command line queries against devices, to a simple management system like What’s Up Gold, to a complete powerful system like LogicMonitor (where the collectors initiate the SNMP questions, but the storage, analysis, and alerting is centralized in a SaaS infrastructure.) But as noted above: if a system initiates SNMP questions, it can be thought of as an NMS. (Note that a system can have both the SNMP agent and an NMS installed.)
Both SNMP agents and NMS’s will talk SNMP to each other: i.e. a defined IP protocol – the standard message format mentioned earlier.
A Guide to SNMP’s Key Acronyms: SMI, MIBs, OIDs and other TLAs
Any discussion of SNMP will soon involve a selection of acronyms. We’ll explain the most common here.
SMI: Structure of Management Information.
SMI is a subset of ASN 1 (Abstract Syntax Notation One – which, in the context of SNMP, you do not need to know anything more about. You can read “SMI” wherever you see “ASN.1”.) SMI is basically the syntax that MIBs are written in, defining the data types available, and how to reference other MIB files. For example, SMI v2 defines a TIMETICK object as:
TIMETICKS
The TimeTicks type represents a non-negative integer which represents the time, modulo 2^32 (4294967296 decimal), in hundredths of a second between two epochs. When objects are defined which use this ASN.1 type, the description of the object identifies both of the reference epochs.
The TimeTick type can then be used to define other objects in the MIB.
MIB: Management Information Base.
A MIB is usually a plain-text file, that defines the database of entities, in a tree structure, that is the set of management information available on an SNMP agent. Each object in the MIB file has an Object Identifier.
OID: Object Identifier.
This is simply a way to uniquely identify an object in a tree. Each number in the OID identifies a node in the MIB tree. The important thing to remember is that each complete OID represents a single object in the MIB – usually this means one specific question that can be asked of the SNMP agent, and you arrive at that object by traversing down the tree, starting from the root node.
For example, you can see the OID .1.3.6.1.2 refers to the Management node in the diagram below.

Each organization manages or delegates management for the numbers below it. Thus the ISO – the International Organization for Standardization – (.1) allocated .1.3 to mean Identified Organization, and .1.3.6 to mean the Department of Defense (reflecting the Internet’s origins as a U.S. Defense Research Project.)
In practice this means that every OID you will deal with will either begin with .1.3.6.1.2 (the standard Management OIDs, that are vendor neutral); or .1.3.6.1.4.1 (the private OIDs. Each vendor can be assigned their own private number below .4.1, and then manage their own OID objects below this. Cisco Systems was allocated .9 – thus all Cisco Systems OIDs, for information they want to return that is specific to Cisco equipment, is under .1.3.6.1.4.1.9.)
You can see a complete list of enterprises that have been assigned private OID numbers at: http://www.iana.org/assignments/ enterprise-numbers/enterprisenumbers.
An example of a MIB file is this extract from the RFC1213 MIB on the right:

This long text file extract above defines the object .1.3.6.1.2.1.1.1.0 to be the sysDescr object, and specifies that when an SNMP agent is queried for this OID, it should return a textual description of the system.
To make this all a little less abstract, we can perform this query using a simple tool snmpwalk, that is included in most Linux packages:
Here, we query a Linux server for the OID .1.3.6.1.2.1.1.1.0:
[demo1.dc7:~]$ snmpwalk -v1 -cSecret 127.0.0.1 .1.3.6.1.2.1.1.1.0Its response tells us its system description:
SNMPv2=MIB::sysDescr.0 = STRING: Linux demo1.logicmonitor.net
2.6.32-358.6.2.el6.centos.plus.x86_64 #1 SMP Thu May 16 17:43:34 UTC
2013 x86_64
Here we query a Cisco switch:
[demo1.dc7:~]$ snmpwalk -v1 -cSecret sw-core2 .1.3.6.1.2.1.1.1.0Which returns a different description:
SNMPv2=MIB::sysDescr.0 = STRING: Cisco IOS Software, C3560 Software
(C3560-IPSERVICESK9-M), Version 12.2(58)SE1, RELEASE SOFTWARE (fc1)
Technical Support: http://www.cisco.com/techsupport
Copyright (c) 1986-2011 by Cisco Systems, Inc.
Compiled Thu 05 May 11 02:19 by prod_rel_team
One thing to note is that OID’s can represent objects in a table, if the SNMP agent may have multiple items with the object in question. In this case, each row in the table will be about one of the items. For example, interfaces – there is an OID for the Interface Description; and another for the number of Octets received on that interface. But a computer may have many interfaces
Versions of SNMP
There are three commonly used versions of SNMP.
SNMP version 1: the oldest flavor. Easy to set up – it only requires (and only supports) a plaintext community. The biggest downsides are that it does not support 64 bit counters, only 32 bit counters, and that it has little security.
SNMP version 2c: in practical terms, v2c is identical to version 1, except it adds support for 64 bit counters. This matters, especially for interfaces: even a 1Gbps interface can wrap a 32 bit counter in 34 seconds. This means that a 32 bit counter being polled at one minute intervals is useless, as it cannot tell whether successive samples of 30 and 40 are due to the fact that only 10 octets were sent in that minute, or due to the fact that 4294967306 (2^32 +10) octets were sent in that minute. Most devices support snmp V2c nowadays, and generally do so automatically. There are some devices that require you to explicitly enable v2c – in which case, you should always do so. There is no downside.
SNMP version 3: adds security to the 64 bit counters. SNMP version 3 adds both encryption and authentication, which can be used together or separately. Setup is more complex than just defining a community string – but then, what security is not? But if you require security, this is the way to do it.
So which should you use?
The only security measures for SNMP versions 1 and 2c are a community string sent in plaintext, and the ability to limit the IP addresses that can issue queries. This is effectively no security from someone with access to the network – such a person will be able to see the community string in plaintext, and spoofing a UDP packet’s source IP is trivial. However, if your device is set up to only allow SNMP read-only access, the risk is fairly small, and confined to
evil people with access to your network. If you have evil people with this access, people reading device statistics by SNMP is probably not what you need to be worrying about. So, if you can accept the weak security model of SNMP v2c, use that. If not, use V3 with encryption and authentication.
Questions, Answers and Traps
There are two methods of information transfer in SNMP. One is to query an OID, and receive an answer (given that this act of querying is usually done periodically, this is often called polling.) In order to check the temperature of a Cisco device, you can poll the rows of the OID table .1.3.6.1.4.1.9.9.13.1.3.1.3 to get the temperature, and .1.3.6.1.4.1.9.9.13.1.3.1.6 to see if the temperature is triggering any warning or error states.
The other method of information transfer is to use Traps. Traps are initiated by the SNMP agent. i.e. instead of the NMS polling an OID periodically to see if the temperature state is a cause for alarm, the device can just send the NMS a notification when the temperature exceeds a threshold. This sounds good, in that you will get immediate notification as soon as an alert condition occurs, instead of having to wait for a poll to detect the condition. Another possible advantage is that there is no load on the NMS, network or monitored device, to support the periodic polling. However, traps have some significant disadvantages.
Firstly, consider what a trap is – a single UDP datagram, sent from a device to notify you that something is going wrong with that device. Now, UDP (User Datagram Protocol) packets (unlike TCP) are not acknowledged, and not retransmitted if they get lost and don’t arrive, since the sender has no way of knowing if it arrived or not. So, a trap is a single, unreliable notification, sent from a device at the exact time that a UDP packet is least likely to make it to the management station – as, by definition, something is going wrong.
The thing going wrong may be causing spanning tree to re compute, or routing protocols to reconverge, or interface buffers to reset due to a switchover to redundant power supply – not the time to rely on a single packet to tell you about critical events. Traps are not a reliable means to tell you of things that can critically affect your infrastructure – this is the main reason to avoid them if possible.
Another reason traps can be problematic is, ironically, manageability. In order for a trap to be sent and arrive at the management station, you have to configure the trap destination – the NMS’s IP address – into every device.
On every switch, every router, every server…. But, you may ask, don’t you have to do this to set up the SNMP community on the devices anyway, to enable polling? Yes – but usually when SNMP communities are defined, polling is enabled for entire networks or subnets. You can move your monitoring system to another IP on the same subnet, and not have to change any configuration.
But if you rely on traps, you now have to touch every device and reconfigure it to send traps to the new destination. And more significantly, it’s very hard to test that traps will work. With polling, it’s easy to see (and be alerted on) data not returning due to a misconfigured community, firewall or access list. It is much harder to be confident that a system is set up to trap to the right place, and that access-lists are set correctly to allow the traps. (And of course, traps use a different port than regular SNMP queries, so the fact polling works tells you nothing about whether traps will work.)
By definition, polls are tested every minute or so. A trap is usually sent only when a critical event occurs, with no notification or feedback if it fails. Which would you rather depend on for the health of your infrastructure and applications?
The final advantage of polling is that it can provide trending, and context. Consider the following graph:

Using either traps or polling, you could receive an alert about the fact that CPU utilization has exceeded 80%. But if you are solely relying on traps for your data, you would not have any further information. One system seems to need immediate action – the CPU usage started growing rapidly. The other system has been growing its usage slowly and steadily for a week, so most likely has at least a few more days before calamity. Relying on traps, which would not provide this data, would not allow you to make an informed decision about how to react differently to these two systems.
What does “SNMP Support” in a device mean?
Pretty much any device you see being sold into the datacenter or IT space will claim “SNMP support”. This is kind of like saying that a two-year old toddler and Usain Bolt are both capable of running – there are wildly disparate differences in what “SNMP support” can mean. Some devices will support a very limited set of information that is available through SNMP; some will support all the standard mgmt objects; and some will support the standard objects, as well as thousands of OIDs they publish in their own MIBs.
The worst case is where a device will offer nothing useful via SNMP, except perhaps the version of software that it is running. This is SNMP support in name only.
The bare minimum that devices should support is basic management functionality, such as the data found in the mgmt subtree. (This will allow interface utilization, packets per second, CPU and memory usage, TCP statistics, etc, to be discoverable and reported.)
But the basic mgmt data will certainly not be sufficient in many cases. For example, knowing the interface data and TCP statistics is of little utility in monitoring a UPS (uninterruptible power supply), or a storage array (especially if the data is transferred over Fiber Channel, so that the interfaces do not show any indications of usage or traffic.) In these cases, you need the device to support a vendor supplied MIB, that provides a variety of OIDs that measure and report on data that is not standardized under the .1.3.6.1.2 tree.
For example, a UPS device should report on things like the time it has been running on battery; the reason for the switch to battery; the runtime remaining on battery before battery exhaustion; the state of the battery packs, etc. A storage array should report things like drive health; free/unprovisioned space; the latency of read/write requests by volume or LUN, etc.
The fact that a device vendor may provide a MIB that has lots of useful information in it does not necessarily solve your problems. For example, while APC does provide very powerful SNMP agents, and a detailed private MIB – their MIB has over 4500 objects in it – not all objects are supported by all APC devices; and most are not meaningful to ordinary use of the devices (e.g. 1. 3.6.1.4.1.318.1.1.9.4.2.2.1.4: “the rectifier physical address (the address on the bus).”).
What does “SNMP Support” in a Management System mean?
As noted above, an NMS can be as simple as a Linux workstation with SNMP utilities installed, so that you can perform SNMP gets. In theory, you could then wrap some scripts around snmpget and snmpwalk, to query the data you care about; compare it to some hardcoded thresholds; and run the script out of a cron job so that it repeats every 5 minutes.
This is probably not what you would consider a real NMS, however.
So while any system that can query and show the response to an SNMP query could be called an NMS, there are a few fundamental things that need to be there from a practical level:
Easily define what OIDs to query.
Ideally, this isn’t something you even need to think about. An NMS with true SNMP support will discover the kind of device; then have knowledge of which OIDs are appropriate to query for that device; and also periodically check to see if there are changes in the device’s configuration requiring new different OIDs to check. (For example, enabling Power-over Ethernet in a switch will turn on a whole new section of the MIB tree that should be queried.) The worst case is an NMS that requires you to manually define what OIDs to check. Yes, it’s technically supporting SNMP, but it’s not making your life any easier if you have to go through the 4500 objects in the APC MIB, just to ensure your UPS’s are correctly monitored.
Easily define how to interpret the data that is returned.
SNMP data can be returned as gauges (e.g. the current temperature in Celsius); counters (how many packets have passed through the interface since the system started); strings, bitmaps, etc. Counters need to be converted to a rate, in most cases, by subtracting the prior counter value from the current, and dividing by the time interval between samples. This should be automatically handled by the NMS.
Easily define the thresholds that should trigger alerts.
Again, ideally the NMS should take away a lot of the need for this, and have pre-defined alerts for everything that could impact production systems, but there will always be customization required – either for systems that are not mission-critical, and so have a greater tolerance for performance issues; or for custom metrics that are not pre-defined. This tuning should be an easy task.
You’ll notice that the items above all focus on ease of use – which should be the main goal of using an NMS – to make the job of ensuring the operational availability, capacity and performance of the systems easier. NMS systems that require you to modify text or XML files, or pore through thousands of MIB files and configure all the SNMP OIDs to query, may technically be NMS systems – but only in the loosest sense of the word.
There are many other things that an NMS may do in this regard, which will be of differing utility to different organizations:
• graph the variables being collected, so you can see the historical trend of the objects being collected.
• route and deliver the alerts via different mechanisms (chat, email, sms, voice calls) to different people, and escalate through different people and teams. This can alternatively be done by a separate tool.
• discover devices to be monitored via different mechanisms. • map devices logically at different OSI layers, or geographically.
• use different data collection mechanisms other than SNMP, to support devices that do not provide any, or limited, support of SNMP. An NMS that can also collect data via other protocols such as WMI, JMX, and various other APIs can be used to consolidate and replace multiple tools into one, and provide a more cohesive view of the whole environment.
and so on.
Installing SNMPd on Linux
Installing an snmp daemon on Linux is very easy. Simply use the package manager to install the netsnmp package, and the utilities. On Redhat or Centos, this looks like:
yum install net-snmp

yum install net-snmp-utilsThere are many options to configure snmpd – you can limit the hosts that can query it by IP address; you can enable encryption and authentication for use with SNMP v3; you can even limit which OIDs the agent will respond to, when queried by different IP addresses, communities, or users.
However, in most uses, a simple configuration is reasonable (assuming the host is behind a firewall, and not exposed to the Internet.). The simplest configuration is to simply set the contents of /etc/snmp/snmpd.conf to this:
rocommunity MyCommunityThis will allow any device to query this system by SNMP, if they know the community MyCommunity. SNMP will not be enabled for any write, or set, operations, however.
You should then ensure SNMP is set to start automatically on system boot, and start it now, with these commands:
chkconfig snmpd on

service snmpd restartIf you find that SNMP is not responding to your queries from other hosts, some troubleshooting steps to check are:
- If you are running a firewall, such as iptables, on the server, ensure it is set to allow SNMP queries (UDP port 161) through.
- Similarly, if there are any other firewalls between the NMS and the server, ensure they are configured to allow SNMP queries through. You can see if the requests are arriving at the server by running tcpdump port 161. (If you have multiple interfaces, you will need to specify the correct one via the -i flag.) Note that this will show if you if the SNMP queries are arriving at the system – it will not show you if the local system’s firewall is rejecting the packets.
- Some distributions will include a version of the snmp agent that uses hosts.allow and hosts.deny files in the /etc directory, in conjunction with tcpwrappers, to further limit access. You can test this by adding the line snmpd: ALL to /etc/hosts. allow, and retrying your test.
- Of course, ensure you are using the correct SNMP community string.
Working at Scale
If you have more than one server to manage, you will need to set up SNMP access on all your devices. This is easily done with any of the popular configuration management tools (Ansible, Chef, Puppet, CFEngine, etc).
This is not specific to SNMP – the same practices should be used for the management of any configuration across more than one server. But ensuring that your SNMP configuration files are managed by a configuration management tool makes it easy to ensure it is correctly deployed to all servers; and allows easy changing of SNMP communities; adoption of SNMP v3, etc.
Conclusion
Hopefully you’ve gained an understanding of what SNMP is: why it is used; how it is configured; the type of systems that use it; and some of the pitfalls in talking about SNMP support. SNMP is the most widely deployed management protocol; it is simple to understand (although not always to use), and enjoys ubiquitous support. While some systems have alternate management systems – most notably Windows, which uses WMI in preference – a good knowledge of SNMP will take you a long way in being equipped to monitor a variety of devices and servers.
LogicMonitor’s unified monitoring platform expands possibilities for businesses by advancing the technology behind them.