Digital uptime is crucial for any business that operates an online store or even a simple website. Whether you’re a small, local business or an international conglomerate, your customers will be quick to spot if your digital presence fails. Ping checks, website synthetics, and uptime are three different ways to measure the performance of a website. But each one has its own benefits and weaknesses. Understanding the difference between them can make all the difference in ensuring your website performs well. Learn the difference between ping checks, synthetics, and uptime as they relate to evaluating the performance of your website.
Contents
- What Are Ping Checks?
- What Are Website Synthetics?
- What Are Website Synthetic Transaction Checks?
- What Are Uptime Checks?
- Ping Checks vs. Synthetics
- Ping Checks vs. Uptime
- Synthetics vs. Uptime
- Which Metrics Are the Most Important for Website Monitoring?
- Importance of Monitoring Website Performance
What Are Ping Checks?
Ping checks are one of the simplest tests to see if a website is up and running. All that is required is a connection to the server hosting the website from any other device that can communicate with it, such as a computer, cell phone, or another server. The ping check sends a request to the server where the website is hosted, and a simple answer is returned. If the answer comes back okay, the website is up and running. If not, that means the website is inaccessible.
Because ping checks are so simple to perform, their strength is in being an easy and fast way to check website availability. What they cannot do is provide any detailed information. A ping check will tell you if the site is up, but not if it is working correctly.
Ping checks can be performed frequently without interfering with your website, which is why some automated systems use them periodically to automatically monitor uptime for your site. While using ping checks is common, there are many conditions where they may not deliver accurate information. For example, intermittent server issues may not cause a ping check to fail, if the server doesn’t fail in the time a ping check is sent. But if it’s failing outside the time that ping checks are being performed, it’s possible that the website is experiencing downtime without anyone knowing.
Ping checks also may not indicate problems with servers receiving information, which can also be detrimental to user experience.
What Are Website Synthetics?
Synthetic checks are a type of website performance metric. Synthetic checks provide a snapshot of how your website performs when it is accessed from the server side. Synthetic checks measure the difference between the user’s request and the response time, which provides valuable insight into how your site is performing and what you might need to change to improve its performance.
Website synthetics use scripts to simulate traffic on your site. This allows for more accurate measurements because they can show you how fast your pages load under various network conditions, such as high-speed broadband, 3G mobile networks, and so on. Website synthetics also provide useful information such as how far down the page people scroll before leaving if they get frustrated with loading time.
Synthetic checks can be used to measure latency (the time between sending a message and receiving a response) and packet loss, but they’re not always available for every server type. Synthetic checks are also useful when testing a large number of pages or websites, a process that relies on automation. By automating this process the system is able to perform longer and more detailed synthetics check with regular frequency.
What Are Website Synthetic Transaction Checks?
Website synthetic transaction checks are another way to measure a website’s performance. Synthetic checks are only used for specific types of websites, such as e-commerce sites. This type of website monitoring repeats a script or form submission and tracks how long it takes for the site to respond. This data is then compared against other measurements to get an idea of how well the website is performing.
What Are Uptime Checks?
Checking uptime is exactly what it sounds like: verifying how long a website has been running without interruption. This is the most reliable way to know if a website’s connection is working properly or not.
Uptime checks are a type of website monitoring that alerts you when the website is down. Typically, this information comes from an ISP or a third-party provider. If you’re checking uptime manually, the tool you use will need access to both the internet, your server, and your hosting provider’s servers.
Ping Checks vs. Synthetics
Ping checks are a common way for businesses to monitor uptime. The time it takes to receive a response is measured in milliseconds. If there is a delay in response, it means there might be something wrong with the server. Uptime checks are performed periodically, usually when a company is trying to monitor uptime.
Because ping checks are fast and easy to perform, they are often the first method used to measure availability. They require no special software or downloads and can immediately tell you if the site is loading quickly, but not what’s causing glitches on your website.
Synthetics are similar to ping checks, but synthetics load every page on the website instead of just one. Synthetic checks can provide more information about how well your site is performing; however, they need specialized software or downloads to use this method. Synthetic checks also take longer than ping checks to complete.
Ping Checks vs. Uptime
Ping checks work well as a periodic test to see if there are any errors or malfunctions. However, ping checks only show you how well your website responds to external requests. They do not provide information on how often people visit your site or where they come from.
Uptime measures how long a website is up and running without interruptions. It also shows how frequently visitors get to see the site without interruption and is calculated by the percentage of time that a site is available during a specific period of time (usually 24 hours). Uptime does not indicate the number of visits or referrers; it simply tells you how often visitors get uninterrupted access to your site.
Synthetics vs. Uptime
Synthetics use scripted connections in order to emulate live traffic from real users accessing your site in real-time. Synthetics are more accurate than ping checks because they make sure that data is moving through all parts of your site just like it would when someone is actually visiting – including both data coming in and data going back out again. Uptime checks, on the other hand, compare how your site is performing from a real visitor’s perspective. It means that if you have a problem with a page on your site, you will see the problem before it becomes too widespread.
Which Metrics Are the Most Important for Website Monitoring?
To understand which metrics are the most important for website monitoring, it’s important to look at your website monitoring goals.
Ping checks, synthetics, and uptime measurements all have both strengths and weaknesses. Ping checks are fast but can be high-maintenance. Synthetics are slower but more precise. Uptime is the measure of how often a website has been up during a given period of time. Choosing the best metric depends on your needs and what you want to achieve with your website.
There is no single metric that will tell you everything you need to know about your website’s performance. Making a decision on what to measure depends on the needs of your site. In practice, your company is likely to use a combination of methods to achieve the desired results.
The most important metric to start with is ensuring that the site is up and running as often as possible. If the website is down, the other metrics won’t matter. People can’t access your site and your website is not being used. At this level, ping tests should be used often to ensure simply that your website is up.
For more insights, most companies will use a method that provides more detailed feedback along with simple pings. Uptime and synthetics are both effective ways of measuring performance but have different requirements. Your company should use at least one of them regularly to take a more detailed look at your website performance.
Importance of Monitoring Website Performance
Monitoring website performance allows you to find out as soon as possible if the site is having any issues and address them quickly. Drastic drops in traffic or sudden changes in rankings can be caused by website issues that need to be dealt with immediately.
Website monitoring also helps you identify and solve problems quickly to prevent widespread performance issues and allow your website to run more consistently and efficiently. In a business environment, monitoring can keep you ahead of competitors who might catch on to your website’s problems sooner than you.
Choosing which monitoring tools you use ensures that you get the right data to make decisions. Some of the most important factors for a website are page loading speed, performance, and uptime. Ping checks, website synthetics, and uptime are three different ways to measure the performance of your website and all three may be crucial to your site’s performance.
In a separate article, we introduced the concept of performing synthetic transactions with LogicMonitor to ensure website services are up and running correctly. It may be necessary to authenticate with a website before you can fully monitor it, and authentication may require presenting an MFA code that has been delivered via email. Let’s take this a step further and incorporate an MFA (Multifactor Authentication) Challenge. This challenge consists of requesting that an MFA code is sent to a registered email address (Gmail), retrieving the MFA code, and presenting the code to the website to complete the MFA challenge.
Setup the Gmail API
We will use Gmail as the public verified email address since Gmail has a robust API that makes this process fairly easy. The MFA service check will access the Gmail account to get the MFA code requested from the web page.
First, we have to enable the API and authenticate to Gmail. This can be done by following their Quickstart guide.
Step 1: Enable the Gmail API
Click the “ENABLE THE GMAIL API” form button to generate the credentials.json file. Place this file in the same directory as your Python script.
Step 2: Install the Google Client Library
Run the following pip command in your Python environment.
pip install --upgrade google-api-python-client google-auth-httplib2 google-auth-oauthlib
Step 3: Setup and run the sample script
The sample script will authenticate to the Gmail account. Run the script as any other Python file. A popup window will ask you to authenticate to Google, and once authenticated, a token.json file will be generated. Copy this file to the same directory containing your Python script and the credentials.json file.
Python Script
Add these imports to your Python script to access the Gmail API:
from __future__ import print_function
from googleapiclient.discovery import build
from httplib2 import Http
from oauth2client import file, client, tools
Add this code to your Python script to enable authentication to the Gmail account:
# Get Creds for Gmail
store = file.Storage(‘token.json’)
creds = store.get()
if not creds or creds.invalid:
flow = client.flow_from_clientsecrets(‘credentials.json’, SCOPES)
creds = tools.run_flow(flow, store)
service = build(‘gmail’, ‘v1’, http=creds.authorize(Http()))
To read the MFA code we use two Gmail functions.
The first function is ListMessagesMatchingQuery
def ListMessagesMatchingQuery(service, user_id, query=”):
“””List all Messages of the user’s mailbox matching the query.
Args:
service: Authorized Gmail API service instance.
user_id: User’s email address. The special value “me”
can be used to indicate the authenticated user.
query: String used to filter messages returned.
Eg.- ‘from:user@some_domain.com’ for Messages from a particular sender.
Returns:
List of Messages that match the criteria of the query. Note that the
returned list contains Message IDs, you must use get with the
appropriate ID to get the details of a Message.
“””
This function returns a list of messages matching the query. In this case, we are using a query to get the MFA code from a specific sender ([email protected]).
messLst = ListMessagesMatchingQuery(service, ‘me’, ‘from:DoNotReply@MFACodesRus.com‘)
The Next on is GetMessage
def GetMessage(service, user_id, msg_id):
“””Get a Message with given ID.
Args:
service: Authorized Gmail API service instance.
user_id: User’s email address. The special value “me”
can be used to indicate the authenticated user.
msg_id: The ID of the Message required.
Returns:
A Message.
“””
The ListMessageMatchingQuery function returns a list of messages in the order they were received; the most recent message will have an index of 0. We can retrieve the most recent message with the following code:
body = GetMessage(service, ‘me’, messLst[0][‘id’])
Next, we need to use a regular expression to extract the MFA code. The appropriate regular expression may vary depending on the contents the MFA email. In this example, the message appears as:
You’ve requested a one-time passcode for authentication purposes; your one-time passcode is 519643.
Once you use this code, you will need to request a new code the next time you are asked to provide one. If you believe that you are receiving this email in error, or if you did not request the code to be sent to your email address, please contact Logicmonitor Credit Union at (888) 415-6442 for further assistance.
Please do not reply to this email.
I kept this simple and just used a ‘\d+’ to look for digit codes.
Browcode = re.findall(‘\d+’, body[‘snippet’])
The MFA code is now stored in a variable and can be used where needed by your Python script.
In this article, we expanded the use of synthetic transactions to include performing MFA challenges. This functionality allows you to fully automate the multifactor authentication process required by the website you wish to monitor.
Implementing browser automation for your business doesn’t have to be daunting or cumbersome. The LogicMonitor Professional Services team has the talent and is up for the challenge! Ask about a free LogicMonitor Professional Services scoping call or free trial.
Background
In a separate article, we introduced the concept of performing synthetic transactions with LogicMonitor. An obviously crucial step of that process is actually scripting the automation. You can have all the right automation tools installed but how do you get started with the actual script? This article will help illustrate some of the preparation needed for developing a browser automation script.
Choose a Browser
You will need to choose a browser for visually inspecting a website and performing automation. While it makes sense to prioritize automated service testing through the same browser as most of your customers would, you should be able to get the same results visually inspecting a website’s elements in any popular browser.
Consider browsers that are compatible with Selenium, a browser automation tool we’re using in our series of articles on executing synthetic transactions with LogicMonitor. Selenium offers webdrivers for some of the most popular browsers:
- Mozilla Firefox
- Google Chrome
- Microsoft Internet Explorer
While Firefox and Chrome generally render websites similarly, Internet Explorer is traditionally an outlier. If you can be flexible, consider starting with Firefox or Chrome.
Choose the Right Website
Your first website choice for browser automation might not be the best choice. How can you tell? The largest factor is whether the webpage elements can be easily identified by an id or class name rather than an XPath. If none of that made sense to you, it’s okay. For now, choose a website but keep in mind that as you continue reading, you may discover it is not the most conducive to automation.
Keep Responsive Web Design In Mind
Many modern websites are designed to adapt or respond, to various screen sizes in order to accommodate desktops, laptops, and handheld devices such as mobile phones. Sometimes web page elements rearrange themselves in order to fit smaller screen sizes. In some cases, elements disappear entirely! You want to keep window size in mind before you attempt to identify elements and automate browser activity.
One way to test responsiveness is to simply resize your web browser. In most cases, resizing your browser to 50% of the screen’s width will be enough to trigger a responsive design. Alternatively, those who are already familiar with browser web developer tools can use those options to simulate other device screen sizes.
Locating Web Page Elements
The Challenge
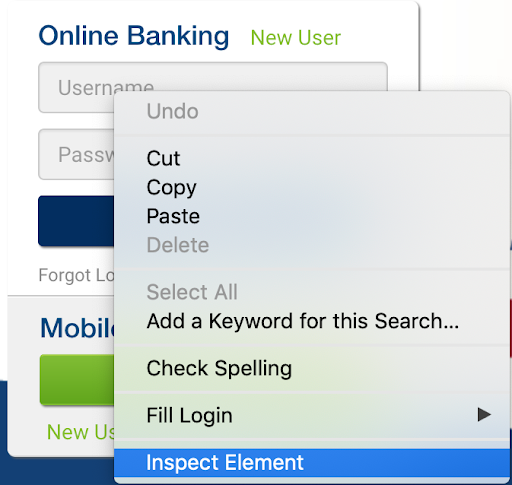
Consider the login form illustrated below.

Visually, it is obvious what actions you would take to use a login form: click the username field, type username, click the password field, type password, and click the login button. Without thinking, you visually locate the elements you need to use and take action. What about programmatically?
The Solution
HTML elements can be located in many ways, three of which being:
- ID
- Class name
- Xpath
One of the benefits of developer tools in modern browsers is the ability to inspect HTML elements in order to see details such as their id, class, and xpath. The inspection process is mostly visual, resulting in a favorable learning curve. You don’t need to be an expert on HTML, CSS, or JavaScript. Consider again the following user form.
Assuming the default mouse configuration, you could perform an inspection on the username field by right-clicking on the username field to expose a contextual menu and left clicking on the “Inspect Element” menu option. See the illustration below.
After inspecting the username field you would see the web developer tools open automatically and highlight, in blue, the HTML that represents the username input field. You would focus your attention only in the section highlighted in blue for now. The screenshot below is from Firefox’s web developer tools.
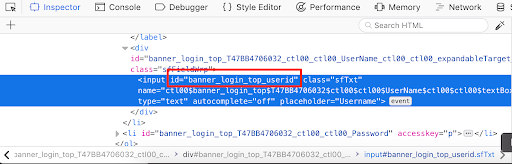
You don’t need to understand everything you see. Just look for “id=”. While we technically could also use the class name (“class=”) and Xpath (not illustrated), it is best to prioritize the id because element ids are unique in HTML. Locating HTML elements in any other way either increases the risk or the complexity of locating the right elements. Repeat the inspection process for both the password and login buttons, capturing ids for both when possible.
Remember Element Actions and Wait Times
Some HTML elements such as buttons trigger an action. A login button, for example, typically will submit information to a website and cause the browser to navigate to another page. This loading time is never instantaneous. There is at least some delay that should be considered during browser automation. Remember where these delays are.
You can ballpark the times as long as you are generous (remember not all network connections are equal). You also have the option of using the browser’s web developer tools to measure when a page finishes loading. Be sure to have the developer tools open to the Network section before navigating to a page. The screen capture below illustrates a load time measurement for Google’s home page in–simply to demonstrate flexibility–Chrome’s developer tools rather than Firefox.

You might wonder why the “Finish” time is almost 6 seconds. The Google homepage practically loads into a usable state in under a second; however, the homepage continues to transfer some background data. If you continue waiting, you would see the finish measurement update from 1 second, to almost 6, to as much as 5 minutes. A 5 second wait time would be fine, but, 5 minutes is overdoing it. This is where visual inspection and human discern
ment is important.
Conclusion
In this article, we expanded upon the idea of executing synthetic transactions within LogicMonitor using Selenium, a tried and true automation tool, and Python, one of the most popular scripting languages. By visually inspecting and navigating web content with browser developer tools, you can start planning advanced browser automation that goes beyond recording rigid steps.
Implementing browser automation for your business doesn’t have to be daunting or cumbersome. The LogicMonitor Professional Services team has the talent and is up for the challenge! Ask about a free LogicMonitor Professional Services scoping call or free trial.
Background
Synthetic transactions facilitate proactive monitoring of online business services such as e-banking and e-commerce. They not only monitor existing services but can be used to simulate and test the quality of future user interactions with services. LogicMonitor includes Website Checks out-of-the-box but did you know that Scripted DataSources can be used to extend website monitoring into synthetic transactions? This is the first in a series of technical articles on extending LogicMonitor’s capabilities via two popular technologies: Python and Selenium.
It is important to note that solutions presented in this article involve slight modifications to host environments. Your Collector hosts are yours to control and with great power comes great responsibility. As you add more scripting and programming language support to your Collector hosts, be sure to refer to their documentation and adhere to recommended security practices. Also, leverage your IDE and code linters to point out aberrant coding practices. Finally, do your best in documenting changes to your environment and leaving room to rollback modifications.
Performing Synthetic Transactions in Vanilla LogicMonitor
Out-of-the-box, LogicMonitor offers two forms of website monitoring:
- Standard Web Check, which uses web requests in order to confirm website availability from predefined LogicMonitor locations
- Internal Web Check, which uses a Collector host and user-defined Groovy script in order to confirm website availability from inside the customer’s network
During my Professional Services engagements, some customers required deeper support using our Website Checks:
- Identifying HTML elements in a Document Object Model (DOM), especially elements and information related to login forms
- Accounting for JavaScript, particularly JavaScript redirects
- Scripting in Groovy
- Performing synthetic transactions such as completing a multi-factor authentication (MFA) process
The first concern is addressed in our support doc Web Checks with Form-Based Authentication. We also offer online support accessible via our website or the product, as well as Professional Services to help customers with Web Check configurations for any complexity. I aspire to address the remaining concerns.
Spotlight on Selenium
Front and center for our synthetic transaction solution is Selenium, a test automation technology particularly focused on web browser automation. If you have experience in front-end quality assurance, then you are probably well acquainted. Using the Selenium WebDriver, we can programmatically navigate to web pages, find specific HTML elements on a page such a login form, and interact with those elements.
Selenium easily addresses the concern of JavaScript redirects. Navigating simple to complex web pages are no challenge for Selenium because it executes the automation in an actual browser. You could grab popcorn and watch the magic if you wanted. Alternatively–and I do recommend this–you can execute your automation in a headless mode, which hides the browser in exchange for increased execution speed.
Selenium boasts cross-platform support for the following operating systems:
- Linux
- Microsoft Windows
- Apple Mac OS X
Scripting and programming language support is even more impressive:
- Python
- Java
- Ruby
- C#
- JavaScript
- R
- Perl
- PHP
- Objective-C
- Haskell
While the LogicMonitor product makes embedded Groovy and PowerShell scripts easy, you technically can configure your LogicMonitor Collector hosts to support any of the aforementioned languages. This would effectively expand your monitoring capabilities through LogicMonitor DataSources and Internal Web Checks (remember these execute from Collector hosts).
Partnering with Python
Whether you love it or hate it–Python often gets the job done. Stack Overflow, a common developer resource well within the top 100 websites visited in the world, has found Python to be one of the fastest growing scripting languages particularly in “high-income countries”.
![]()
This year over a third of developers responding to a Stack Overflow survey responded that they use Python, and, a recent Dice article cited Python’s ease of use and flexibility as a significan
t factor for its popularity within the data science realm. Python is worth learning due to its sheer popularity alone. Thanks to that popularity and its compatibility with Selenium, finding code examples and getting started with web automation is easy.
Getting Started in 5 Steps
The following steps will help technical readers start performing synthetic transactions with LogicMonitor:
- Choose development and production operating systems for your automation. You can develop your Python script(s) in any operating system supported by Python (e.g. Linux, Windows, Mac OS X, and more). Plan to align the operating system compatibility of Python, Selenium, and LogicMonitor Collectors. In this case, you want to be more granular in your choice of major platform. For example, you may have developed your Python script in a Windows 10 environment, but, you would execute in a Windows Server environment due to LogicMonitor Collector compatibility.
- Install Python in your development and production environments. I personally prefer Python 3.7 in general for its introduction of dataclasses and it is the version I tested against. Python 3.6 would be a fair choice for stability given its current stage of releases. I recommend avoiding and migrating away from Python 2.7 as it will approach End of Life in 2020.
- Optionally, install virtualenv. This step is for those who appreciate the repeatability and reproducibility practices often found in the Dev Ops realm. One benefit of virutalenv is that it will install your Python libraries in a temporary location. It can be used in development environments to help isolate and track the minimum, required Python libraries to execute a scripted solution. This benefit is usually combined with a Python Pip requirements file, which documents the required libraries and facilitates their automatic installation. Read the virtualenv installation and user guides before proceeding to the next steps.
- Install Selenium. This could be a two-phased approach depending on your browser support requirements. First, install Selenium Python libraries using Python Pip (automatically included in your Python installation). Second, install a web driver. Firefox will require the Gecko web driver. Chrome requires the Chrome web driver. You should pick your preferred browser for reliability testing.
- Finally, author your automation script. Expect an in-depth example from this article series in the near future. For now, you can use the official Selenium documentation for help, or, find examples online at places like Stack Overflow. Just remember that in order to combine your automation script with LogicMonitor, the script must output results in an accepted format.
Potential Business Impacts
Synthetic transactions with LogicMonitor can positively impact your business, providing a competitive edge in MSP services portfolios, and, enabling internal IT teams to track the reliability of business services.
Conclusion
In this article, we introduced the execution of synthetic transactions in LogicMonitor using Selenium, a tried and true automation tool, and Python, one of the most popular scripting languages. In just 5 steps, the script-savvy can get started. Need help? Ask about a free LogicMonitor Professional Services scoping call.
Want to see more? Follow us here:
On Facebook
On Twitter
On LinkedIn
Or, e-mail us @ [email protected]