Palo Alto Panorama is an advanced management platform that streamlines the oversight of Palo Alto Networks firewalls. It offers centralized control, real-time insights, and simplified security management through a user-friendly web interface.
Implementing Palo Alto Panorama reduces administrator workload by building a real-time dashboard where you can monitor all of your IT operations in one place. It also alerts users of an impending threat so that they can protect themselves before an attack penetrates their network.
You can customize this centralized management to analyze and report specific logistics of interest to your company. It is a network security system that will enhance your security and protect your company.
The role of Palo Alto Panorama in network security
Palo Alto Panorama is essential to your company’s network security, as it gives you an easy way to protect sensitive information. You can manage all your firewall gateways, even in different regions. Since next-generation firewalls prevent unauthorized access, they must be managed effectively to maintain network security.
By using Palo Alto Networks Panorama, users can avoid duplication of work on their network security, especially if they need similar configurations on multiple firewalls—it continuously monitors the status of these firewalls. Palo Alto Panorama is excellent for large companies that have numerous firewall systems.
Palo Alto Panorama also monitors hardware firewalls, tracking traffic to and from all devices connected to the network. This monitoring helps enforce access controls and security policies, ensuring the network boundary remains secure.
A centralized management interface allows a company to observe, control, and review every firewall it wants to monitor. Palo Alto Panorama is crucial for businesses that must continuously monitor their network security, ensuring it operates correctly and preventing cyber-attacks or data center breaches.
How Palo Alto Panorama enhances network security
On top of the benefits mentioned above, Palo Alto Panorama has several benefits that help enhance network security, such as:
- Centralized updates: Allow simultaneous updates to the firewall and network settings for improved efficiency
- Automation: Automate specific processes for monitoring and updating specific security factors
- Comprehensive overview: Get a more complete view of your network security state and how it performs
- Customization: Use specific features to monitor parameters tailored to your needs instead of using pre-defined configurations
Features of Palo Alto Panorama
Palo Alto Panorama offers several features, including:
- Manages all firewalls and security tools
- Ensures consistency in firewall, threat prevention, URL filtering, and user identification rules
- Provides visibility into network traffic
- Offers actionable insights when threats are detected
- Identifies malicious behavior, viruses, malware, and ransomware
- Organizes firewall management with preconfigured templates for efficiency
- Implements the latest security updates with a single update
- Maintains a consistent web-based interface
- Performs analysis, reporting, and forensics on stored security data
Benefits of using Palo Alto Panorama
Palo Alto Panorama provides a centralized management system that simplifies network security management. Key benefits include:
- Monitors and updates applications automatically and efficiently
- Configures firewalls by group for simultaneous updates or changes
- Enables quick response to network threats
- Scales easily to grow with your company
- Supports additional services like data loss prevention and web protection
- Reduces time spent on network security by up to 50%
- Streamlines network security operations for better efficiency
- Adds an extra layer of security for more consistent management
How to set up and configure Palo Alto Panorama
You can set up Palo Alto Panorama by following a few simple steps. Use the small guide below to deploy it in your organization and get it ready to customize for your unique needs.
- Installation: Read the minimum requirements for Panorama and find dedicated hardware or virtual appliances that meet those specifications. Deploy on your chosen environment once chosen.
- Initial configuration: Connect to the Panorama web interface (192.168.1.1 by default). Set up the system settings (like IP address, DNS, and NTP) and activate the licenses. Then, update the software to the latest version.
- Set up managed devices: Connect your Palo Alto Network firewalls and other devices to Panorama and verify the device management connection.
- Create device groups and templates: Organize firewalls into logical groups. Once done, create configuration templates to ensure consistent policies across devices.
- Define policies: Define policies—such as NAT rules—and other device configurations. Use Panorama to push your configuration to managed devices.
- Configure logging and reporting: Configure log collector settings based on your organization’s needs. Set up custom reports and alerts to get notifications about potential issues.
- Set up User Access Controls (UAC): Create administrative accounts with proper permissions to control access to Panorama. Increase security by using multi-factor authentication.
- Test and verify: Conduct thorough testing to ensure all firewalls are properly managed. Check individual devices to verify policies are applied across the network.
Panorama Management Architecture
Panorama is a centralized management platform that offers simplified policy deployment, visibility and control over multiple firewalls within an organization. It offers a hierarchical structure for managing firewalls, with the ability to create templates and push policies across all devices, reducing the risk of misconfiguration and ensuring consistent security.
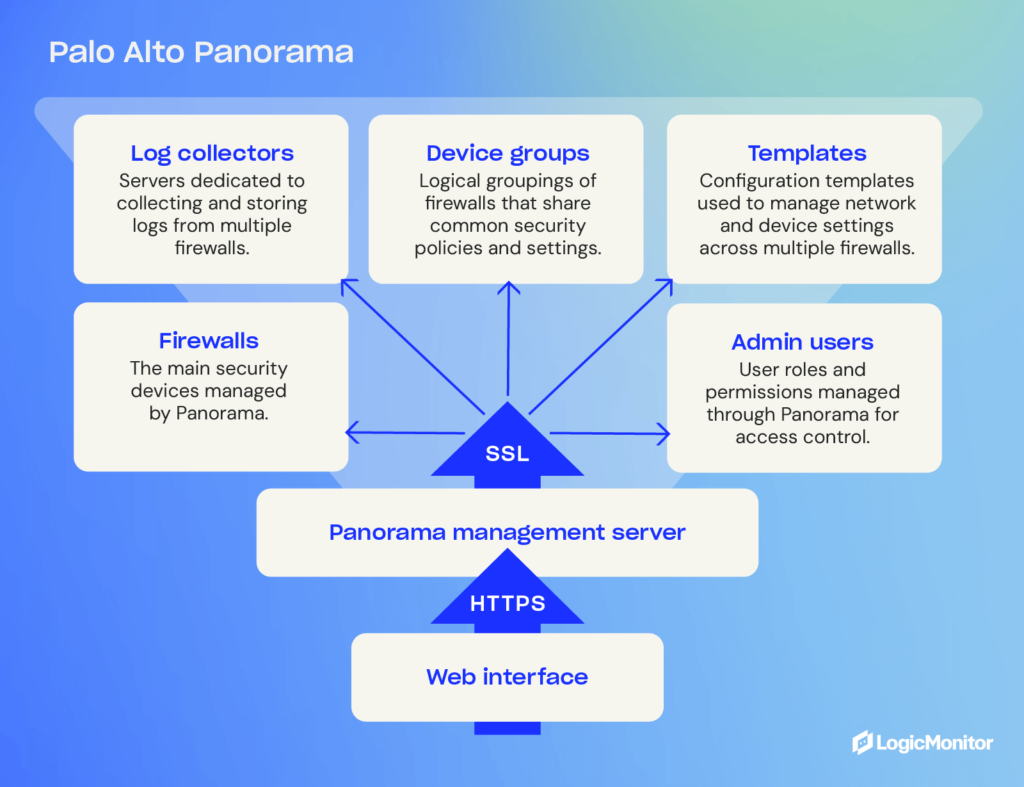
Device Groups
Device groups are logical groupings of firewalls within an organization that share similar characteristics. They can be created based on location, function or department.
These groups allow administrators to apply policies, templates and configurations to multiple firewalls simultaneously, saving time and effort. Device groups also provide a way to logically organize firewall management tasks and delegate responsibilities to different teams.
Templates
Templates in Panorama are preconfigured sets of rules and settings that can be applied to device groups or individual devices. This allows for consistent policy enforcement across all managed firewalls.
Templates can be created for different purposes, such as network security, web filtering, or threat prevention. They can also be customized to meet the specific needs of each device group or individual firewall. This level of flexibility and control ensures that policies are tailored to the unique requirements of each network segment.
Advanced capabilities of Palo Alto Panorama
Palo Alto Panorama offers a range of advanced features that make it useful for a range of applications and work environments. These capabilities can help your organization address specific security challenges and compliance requirements.
Some features you may find useful include:
- Application-layer visibility: Get deep insights into application usage across the network to gain a more granular level of control and policy enforcement
- Threat intelligence: Integrate with external threat intelligence feeds to boost detection and response capabilities
- Action automation: Automatic actions based on specific security events to lock down threats and improve incident response time
- Cloud support: Support both on-prem and cloud integration, allowing your organization to enforce consistent policies in every environment
- API support: Extensive API capabilities to integrate with other security tools to enhance capabilities, reporting, and automation
- Log correlation: Advanced log analysis to identify complex attack patterns across multiple devices
These features allow companies in any industry to meet their security requirements. Here are a few examples of how specific industries can put them to use.
Finance
Financial industries have strict requirements to protect customer data. They are required to comply with privacy rules like PCI DSS and OCX and held accountable if they don’t. Financial companies can use Palo Alto to detect potential intrusions that put customer records and funds at risk. It also helps segment specific banking services to put the most strict policies on the data that matters most.
Healthcare
Healthcare organizations must comply with HIPAA regulations to protect patient data. As healthcare environments become more complex, with IoT healthcare devices rolling out in healthcare facilities, facilities need advanced SaaS tools for managing and troubleshooting those devices. Palo Alto Panorama helps facilities create custom security solutions to manage constantly evolving healthcare environments and ensures they can detect potential threats that arise.
Education
Educational institutes are responsible for ensuring the safety of their students and staff. Depending on the student’s age, they may also need to comply with the CIPA. Pano Alto Panorama helps institutions manage internet access for students, faculty, and staff—ensuring data is protected and internet access is controlled and monitored. It also helps isolate research data for higher-education institutions for sensitive research data.
Palo Alto Panorama offers flexible and robust security
Palos Alto Panorama offers an advanced management platform to streamline the management of Palo Alto devices. Advanced features like automation, centralized management, and customized alerting will help your organization build a reliable security solution. As a result, you can protect customer and proprietary data and comply with your business’s compliance requirements.
HAProxy (High Availability Proxy) is free, open-source software that acts as a load balancer and proxy for managing TCP and HTTP traffic, ensuring reliable performance and high availability. Known for its speed and efficiency, HAProxy provides high availability by distributing incoming web traffic across multiple servers, preventing overloads at startup, and improving overall reliability.
The tool’s popularity has grown among developers and network engineers due to the volume of features available, which help reduce downtime and manage web traffic. This article discusses those features, as well as uses, load-balancing techniques, and key features of 2.7.0, the latest version of HAProxy.
HAProxy includes reverse proxy and load-balancing capabilities for HTTP-based applications and TCP-based applications. Load balancing involves routing traffic to servers based on pre-configured rules, such as looking for high-performance servers with the least amount of traffic or telling proxies to send connections to multiple servers.
Why use HAProxy?
HAProxy also provides SSL termination, health checks, and detailed logging capabilities, along with its load-balancing features. This open-source software is ideal for websites and web applications that experience high volumes of traffic or traffic that spikes on occasion.
As such, many large organizations prefer HAProxy for its efficiency, scalability, and strong supportive community. It simplifies the management experience and reduces downtime by persistently load-balancing heavy traffic, which increases availability for applications and network layers, improving the user experience.
Top reasons to use HAProxy
- Scalability: Handles increased traffic without compromising performance
- Reliability: Trusted by organizations like JPMorgan Chase & Co. and Boeing, the largest aerospace company in the world (HG Insights)
How does HAProxy work?
HAProxy can be installed free using a system’s package manager or as a Docker container.
- Frontend and backend setup: Configure HAProxy by defining the front end (receiving traffic) and backend (managing servers). You can set rules to direct traffic to specific servers based on IP addresses, ports, or HTTP load-balancing algorithms.
- Traffic management: Intelligently routes traffic based on configurations, ensuring optimal server usage and reliability.
HAProxy One offers a range of tools and platforms that enhance the benefits of HAProxy’s free proxy and load-balancing software.
Load balancing techniques
Load balancing in a web application environment depends on the type of load balancing used.
- Web server load balancing (layer 4): The simplest load balancing solution for multiple web servers is layer 4, or transport layer, load balancing. This setup uses a load balancer, a predefined range of IP addresses, and a port to determine where to route traffic, allowing multiple servers to respond to user requests efficiently.
- Application server load balancing (layer 7): Layer 7 load balancing routes requests to different backend servers, depending on requests, and requires more complex rules to connect user requests to the correct backend servers. For example, you might house blog articles on one server while you host an e-shop page on another. So, a request for a blog article will be routed through a different server than a request for an e-shop product, even though the requests are generated from the same website.
- Reverse proxy: Reverse proxies sit between applications and backends to ensure user requests reach appropriate servers. They also provide security, reliability improvements, and traffic management.
Key features of HAProxy
Due to its extensive features, HAProxy is preferred over alternative proxies like NGINX and LoadMaster.
- HTTP/2 protocol support: Enhances web performance
- SSL/TLS termination: Improves security by managing encryption and decryption
- Detailed logs: Offers comprehensive logs for monitoring and observability
- RDP cookie support: Supports secure, reliable sessions
- CLI for management: Provides in-depth server management capabilities
Implementing HAProxy: A step-by-step guide
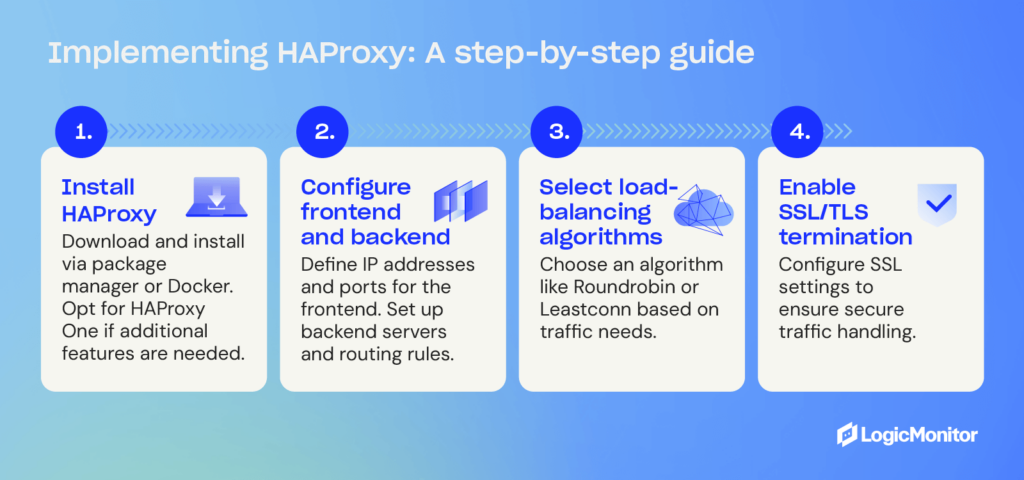
Step 1: Install HAProxy
- Download and install via package manager or Docker.
- Opt for the HAProxy One version if additional features are needed.
Step 2: Configure the frontend and backend
- Define the IP addresses and ports for the frontend.
- Set up the backend servers and the rules for routing traffic.
Step 3: Select load-balancing algorithms
- Based on traffic needs, choose an algorithm like Roundrobin or Leastconn. Roundrobin is the default load-balancing algorithm that selects servers in a specific order, and Leastconn is an alternative algorithm that searches for servers with the fewest connections.
Step 4: Enable SSL/TLS termination
- Configure SSL settings to ensure secure traffic handling.
HAProxy vs. other solutions
When evaluating load balancers and proxy solutions, it is important to choose one that best fits the specific infrastructure needs. HAProxy, NGINX, and LoadMaster are among the top contenders, each offering distinct features that cater to different operational demands.
HAProxy vs. NGINX
Both HAProxy and NGINX are popular choices for managing web traffic, but they excel in different areas.
- Performance: HAProxy is optimized for low-latency environments, making it ideal for applications that require real-time responsiveness and high availability. In contrast, NGINX is better suited for caching and delivering static content, offering a simpler solution for web applications that prioritize speed over complexity.
- Logging: One of HAProxy’s major advantages is its detailed logging capabilities. For environments that require deep traffic analysis and precise monitoring, HAProxy provides comprehensive logs that track each request and connection. NGINX, while effective, offers more basic logging, which may not be sufficient for enterprises needing extensive traffic visibility.
- Configuration complexity: HAProxy offers more advanced configuration options, allowing users to customize traffic routing based on a wide range of conditions. This flexibility comes with increased complexity, making it a better fit for organizations with dedicated DevOps teams or advanced networking needs. On the other hand, NGINX provides a simpler, more beginner-friendly configuration process, making it an appealing choice for smaller projects or businesses with less demanding requirements.
HAProxy vs. LoadMaster
The distinction between HAProxy and LoadMaster is open-source flexibility and proprietary convenience.
- Flexibility: As an open-source solution, HAProxy allows full customization, enabling businesses to tailor the tool to their specific needs without paying for additional features or upgrades. This makes HAProxy particularly attractive to organizations that want to maintain control over their infrastructure. In contrast, LoadMaster, a proprietary tool, provides pre-configured solutions that are easier to deploy but may lack the flexibility needed for more complex environments.
- Cost-Effectiveness: HAProxy’s open-source nature means it can be implemented at no cost, regardless of the scale of operations. For businesses that need to manage large volumes of traffic without the burden of licensing fees, HAProxy presents a cost-effective solution. LoadMaster, however, is a paid option that includes professional support and additional features. While this may benefit enterprises that prioritize customer support and streamlined implementation, it can become costly, especially as traffic demands grow.
Real-world use cases
The power of HAProxy is demonstrated by organizations like GitHub, which rely on it to manage millions of concurrent connections efficiently. In these large-scale environments, HAProxy’s ability to handle complex configurations and provide real-time performance metrics far surpasses the capabilities of NGINX and LoadMaster without significant customization.
Which to choose?
Ultimately, HAProxy stands out as the optimal choice for organizations looking for maximum flexibility, scalability, and a robust feature set to manage high volumes of traffic. For environments with static content or simpler traffic needs, NGINX may be a more suitable option. LoadMaster offers a more simplified, pre-configured solution but may be costly, particularly for enterprises looking to scale.
Community support and resources
HAProxy’s community support and resources are vast, offering many user options, from official documentation to active community forums. With a HAProxy One subscription, users can benefit from expanded paid support options.
HAProxy supports users of current and latest versions and assists in critical fixes on any version. Documentation, including configuration tutorials and detailed manuals, is available on the HAProxy website, and the HAProxy blog offers helpful articles that you can filter according to specific inquiries. Current HAProxy One subscribers can contact support through the HAProxy Portal, providing convenient access to assistance.
Conclusion
HAProxy is a powerful, scalable solution for managing heavy or unpredictable web traffic. As a free, open-source tool, it provides smaller organizations the same reliability and performance enjoyed by large enterprises like JPMorgan Chase & Co. and Boeing. Implementing HAProxy is a strategic move for any business looking to enhance its web infrastructure’s reliability and performance.
Apache Tomcat, developed by Sun Systems in the late 1990s, is a popular choice for developers who need to build and deploy Java-based web applications. It’s a collaborative platform that, since 2005, has become an accredited top-level Apache project, with highly experienced developers volunteering support and resources for it.
A 2022 survey shows that 48% of developers now utilize Apache Tomcat for deploying Java web applications. But what is the Apache Tomcat server, and how does it work?
What is Apache Tomcat?
Apache Tomcat is a free, open-source Java servlet container. It hosts Java-based web applications, implementing Java Servlet and JavaServer Pages (JSP) specifications. Tomcat provides a robust and scalable environment for dynamic web content, managing Java servlets to process requests and generate responses efficiently.
Servlet containers like Tomcat provide a runtime environment for Java servlets, which extend web server functionality by generating dynamic content and handling web requests. They manage the lifecycle of servlets, ensuring smooth operation by loading and unloading them as needed.
Java servlet containers may be combined with other web servers to provide a more complete runtime environment for deploying Java-based web applications. Apache Tomcat also provides additional services such as security and resource management.
Is Apache Tomcat a web server or an application server? In truth, it’s neither. Web servers deliver static content, such as a home page, an image, or a video. Application servers, conversely, deliver dynamic content, such as personalization of web pages and interactive chat options. Apache Tomcat behaves like an application server because it can deliver highly dynamic content. It can also behave like a standalone web server, but it is actually a Java servlet container. As such, it does not have the features of a full application server and may not support some enterprise-level requirements.
The latest release of Apache Tomcat server is 10.1.25, which was launched on the 14th of June, 2024.
Core Apache Tomcat components
Catalina
The primary component of Apache Tomcat is the servlet container, Catalina. Catalina implements the required specifications for Java servlets and Jakarta Server Pages (JSP, formerly JavaServer Pages) and manages the lifecycle of all the servlets in the container.
Coyote
Coyote is a connector component that supports the HTTP/1.1 protocol. Coyote interprets and processes HTTP requests via processing threads and can create additional threads if traffic increases unexpectedly. The ability to handle requests in this way is what gives Apache Tomcat the ability to be used as a standalone web server.
Jasper 2
Servers need a JSP engine to be JSP compatible. The Apache Tomcat server’s JSP engine is called Jasper 2. It replaces the original Jasper, which was slower and had fewer features. This engine works solely to implement JSP specifications.
Clusters
Another important component in Apache Tomcat server architecture is the cluster. Clusters are groups of Tomcat servers that operate in tandem, creating a single system via careful load balancing to connect servers successfully. Clustering can improve a system’s availability and boost its resilience.
Apache Tomcat request handling

How does Apache Tomcat work?
Now that you know the basic components of Apache Tomcat, let’s take a look at how the server actually works. There are six primary steps in the lifecycle of an HTTP request to Tomcat.
- A client inputs an HTTP request
- This request goes to a web server
- The server forwards this request to the Apache Tomcat container
- The container and relevant connectors decide how to process the request
- The container generates an appropriate response
- The response goes back to the client via the web server
The configuration for how the servlet container responds to requests is held in the server.xml file. Java servlets initialize and execute JSP files if required, and the JSP engine, Jasper, executes the relevant Java code to create the response. The connector, Coyote, sends that response back, allowing the client’s web browser to fully resolve the request.
The end-user experience should be to enter a web address or click a button on a web page and, within a few seconds, get a result that matches their request.
Advantages of using Apache Tomcat
Increased observability
There are numerous advantages to using Apache Tomcat beyond the ability to create a runtime environment for Java web applications and websites. Apache Tomcat tracks all requests and increases observability across systems, although investing in Tomcat monitoring tools is essential for businesses that want to ensure they avoid bottlenecks and latency.
Security features
Tomcat also provides security features, including additional authentication stages and access controls that can be implemented by an administrator. This makes it ideal for organizations that have to be compliant with high standards.
Lightweight and fast
Tomcat is incredibly lightweight and fast. It’s focused on efficiency, so it doesn’t drain network resources. It can start up and shut down fast without impacting other network components.
Customization options
Apache Tomcat server provides several configuration options that allow developers to customize the behavior of the servlet container and associated web applications. Thanks to numerous plugins and modules, developers can use Tomcat however they want and extend its practicability almost indefinitely.
Compatibility
Because Tomcat was developed to implement JSP and Java APIs, it’s compatible with all Java technologies or their Jakarta equivalents. WebSockets, Expression Language, and, of course, Java (or Jakarta) servlets all integrate seamlessly with Tomcat.
Integration with other technologies
Tomcat’s capabilities extend beyond Java technologies to seamlessly integrate with various tools and frameworks, such as:
- Java frameworks: Tomcat integrates smoothly with Java frameworks like Spring and Hibernate, enabling developers to build robust, scalable applications.
- DevOps tools: Tomcat works well with DevOps tools like Jenkins and Docker. Jenkins automates CI/CD pipelines, while Docker facilitates containerization for easier deployment.
- Cloud services: Tomcat integrates with AWS, Azure, and Google Cloud, offering scalable and flexible deployment options.
- Load balancers: Tomcat supports load balancers like Nginx and Apache HTTP Server, ensuring high availability and better performance.
- Monitoring tools: Tomcat can be monitored using tools like LogicMonitor, Nagios, and New Relic, which provide insights into server performance and health.
Open-source and free
One of the biggest advantages for most development teams is that Apache Tomcat is completely open-source and free. There is no charge, ever, for utilizing this platform, and it’s entirely maintained and updated by volunteers. The community surrounding Tomcat is enormous, and so much support is available online for developers utilizing its features.
Disadvantages of using Apache Tomcat
Are there disadvantages to using Apache Tomcat? There can be, depending on your needs.
Limited enterprise-level features
As we mentioned earlier, Tomcat is not a full-featured web server or application server, although it can fulfill many of the same tasks.
Lack of support for EJBs
It doesn’t support some enterprise-level features, such as EJBs (Jakarta Enterprise Beans, formerly Enterprise Java Beans). This can be a significant limitation for organizations that rely on EJBs for developing robust, scalable, and transactional enterprise applications.
Limited Java API support
Tomcat also lacks support for some Java APIs. For comprehensive functionality, developers often need these APIs to handle more complex tasks, which Tomcat alone cannot manage.
Need for full application server
For this level of functionality, developers require a full application server such as RedHat JBoss or Oracle WebLogic. These servers provide the extensive features and support needed for large-scale enterprise applications, which Tomcat alone cannot offer.
Primary Apache Tomcat use cases
Apache Tomcat is one of the most widely utilized platforms for website and web application deployment. One app developer noted that Tomcat helped them reduce their server startup time by 11 seconds per instance compared to alternatives. They also stated that Tomcat helped keep their apps compliant and bug-free without resorting to manual code entry.
E-commerce
Tomcat also helps e-commerce businesses scale rapidly, one example is Walmart. Apache Tomcat empowers the retailer to handle thousands of transactions daily while providing robust, excellent online experiences for their website visitors.
Finance
In the financial industry, Tomcat’s security features and performance capabilities are essential. Banks and financial institutions rely on Tomcat for secure and reliable web application deployment, guaranteeing compliance with stringent regulatory requirements and handling their high volumes of transactions with comfort.
Media and entertainment
Businesses looking to streamline their budget might consider Tomcat instead of a proprietary, chargeable server option. Media companies benefit from Tomcat’s ability to manage high traffic and provide fast, reliable service to users. Weather.com switched to Tomcat and found it could scale up the amount of web traffic it could handle, plus it saved thousands of dollars by making this change.
Development environments
Tomcat is the ideal choice for development environments that already utilize multiple Java-based technologies. The ease of integration can be a big time saver for busy DevOps teams. Switching to Tomcat is as simple as installing the servlet container and copying over any application files into the container’s directory.
Is Apache Tomcat going to be used into the future?
Apache Tomcat server is the go-to servlet container for Java web applications — with good reason. Its lightweight yet robust functionality and ease of configuration make it fast to learn and deploy on your own systems. The sheer volume of support available continues to grow as more developers adopt Tomcat as a major aspect of their app deployment strategies.
It’s safe to say that while Java remains a popular choice for developers, Apache Tomcat will continue to be a top choice for creating runtime environments for Java web applications.
Keeping your websites and web-based applications running smoothly for your users is essential. External users that can’t get onto your client-facing portals will quickly turn to competitors. Internal users having difficulty with your network will become frustrated which can reduce morale and productivity. Network monitoring via web checks and ping checks could improve website uptime and make everyone’s lives a little easier.
Defining Web Checks
Web checks are one aspect of website monitoring that enables you to check how the site is responding to inputs from both outside and within the network.
External web checks, sometimes called standard web checks, simulate user interactions to test web services and ensure responses to requests are delivered as expected and at the speed expected. These checks should come from different geographical locations, which can be determined by a network administrator or a third party that manages website monitoring, such as LogicMonitor monitoring services. Automated HTTP GET, POST, and HEAD requests occur periodically and network admins can access the collated results of this data to assess the current performance of the website.
Internal web checks work slightly differently. Data collectors within the network send requests, and this will solely provide data on how the network is functioning for internal users. This is particularly important for private internal networks that aren’t accessible publicly.
Defining Ping Checks
Ping checks are a very simple test that defines whether a website is currently up and live on the network. A ping check can, in theory, come from any device that can connect to the network. The network-connected device sends a simple ICMP echo request to the server and only needs a basic ICMP echo reply in response in order to return a “ping”. If no ping is returned, this means the website is down. Ping is important for assessing website uptime, but provides no detail on how the website is performing or, if it happens to be down, the reason why.
Ping checks, like web checks, can also come from outside or inside the network, depending on the network manager’s needs at that time.
Differences Between Web Checks and Ping Checks
Effective network monitoring demands different strategies deployed in tandem to cover all aspects of the system. Web checks and ping checks have very different uses, but they both form a part of the overall strategy of observability and network visibility.
The main difference between web checks and ping checks is that web checks focus on the application layer of the system’s fabric while ping checks run solely across the network layer. Web checks want to know how a site or application is functioning, returning data on how requests have been processed and the end-user experience.
Conversely, ping checks only want to know whether a site is on or off; up or down. However, this does not mean that administrators can get no further information from a ping check. Network managers can use ping to determine the connectivity right across a network, ensuring that servers are communicating and that websites are up and running as expected. While ping checks don’t return any detail, the time for a ping response to return could indicate a bottleneck in the network, prompting further troubleshooting.
Web checks can provide different levels of insight depending on the services you use to implement those web checks. For example, with LogicMonitor monitoring solutions, you can automate web checks that wait for all elements of a page to load before providing any response from the server. This could provide website administrators or developers with valuable insights into how long a page is taking to load for end users.
Importance of Web Checks
Why are insights like this so important? Of course, knowing that a website is slow to load is bad news, but it’s also a powerful piece of data in that it empowers the web team to make changes to improve the end-user experience. If, like in the previous example, a page is taking far too long to load all its elements, this could be a sign that something needs to be simplified in the web page’s structure. It could also indicate a network issue that requires some attention.
Assessing and analyzing your website’s performance on a regular basis is critical to maintaining an engaged audience or, for internal networks, keeping your teams productive and satisfied with the tools available to them.
Importance of Ping Checks
Automating ping checks is one of the easiest ways to confirm website uptime. It’s important to do ping checks regularly because if you don’t, there could be periods of downtime that you’re not even aware of. Ping response time is measured in milliseconds, so keeping a log of ping response times can quickly indicate if there’s a delayed response and if this is a one-off glitch or a continuously recurring issue. Ping is often the first step to noticing and identifying a potential network issue, and can help network managers understand what troubleshooting pathway to follow for the most efficient outcome.
Network bottlenecks, where something causes congestion or a blockage in the network, can cause sites and apps to become slow, lag, or even fail to connect at all. Ping can assess which aspects of the network are responding in a timely manner and help identify exactly where within a system the bottleneck is occurring.
Utilizing both external and internal ping checks can be useful here. For example, if an external ping check comes back super fast, but an internal ping check is slow, that might indicate a problem between a machine on your network and the server. The good news is this shouldn’t affect external users. The bad news is that other users on your immediate network might be struggling with connection issues. However, now that you know roughly where the problem lies, you can investigate more deeply and troubleshoot the issue faster.
Ping checks can be used together with tracerouting to help identify exactly where an issue is. For Windows machines, for example, the “pathping” command can send a series of pings to each component of the network on the way to a particular server or URL. Assessing the response time on each of these pings helps identify exactly where the bottleneck is, giving network managers a clear idea of what next steps to take.
Website monitoring is a critical part of managing any network, whether you run a customer-facing online business or look after a company-wide private network. Website uptime and performance can make or break a brand and can have a major impact on whether employees feel your organization is a good place to work. In fact, half of all employees will consider leaving organizations if the technology they work with every day isn’t up to scratch. With regular, automated web checks and ping checks, you can better oversee your networks, focus your efforts where they’re needed the most, and ensure slick, well-connected services, sites, and systems.
LogicMonitor monitoring tools oversee the health and performance of every aspect of your network infrastructure. Increased visibility helps remove friction and speeds up troubleshooting, helping internal users get back to work and external users enjoy your digital services more freely. Get in touch to find out more about effective network monitoring.
Digital uptime is crucial for any business that operates an online store or even a simple website. Whether you’re a small, local business or an international conglomerate, your customers will be quick to spot if your digital presence fails. Ping checks, website synthetics, and uptime are three different ways to measure the performance of a website. But each one has its own benefits and weaknesses. Understanding the difference between them can make all the difference in ensuring your website performs well. Learn the difference between ping checks, synthetics, and uptime as they relate to evaluating the performance of your website.
Contents
- What Are Ping Checks?
- What Are Website Synthetics?
- What Are Website Synthetic Transaction Checks?
- What Are Uptime Checks?
- Ping Checks vs. Synthetics
- Ping Checks vs. Uptime
- Synthetics vs. Uptime
- Which Metrics Are the Most Important for Website Monitoring?
- Importance of Monitoring Website Performance
What Are Ping Checks?
Ping checks are one of the simplest tests to see if a website is up and running. All that is required is a connection to the server hosting the website from any other device that can communicate with it, such as a computer, cell phone, or another server. The ping check sends a request to the server where the website is hosted, and a simple answer is returned. If the answer comes back okay, the website is up and running. If not, that means the website is inaccessible.
Because ping checks are so simple to perform, their strength is in being an easy and fast way to check website availability. What they cannot do is provide any detailed information. A ping check will tell you if the site is up, but not if it is working correctly.
Ping checks can be performed frequently without interfering with your website, which is why some automated systems use them periodically to automatically monitor uptime for your site. While using ping checks is common, there are many conditions where they may not deliver accurate information. For example, intermittent server issues may not cause a ping check to fail, if the server doesn’t fail in the time a ping check is sent. But if it’s failing outside the time that ping checks are being performed, it’s possible that the website is experiencing downtime without anyone knowing.
Ping checks also may not indicate problems with servers receiving information, which can also be detrimental to user experience.
What Are Website Synthetics?
Synthetic checks are a type of website performance metric. Synthetic checks provide a snapshot of how your website performs when it is accessed from the server side. Synthetic checks measure the difference between the user’s request and the response time, which provides valuable insight into how your site is performing and what you might need to change to improve its performance.
Website synthetics use scripts to simulate traffic on your site. This allows for more accurate measurements because they can show you how fast your pages load under various network conditions, such as high-speed broadband, 3G mobile networks, and so on. Website synthetics also provide useful information such as how far down the page people scroll before leaving if they get frustrated with loading time.
Synthetic checks can be used to measure latency (the time between sending a message and receiving a response) and packet loss, but they’re not always available for every server type. Synthetic checks are also useful when testing a large number of pages or websites, a process that relies on automation. By automating this process the system is able to perform longer and more detailed synthetics check with regular frequency.
What Are Website Synthetic Transaction Checks?
Website synthetic transaction checks are another way to measure a website’s performance. Synthetic checks are only used for specific types of websites, such as e-commerce sites. This type of website monitoring repeats a script or form submission and tracks how long it takes for the site to respond. This data is then compared against other measurements to get an idea of how well the website is performing.
What Are Uptime Checks?
Checking uptime is exactly what it sounds like: verifying how long a website has been running without interruption. This is the most reliable way to know if a website’s connection is working properly or not.
Uptime checks are a type of website monitoring that alerts you when the website is down. Typically, this information comes from an ISP or a third-party provider. If you’re checking uptime manually, the tool you use will need access to both the internet, your server, and your hosting provider’s servers.
Ping Checks vs. Synthetics
Ping checks are a common way for businesses to monitor uptime. The time it takes to receive a response is measured in milliseconds. If there is a delay in response, it means there might be something wrong with the server. Uptime checks are performed periodically, usually when a company is trying to monitor uptime.
Because ping checks are fast and easy to perform, they are often the first method used to measure availability. They require no special software or downloads and can immediately tell you if the site is loading quickly, but not what’s causing glitches on your website.
Synthetics are similar to ping checks, but synthetics load every page on the website instead of just one. Synthetic checks can provide more information about how well your site is performing; however, they need specialized software or downloads to use this method. Synthetic checks also take longer than ping checks to complete.
Ping Checks vs. Uptime
Ping checks work well as a periodic test to see if there are any errors or malfunctions. However, ping checks only show you how well your website responds to external requests. They do not provide information on how often people visit your site or where they come from.
Uptime measures how long a website is up and running without interruptions. It also shows how frequently visitors get to see the site without interruption and is calculated by the percentage of time that a site is available during a specific period of time (usually 24 hours). Uptime does not indicate the number of visits or referrers; it simply tells you how often visitors get uninterrupted access to your site.
Synthetics vs. Uptime
Synthetics use scripted connections in order to emulate live traffic from real users accessing your site in real-time. Synthetics are more accurate than ping checks because they make sure that data is moving through all parts of your site just like it would when someone is actually visiting – including both data coming in and data going back out again. Uptime checks, on the other hand, compare how your site is performing from a real visitor’s perspective. It means that if you have a problem with a page on your site, you will see the problem before it becomes too widespread.
Which Metrics Are the Most Important for Website Monitoring?
To understand which metrics are the most important for website monitoring, it’s important to look at your website monitoring goals.
Ping checks, synthetics, and uptime measurements all have both strengths and weaknesses. Ping checks are fast but can be high-maintenance. Synthetics are slower but more precise. Uptime is the measure of how often a website has been up during a given period of time. Choosing the best metric depends on your needs and what you want to achieve with your website.
There is no single metric that will tell you everything you need to know about your website’s performance. Making a decision on what to measure depends on the needs of your site. In practice, your company is likely to use a combination of methods to achieve the desired results.
The most important metric to start with is ensuring that the site is up and running as often as possible. If the website is down, the other metrics won’t matter. People can’t access your site and your website is not being used. At this level, ping tests should be used often to ensure simply that your website is up.
For more insights, most companies will use a method that provides more detailed feedback along with simple pings. Uptime and synthetics are both effective ways of measuring performance but have different requirements. Your company should use at least one of them regularly to take a more detailed look at your website performance.
Importance of Monitoring Website Performance
Monitoring website performance allows you to find out as soon as possible if the site is having any issues and address them quickly. Drastic drops in traffic or sudden changes in rankings can be caused by website issues that need to be dealt with immediately.
Website monitoring also helps you identify and solve problems quickly to prevent widespread performance issues and allow your website to run more consistently and efficiently. In a business environment, monitoring can keep you ahead of competitors who might catch on to your website’s problems sooner than you.
Choosing which monitoring tools you use ensures that you get the right data to make decisions. Some of the most important factors for a website are page loading speed, performance, and uptime. Ping checks, website synthetics, and uptime are three different ways to measure the performance of your website and all three may be crucial to your site’s performance.
A JSON Web Token (JWT) is a URL-safe method of transferring claims between two parties as a JSON object, the data structure used to represent data in a human-readable and machine-parseable format called JavaScript Object Notation (JSON). As JWTs gain popularity with frameworks like OAuth 2.0 and standards like OpenID Connect, they become a more trusted solution for secure data exchange.
JWTs include three components: header, payload, and signature. An encrypted or signed token with a message authentication code (MAC) is known as a JSON web signature (JWS), while an encrypted token is a JWE or JSON web encryption.
For the sake of verbal communication, many developers have taken to pronouncing JWT as “jot” or “jawt”. Continuing that theme, I propose the pronunciation of JWS as “jaws” and JWE as “jawa.”
The JWT is formed by concatenating the header JSON and the payload JSON with a “.” and optionally appending the signature. The whole string is then base64 URL encoded.
This article covers the basics of JWT tokens, offers examples of JSON Web Token usage, and answers questions about best practices.
Table of contents:
- What are JSON Web Tokens?
- Example of JSON Web Tokens
- When to use JWT
- Is JWT secure?
- Best practices when implementing JWTs
- JWT Tokens vs. session tokens
- Use cases for JSON Web Tokens
- Conclusion
- FAQs about JSON Web Tokens
Example of JSON Web Tokens
JWT Example
eyJ0eXAiOiJKV1QiLCJhbGciOiJIUzI1NiJ9.eyJpc3MiOiJMTSIsImlhdCI6MTYxOTQ3MDY4MiwiZXhwIjoxNjE5NDcxODg2LCJhdWQiOiJsb2dpY21vbml0b3IuY29tIiwic3ViIjoiTmVkIn0.mqWsk4fUZ5WAPYoY9bJHI7gD8Zwdtg9DUoCll-jXCMgDecoded Header
{
  "typ": "JWT",
  "alg": "HS256"
}
Decoded Payload
{
  "iss": "LM",
  "iat": 1619470682,
  "exp": 1619471886,
  "aud": "logicmonitor.com",
  "sub": "Ned"
}
Signature
mqWsk4fUZ5WAPYoY9bJHI7gD8Zwdtg9DUoCll-jXCMgWhen to use JWT tokens
JWTs offer practical ways for maintaining HTTP request states in stateless authentication situations. Common uses include RESTful APIs and Single Sign-On (SSO) authentication. A JWT provides state information to servers for each request. This is especially helpful for secured RESTful web services that require client authentication and authorization control.
When not to use a JWT: Do not use a JWT when a session token will do. Session tokens are a well-established method of managing client access, and their potential to introduce vulnerabilities is low.
LogicMonitor’s article about Adding and Managing Web Services provides insights on integrating JWTs with web services.
Security considerations for JWTs
The most common vulnerabilities of a JWT or JWS are created during implementation. As JWS does not inherently provide security, proper implementation combined with secure server monitoring with tools like Silver Peak is key to avoiding security pitfalls like the following:
- Algorithm confusion: Avoid allowing JWT headers to dictate validation algorithms, which can lead to vulnerabilities if an attacker sets the “alg” header to “none.”
- Weak secrets: Use strong, complex secrets to prevent token forgery.
- Token sidejacking: Prevent sidejacking by incorporating user context and expiration times and securely storing tokens.
Real-life comparison of encryption algorithms: HMAC vs. RSA
HMAC (hash-based message authentication code) uses a shared secret key to form and validate a signature. RSA, an asymmetric algorithm, uses a private key to form a signature and a public key to validate the digital signature.
A system using the RSA algorithm would sign with the private key and validate with the public key. If a JWT is signed using an HMAC algorithm and a public RSA key as input, then the receiving system could be fooled into using the public RSA key it knows to validate the signature using the HMAC algorithm.
This attack works when a receiving system allows a JWT header to drive token authentication. In this case, the attacker declared the public key of the asymmetric scheme to be the shared secret key of the symmetric signature scheme.
Best practices for implementing JWT tokens
To maximize the security and effectiveness of JWTs, these best practices should be followed during implementation.
- Proper authentication control: Don’t allow JWT headers to drive token authentication; use a predefined list of allowed algorithms.
- Token secrets: Avoid weak token secrets that allow attackers to generate valid tokens.
- User context: To prevent token sidejacking, add user context to tokens; random strings are provided during client authentication and kept in hardened cookies.
- Secure storage: Use hardened cookies to ensure secure storage.
- Expiration times: Set reasonable limitations on token validation dates and consider other methods for revocation for tokens that need to remain valid for extended periods.
- Scope of authorization: Issue JWTs with narrow scopes of access to secured resources.
- Require claims: Enforce limits on access points so that claims made beyond the scope limit will be rejected regardless of signature validity.
- Privileged data: Never store privileged data in a JWT or JWS, which do not hide stored data in headers or payloads.
JWT tokens vs. session tokens
JWT differs from traditional session tokens in several ways:
Stateless
JWTs are stateless and don’t require server-side storage. All information is stored within the token itself, eliminating the need for server storage and reducing web app requirements. To manage states, session tokens require server storage, so scaling these applications becomes more difficult.
Decentralization
JWTs allow for decentralized authentication. Once a user is issued a JWT, any service with the correct secret key can validate the token without contacting a central server. With session tokens, the user typically must validate their credentials with the stored session data on the server.
Flexibility
JWT can carry more information than session tokens. It can include user roles, permissions, token information, and metadata. Session data typically only contains an identifier, with the rest stored on the server.
Security
JWTs require different security considerations because sensitive data is stored on user machines. It requires encryption, proper signing, and proper handling of secret keys. Much of a session token’s security relies on server data management.
Performance
JWTs can improve web application performance by reducing server operations. For example, they may reduce the number of database lookups, improving the performance of high-bandwidth applications. Session tokens may require lookups for each request, which may make scaling more complicated.
Use cases for JSON Web Tokens
JWTs are versatile and applicable in various scenarios, such as:
Microservices
JWTs can facilitate communication between microservices. Since JWTs can authenticate with any server with secret keys, they help decentralize applications and ensure secure inter-service communication. They also help carry user context between servers, maintaining a consistent user state without a shared database.
Mobile applications
JWTs can help manage user authentication and sessions in mobile apps. This is especially important for apps that require persistent authentication in areas with intermittent connectivity. JWTs are stored securely on a device, allowing some level of offline access with cached resources while maintaining user information, permissions, and other information.
APIs and web applications
JWTs make building APIs and web applications simpler by enabling stateless authorization and rich user information. They are useful for authentication API access without server-side sessions. They simplify authentication by directly including user roles and permissions in the token, as you can see with the Zoom application authentication.
“JWTs are essential for modern applications, enabling secure, efficient communication across platforms.”
Conclusion
JWTs provide a lightweight method for managing and securing authentication and data exchange. JWT might be a good fit for organizations that require specific security measures and scalable resources.
Visit LogicMonitor’s support section or join LM’s community discussions to learn more about JWT implementation and security best practices.
FAQs about JSON Web Tokens
What is the role of JWTs in microservices architectures?
JWTs enable secure and efficient communication between microservices by allowing stateless authentication and authorization.
How can JWTs enhance mobile application security?
JWTs allow mobile apps to authenticate users securely by carrying encrypted user data and permissions, reducing the need for server-side session storage and improving performance.
What are the potential security pitfalls of JWT implementations?
Common pitfalls include algorithm confusion, weak secrets, insecure client-side storage, and improper token validation, all of which can compromise security if not addressed.
How do JWTs differ from other token types like OAuth?
JWT is a token format, while OAuth is an authorization framework. JWTs are often used as tokens within OAuth implementations.
What are the best practices for managing JWT expiration and renewal?
Implement token refresh mechanisms and set appropriate expiration times, such as short-lived access tokens and long-lived refresh tokens, to obtain new access tokens, ensuring continuous access while maintaining security.
In a separate article, we introduced the concept of performing synthetic transactions with LogicMonitor to ensure website services are up and running correctly. It may be necessary to authenticate with a website before you can fully monitor it, and authentication may require presenting an MFA code that has been delivered via email. Let’s take this a step further and incorporate an MFA (Multifactor Authentication) Challenge. This challenge consists of requesting that an MFA code is sent to a registered email address (Gmail), retrieving the MFA code, and presenting the code to the website to complete the MFA challenge.
Setup the Gmail API
We will use Gmail as the public verified email address since Gmail has a robust API that makes this process fairly easy. The MFA service check will access the Gmail account to get the MFA code requested from the web page.
First, we have to enable the API and authenticate to Gmail. This can be done by following their Quickstart guide.
Step 1: Enable the Gmail API
Click the “ENABLE THE GMAIL API” form button to generate the credentials.json file. Place this file in the same directory as your Python script.
Step 2: Install the Google Client Library
Run the following pip command in your Python environment.
pip install --upgrade google-api-python-client google-auth-httplib2 google-auth-oauthlib
Step 3: Setup and run the sample script
The sample script will authenticate to the Gmail account. Run the script as any other Python file. A popup window will ask you to authenticate to Google, and once authenticated, a token.json file will be generated. Copy this file to the same directory containing your Python script and the credentials.json file.
Python Script
Add these imports to your Python script to access the Gmail API:
from __future__ import print_function
from googleapiclient.discovery import build
from httplib2 import Http
from oauth2client import file, client, tools
Add this code to your Python script to enable authentication to the Gmail account:
# Get Creds for Gmail
store = file.Storage(‘token.json’)
creds = store.get()
if not creds or creds.invalid:
flow = client.flow_from_clientsecrets(‘credentials.json’, SCOPES)
creds = tools.run_flow(flow, store)
service = build(‘gmail’, ‘v1’, http=creds.authorize(Http()))
To read the MFA code we use two Gmail functions.
The first function is ListMessagesMatchingQuery
def ListMessagesMatchingQuery(service, user_id, query=”):
“””List all Messages of the user’s mailbox matching the query.
Args:
service: Authorized Gmail API service instance.
user_id: User’s email address. The special value “me”
can be used to indicate the authenticated user.
query: String used to filter messages returned.
Eg.- ‘from:user@some_domain.com’ for Messages from a particular sender.
Returns:
List of Messages that match the criteria of the query. Note that the
returned list contains Message IDs, you must use get with the
appropriate ID to get the details of a Message.
“””
This function returns a list of messages matching the query. In this case, we are using a query to get the MFA code from a specific sender ([email protected]).
messLst = ListMessagesMatchingQuery(service, ‘me’, ‘from:DoNotReply@MFACodesRus.com‘)
The Next on is GetMessage
def GetMessage(service, user_id, msg_id):
“””Get a Message with given ID.
Args:
service: Authorized Gmail API service instance.
user_id: User’s email address. The special value “me”
can be used to indicate the authenticated user.
msg_id: The ID of the Message required.
Returns:
A Message.
“””
The ListMessageMatchingQuery function returns a list of messages in the order they were received; the most recent message will have an index of 0. We can retrieve the most recent message with the following code:
body = GetMessage(service, ‘me’, messLst[0][‘id’])
Next, we need to use a regular expression to extract the MFA code. The appropriate regular expression may vary depending on the contents the MFA email. In this example, the message appears as:
You’ve requested a one-time passcode for authentication purposes; your one-time passcode is 519643.
Once you use this code, you will need to request a new code the next time you are asked to provide one. If you believe that you are receiving this email in error, or if you did not request the code to be sent to your email address, please contact Logicmonitor Credit Union at (888) 415-6442 for further assistance.
Please do not reply to this email.
I kept this simple and just used a ‘\d+’ to look for digit codes.
Browcode = re.findall(‘\d+’, body[‘snippet’])
The MFA code is now stored in a variable and can be used where needed by your Python script.
In this article, we expanded the use of synthetic transactions to include performing MFA challenges. This functionality allows you to fully automate the multifactor authentication process required by the website you wish to monitor.
Implementing browser automation for your business doesn’t have to be daunting or cumbersome. The LogicMonitor Professional Services team has the talent and is up for the challenge! Ask about a free LogicMonitor Professional Services scoping call or free trial.
Background
In a separate article, we introduced the concept of performing synthetic transactions with LogicMonitor. An obviously crucial step of that process is actually scripting the automation. You can have all the right automation tools installed but how do you get started with the actual script? This article will help illustrate some of the preparation needed for developing a browser automation script.
Choose a Browser
You will need to choose a browser for visually inspecting a website and performing automation. While it makes sense to prioritize automated service testing through the same browser as most of your customers would, you should be able to get the same results visually inspecting a website’s elements in any popular browser.
Consider browsers that are compatible with Selenium, a browser automation tool we’re using in our series of articles on executing synthetic transactions with LogicMonitor. Selenium offers webdrivers for some of the most popular browsers:
- Mozilla Firefox
- Google Chrome
- Microsoft Internet Explorer
While Firefox and Chrome generally render websites similarly, Internet Explorer is traditionally an outlier. If you can be flexible, consider starting with Firefox or Chrome.
Choose the Right Website
Your first website choice for browser automation might not be the best choice. How can you tell? The largest factor is whether the webpage elements can be easily identified by an id or class name rather than an XPath. If none of that made sense to you, it’s okay. For now, choose a website but keep in mind that as you continue reading, you may discover it is not the most conducive to automation.
Keep Responsive Web Design In Mind
Many modern websites are designed to adapt or respond, to various screen sizes in order to accommodate desktops, laptops, and handheld devices such as mobile phones. Sometimes web page elements rearrange themselves in order to fit smaller screen sizes. In some cases, elements disappear entirely! You want to keep window size in mind before you attempt to identify elements and automate browser activity.
One way to test responsiveness is to simply resize your web browser. In most cases, resizing your browser to 50% of the screen’s width will be enough to trigger a responsive design. Alternatively, those who are already familiar with browser web developer tools can use those options to simulate other device screen sizes.
Locating Web Page Elements
The Challenge
Consider the login form illustrated below.

Visually, it is obvious what actions you would take to use a login form: click the username field, type username, click the password field, type password, and click the login button. Without thinking, you visually locate the elements you need to use and take action. What about programmatically?
The Solution
HTML elements can be located in many ways, three of which being:
- ID
- Class name
- Xpath
One of the benefits of developer tools in modern browsers is the ability to inspect HTML elements in order to see details such as their id, class, and xpath. The inspection process is mostly visual, resulting in a favorable learning curve. You don’t need to be an expert on HTML, CSS, or JavaScript. Consider again the following user form.
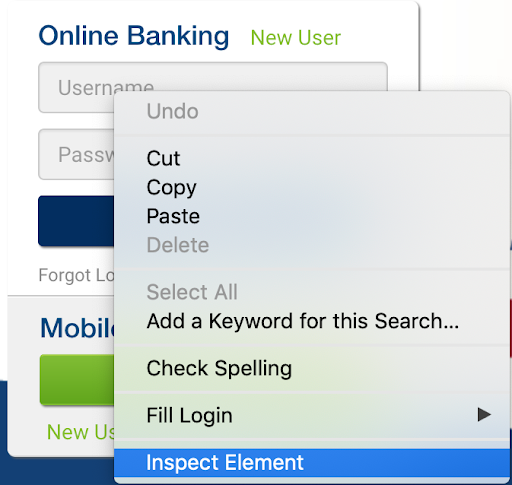
Assuming the default mouse configuration, you could perform an inspection on the username field by right-clicking on the username field to expose a contextual menu and left clicking on the “Inspect Element” menu option. See the illustration below.
After inspecting the username field you would see the web developer tools open automatically and highlight, in blue, the HTML that represents the username input field. You would focus your attention only in the section highlighted in blue for now. The screenshot below is from Firefox’s web developer tools.
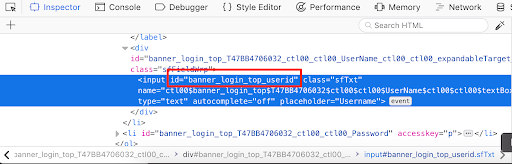
You don’t need to understand everything you see. Just look for “id=”. While we technically could also use the class name (“class=”) and Xpath (not illustrated), it is best to prioritize the id because element ids are unique in HTML. Locating HTML elements in any other way either increases the risk or the complexity of locating the right elements. Repeat the inspection process for both the password and login buttons, capturing ids for both when possible.
Remember Element Actions and Wait Times
Some HTML elements such as buttons trigger an action. A login button, for example, typically will submit information to a website and cause the browser to navigate to another page. This loading time is never instantaneous. There is at least some delay that should be considered during browser automation. Remember where these delays are.
You can ballpark the times as long as you are generous (remember not all network connections are equal). You also have the option of using the browser’s web developer tools to measure when a page finishes loading. Be sure to have the developer tools open to the Network section before navigating to a page. The screen capture below illustrates a load time measurement for Google’s home page in–simply to demonstrate flexibility–Chrome’s developer tools rather than Firefox.

You might wonder why the “Finish” time is almost 6 seconds. The Google homepage practically loads into a usable state in under a second; however, the homepage continues to transfer some background data. If you continue waiting, you would see the finish measurement update from 1 second, to almost 6, to as much as 5 minutes. A 5 second wait time would be fine, but, 5 minutes is overdoing it. This is where visual inspection and human discern
ment is important.
Conclusion
In this article, we expanded upon the idea of executing synthetic transactions within LogicMonitor using Selenium, a tried and true automation tool, and Python, one of the most popular scripting languages. By visually inspecting and navigating web content with browser developer tools, you can start planning advanced browser automation that goes beyond recording rigid steps.
Implementing browser automation for your business doesn’t have to be daunting or cumbersome. The LogicMonitor Professional Services team has the talent and is up for the challenge! Ask about a free LogicMonitor Professional Services scoping call or free trial.
Background
Synthetic transactions facilitate proactive monitoring of online business services such as e-banking and e-commerce. They not only monitor existing services but can be used to simulate and test the quality of future user interactions with services. LogicMonitor includes Website Checks out-of-the-box but did you know that Scripted DataSources can be used to extend website monitoring into synthetic transactions? This is the first in a series of technical articles on extending LogicMonitor’s capabilities via two popular technologies: Python and Selenium.
It is important to note that solutions presented in this article involve slight modifications to host environments. Your Collector hosts are yours to control and with great power comes great responsibility. As you add more scripting and programming language support to your Collector hosts, be sure to refer to their documentation and adhere to recommended security practices. Also, leverage your IDE and code linters to point out aberrant coding practices. Finally, do your best in documenting changes to your environment and leaving room to rollback modifications.
Performing Synthetic Transactions in Vanilla LogicMonitor
Out-of-the-box, LogicMonitor offers two forms of website monitoring:
- Standard Web Check, which uses web requests in order to confirm website availability from predefined LogicMonitor locations
- Internal Web Check, which uses a Collector host and user-defined Groovy script in order to confirm website availability from inside the customer’s network
During my Professional Services engagements, some customers required deeper support using our Website Checks:
- Identifying HTML elements in a Document Object Model (DOM), especially elements and information related to login forms
- Accounting for JavaScript, particularly JavaScript redirects
- Scripting in Groovy
- Performing synthetic transactions such as completing a multi-factor authentication (MFA) process
The first concern is addressed in our support doc Web Checks with Form-Based Authentication. We also offer online support accessible via our website or the product, as well as Professional Services to help customers with Web Check configurations for any complexity. I aspire to address the remaining concerns.
Spotlight on Selenium
Front and center for our synthetic transaction solution is Selenium, a test automation technology particularly focused on web browser automation. If you have experience in front-end quality assurance, then you are probably well acquainted. Using the Selenium WebDriver, we can programmatically navigate to web pages, find specific HTML elements on a page such a login form, and interact with those elements.
Selenium easily addresses the concern of JavaScript redirects. Navigating simple to complex web pages are no challenge for Selenium because it executes the automation in an actual browser. You could grab popcorn and watch the magic if you wanted. Alternatively–and I do recommend this–you can execute your automation in a headless mode, which hides the browser in exchange for increased execution speed.
Selenium boasts cross-platform support for the following operating systems:
- Linux
- Microsoft Windows
- Apple Mac OS X
Scripting and programming language support is even more impressive:
- Python
- Java
- Ruby
- C#
- JavaScript
- R
- Perl
- PHP
- Objective-C
- Haskell
While the LogicMonitor product makes embedded Groovy and PowerShell scripts easy, you technically can configure your LogicMonitor Collector hosts to support any of the aforementioned languages. This would effectively expand your monitoring capabilities through LogicMonitor DataSources and Internal Web Checks (remember these execute from Collector hosts).
Partnering with Python
Whether you love it or hate it–Python often gets the job done. Stack Overflow, a common developer resource well within the top 100 websites visited in the world, has found Python to be one of the fastest growing scripting languages particularly in “high-income countries”.
![]()
This year over a third of developers responding to a Stack Overflow survey responded that they use Python, and, a recent Dice article cited Python’s ease of use and flexibility as a significan
t factor for its popularity within the data science realm. Python is worth learning due to its sheer popularity alone. Thanks to that popularity and its compatibility with Selenium, finding code examples and getting started with web automation is easy.
Getting Started in 5 Steps
The following steps will help technical readers start performing synthetic transactions with LogicMonitor:
- Choose development and production operating systems for your automation. You can develop your Python script(s) in any operating system supported by Python (e.g. Linux, Windows, Mac OS X, and more). Plan to align the operating system compatibility of Python, Selenium, and LogicMonitor Collectors. In this case, you want to be more granular in your choice of major platform. For example, you may have developed your Python script in a Windows 10 environment, but, you would execute in a Windows Server environment due to LogicMonitor Collector compatibility.
- Install Python in your development and production environments. I personally prefer Python 3.7 in general for its introduction of dataclasses and it is the version I tested against. Python 3.6 would be a fair choice for stability given its current stage of releases. I recommend avoiding and migrating away from Python 2.7 as it will approach End of Life in 2020.
- Optionally, install virtualenv. This step is for those who appreciate the repeatability and reproducibility practices often found in the Dev Ops realm. One benefit of virutalenv is that it will install your Python libraries in a temporary location. It can be used in development environments to help isolate and track the minimum, required Python libraries to execute a scripted solution. This benefit is usually combined with a Python Pip requirements file, which documents the required libraries and facilitates their automatic installation. Read the virtualenv installation and user guides before proceeding to the next steps.
- Install Selenium. This could be a two-phased approach depending on your browser support requirements. First, install Selenium Python libraries using Python Pip (automatically included in your Python installation). Second, install a web driver. Firefox will require the Gecko web driver. Chrome requires the Chrome web driver. You should pick your preferred browser for reliability testing.
- Finally, author your automation script. Expect an in-depth example from this article series in the near future. For now, you can use the official Selenium documentation for help, or, find examples online at places like Stack Overflow. Just remember that in order to combine your automation script with LogicMonitor, the script must output results in an accepted format.
Potential Business Impacts
Synthetic transactions with LogicMonitor can positively impact your business, providing a competitive edge in MSP services portfolios, and, enabling internal IT teams to track the reliability of business services.
Conclusion
In this article, we introduced the execution of synthetic transactions in LogicMonitor using Selenium, a tried and true automation tool, and Python, one of the most popular scripting languages. In just 5 steps, the script-savvy can get started. Need help? Ask about a free LogicMonitor Professional Services scoping call.
Want to see more? Follow us here:
On Facebook
On Twitter
On LinkedIn
Or, e-mail us @ [email protected]
So, if you are in marketing, or know someone in marketing – you probably heard that Marketo had an outage this week, and it was all over the twitter-verse. The issue was that Marketo failed to renew their DNS domain. Which is unfortunate, but entirely understandable. We sympathize. Things happen. People are imperfect, and make mistakes.

That is why you should always have monitoring for things that people are in charge of. That whole “trust, but verify” principle. Or, think of the monitoring as a safety net. If someone forgets to renew your domain – it would be much better to have an alert trigger and remind them, than have your domain fail to resolve, thus breaking your product’s functionality, and incurring the wrath (and humor) of the internet.
To be honest, domain expiration wasn’t something that LogicMonitor monitored. But, as we note in Part 2 of our “Datacenter monitoring mistakes”, “No issue should be considered resolved if monitoring will not detect its recurrence.” And they don’t have to be your own issues – you (and we) can learn from the public mistakes of others. So, in that spirit, one of our Datasource Engineering team (the awesome Jon Davis) whipped out a quick check to measure the days to expiry of top level domains, and alert you if the domain is expiring within 7 days.
So now you can take advantage of this enhancement to LogicMonitor to avoid your domains expiring. To do so, import this datasource from the LogicMonitor Exchange, using locator HCZPGR.
Note: currently this datasource doesn’t support domains in country TLDs (like google.co.uk); only the regular top level domains like .com, .net, etc. This is why it’s a community standard datasource, and not in our core repository – it still needs a little work.
Once you have the datasource imported, you need to associate it with some device, by setting the property system.categories to include the tag “domain”.
We recommend you add a device specifically for domain monitoring (e.g. add a device “yourdomain.com”, and set the system.categories tag on it.)
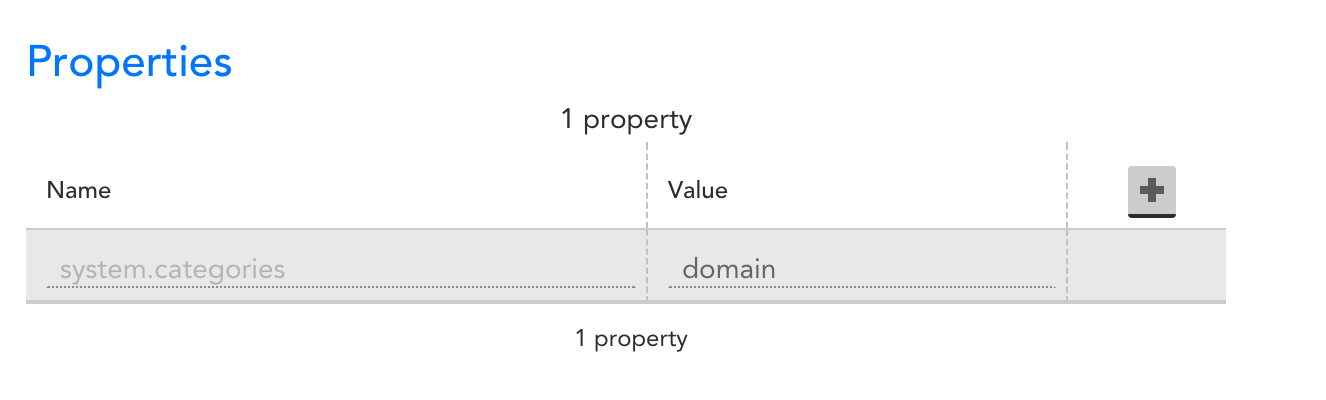
This won’t immediately trigger any monitoring, but will associate the datasource with the device, allowing you to add instances to monitor for domain expiration:
Select “Add monitored instances” from the Manage drop down:
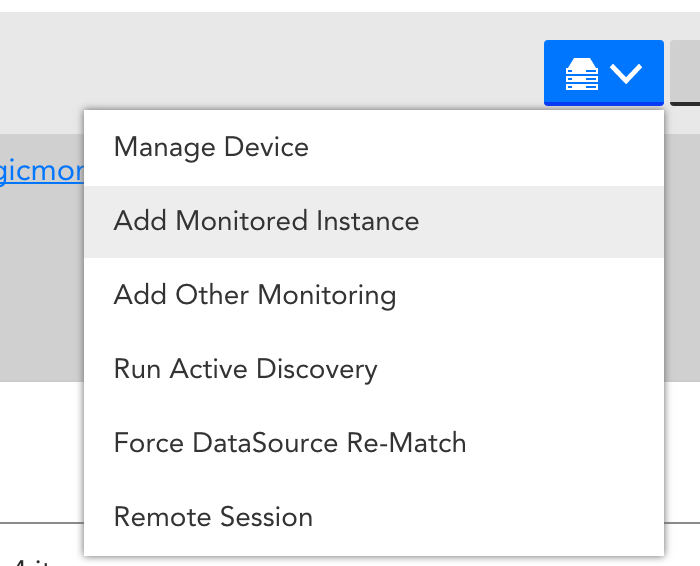
then enter the top level domain that you wish to monitor:
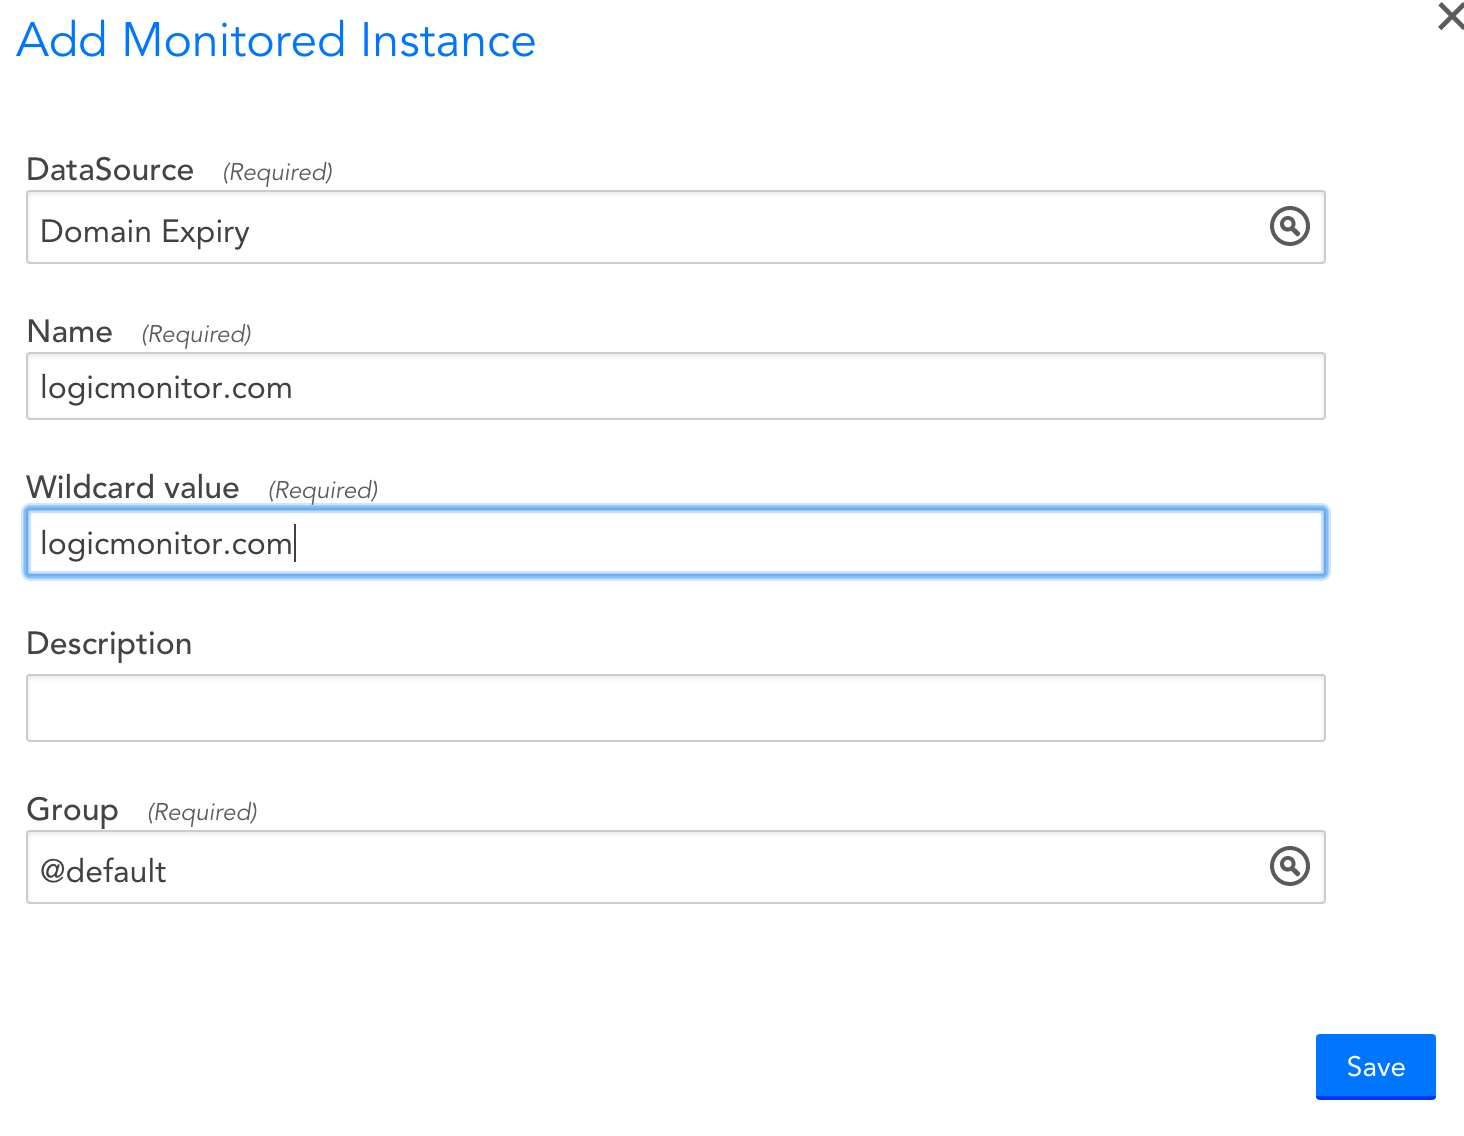
Note: only use the top level domain (like “logicmonitor.com”), not a subdomain (like “logicmonitor.com”)
You’ll now get graphs showing the days until the domain registration expires. In the graph below, you can see Marketo renewed their domain for 7 years:
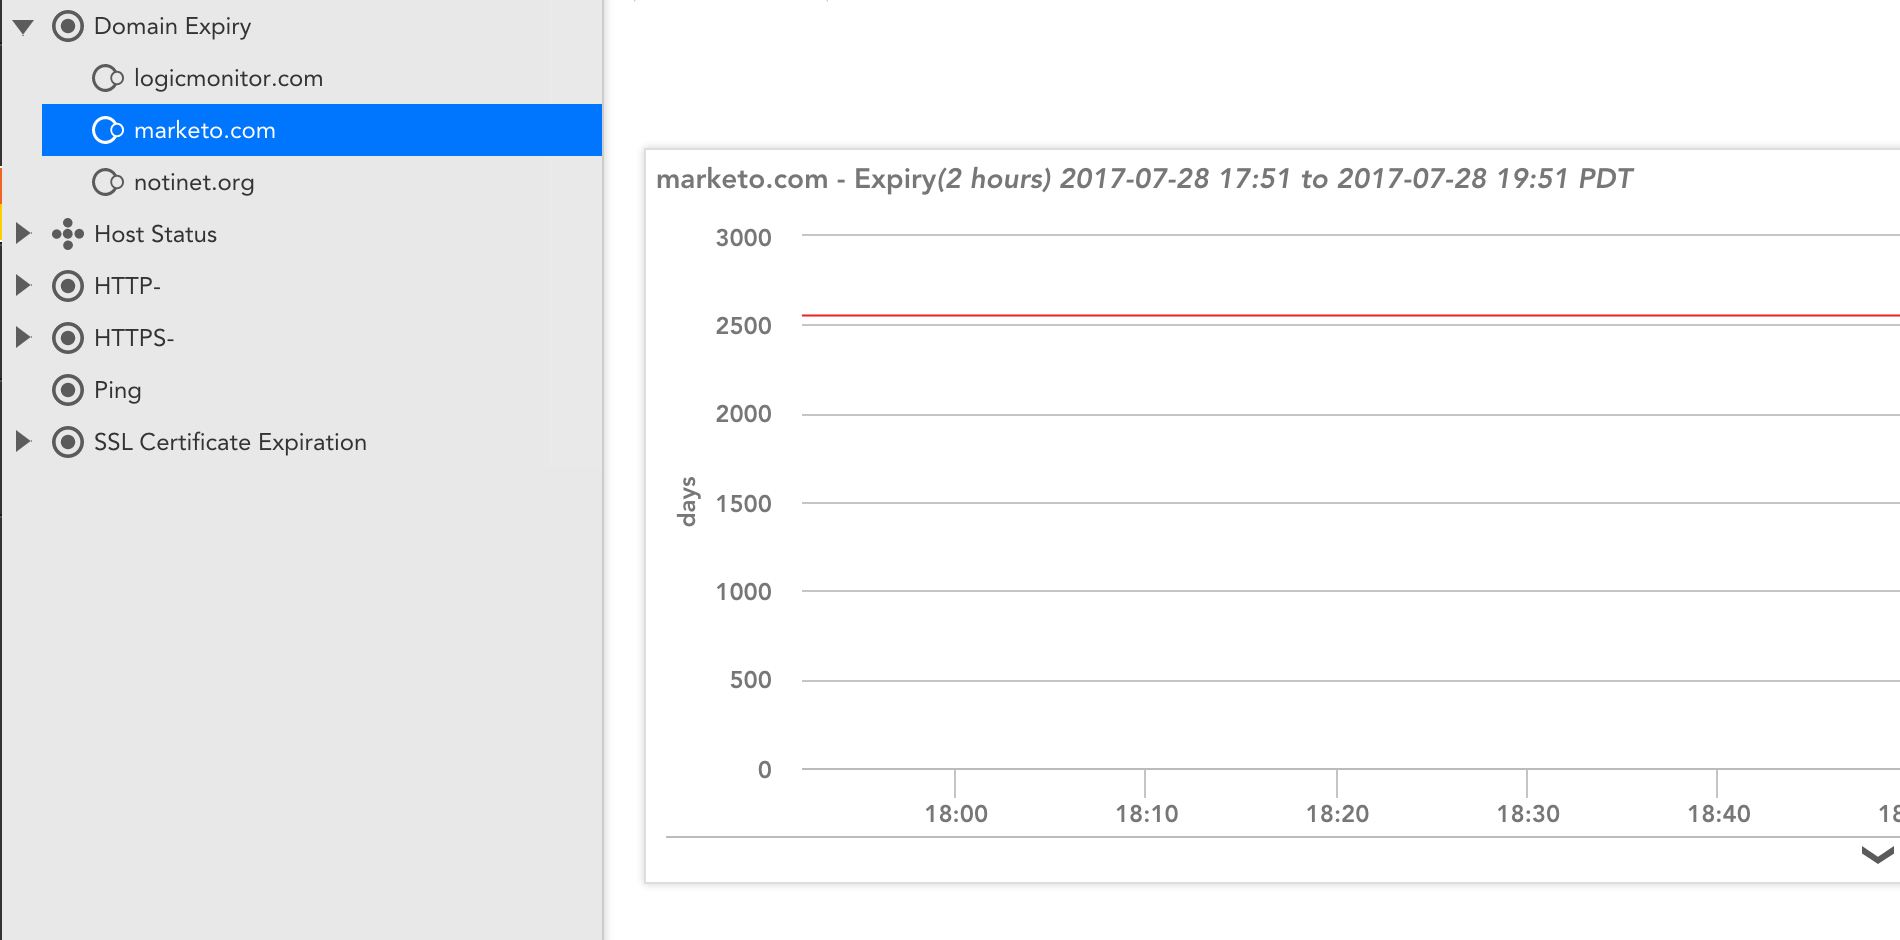
So Marketo is safe from another domain registration failure for awhile – at least for that domain. But we might suggest they look at some flexible SaaS based Enterprise IT Monitoring to ensure the availability of their other domains. And perhaps you should too.