Your infrastructure isn’t confined to a single location anymore. It’s spread across clouds, containers, and on-prem systems, and every layer is spitting out logs: access attempts, performance spikes, error codes, config changes.
That data is invaluable if you can find the signal in the noise. But with millions of logs flying by every day, that’s easier said than done.
That’s where log monitoring comes in: the practice of collecting, indexing, and analyzing log data to troubleshoot issues and understand system behavior. But as environments grow more distributed, and teams are pushed to fix faster and cut through more noise, monitoring alone isn’t enough. Neither is just having access to search log data.
That’s where log intelligence enters the picture. It goes beyond log ingestion and search to deliver real-time pattern recognition, anomaly detection, and service-aware context, so you can move from reacting to predicting.
Let’s break it down.
TL;DR: Shifting from traditional log monitoring to log intelligence is essential for modern IT to go from reactive to predictive.
Log monitoring helps you troubleshoot and catch issues before they escalate, especially in hybrid and multi-cloud environments.
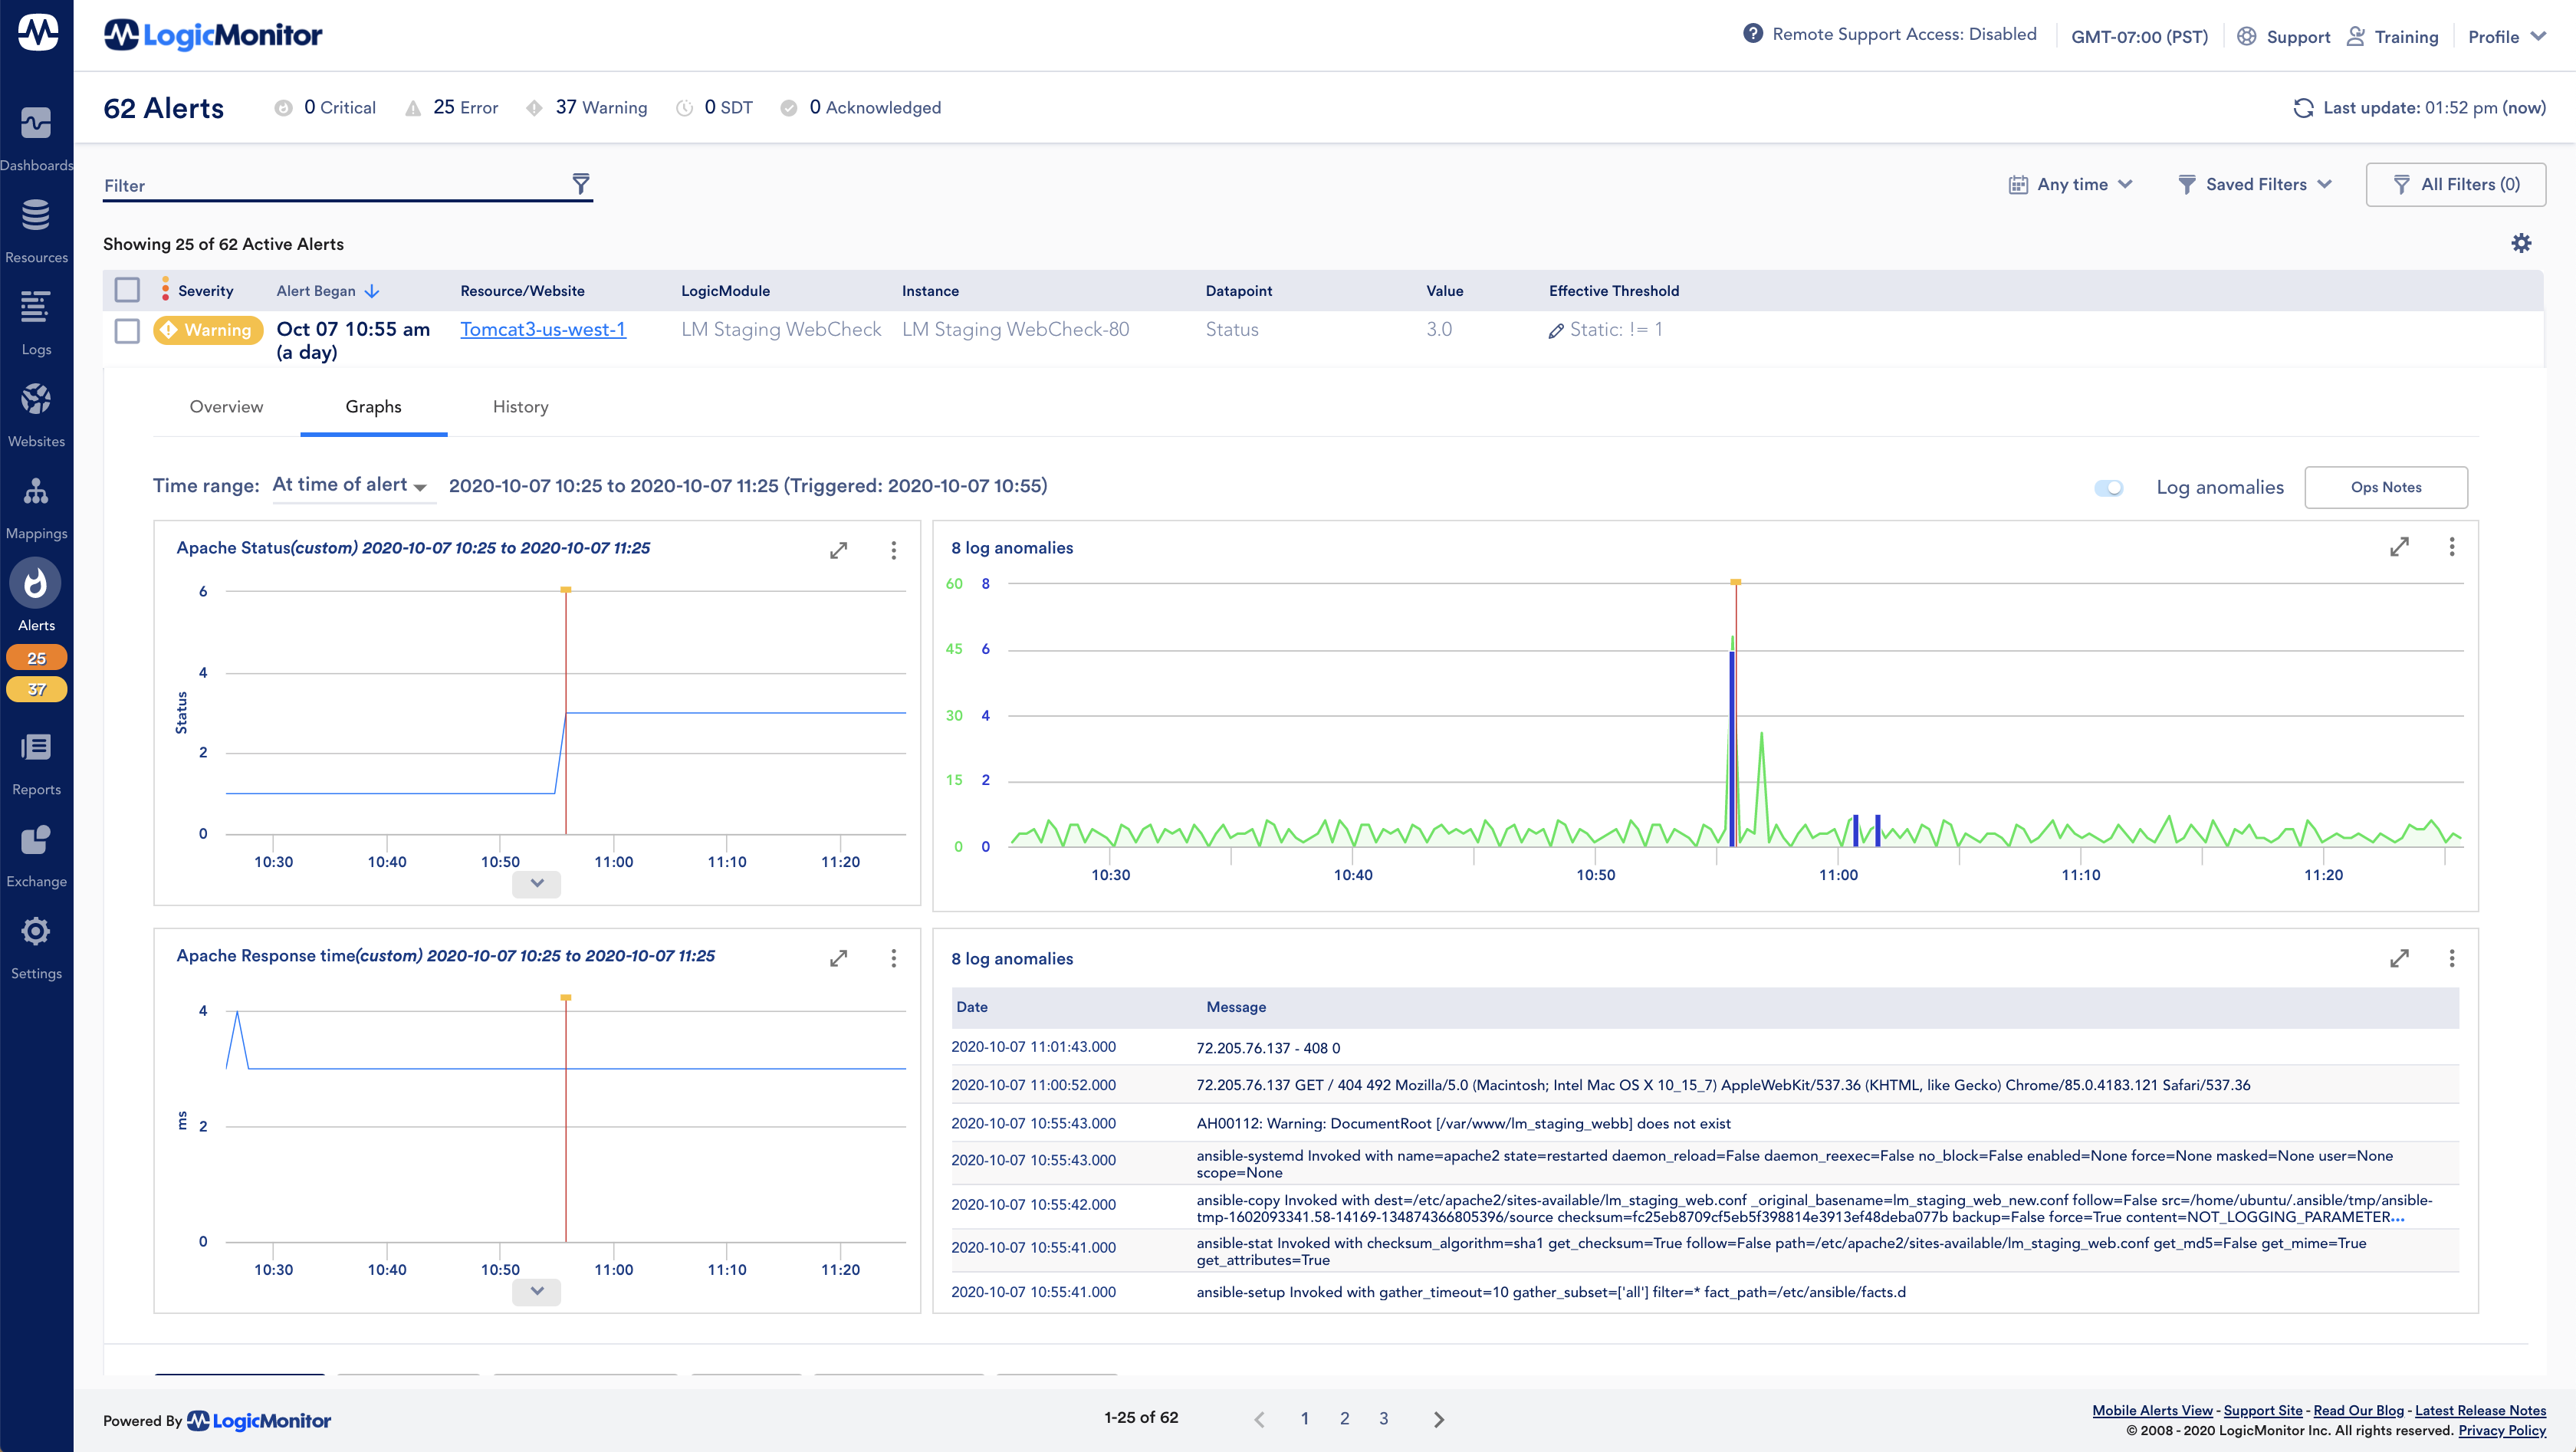
As a part of the LogicMonitor Envision AI-powered observability platform, LM Logs surfaces unusual log messages and automatically connects log data to other resource telemetry, such as metrics and alerts.
LM Logs takes it further, transforming large amounts of related data into prioritized insights so your team can act fast and with full context.
What Is Log Monitoring?
Every device, service, and application in your environment, from cloud services and containerized apps to on-prem infrastructure and legacy systems, generates logs. They capture what’s happening under the hood: what changed, what failed, and sometimes, what broke everything.
Log monitoring is the practice of collecting, storing, monitoring, and analyzing logs to understand system behavior, catch issues early, troubleshoot faster, and make better decisions in real time.
When it’s working, log monitoring gives you the visibility to act fast. When it’s not, you’re stuck in reactive mode, scrolling through thousands of lines, writing custom queries, and chasing down false leads.
Why Monitoring Alone Isn’t Enough
Traditional log monitoring focuses on visibility. But visibility without context can still leave teams in the dark.
Today’s environments produce more data than any human can parse on their own. And most teams don’t have the time (or the bandwidth) to build complex queries every time something breaks.
That’s why teams are shifting from basic monitoring to log intelligence.
What Is Log Intelligence?
Log intelligence is the next evolution of log monitoring. Instead of just collecting and searching logs, it helps you:
Automatically detect unusual behavior in log data—no manual rule-writing required
Surface never-before-seen patterns and behavioral shifts
Correlate logs to alerts and metrics, so you can start triage with context
Prioritize what matters based on severity, frequency, or business impact
It’s observability with an opinion. And it’s built into LM Logs, where AI helps teams cut MTTR and prevent without adding alert fatigue.
Log analysis turns raw data into real-time insights that boost performance and security.
Common Challenges and How Log Intelligence Solves Them
Too Much Log Data, Not Enough Insight
You’re flooded with logs from cloud services, network devices, security tools, and more. But when data is scattered, unstructured, or aging out to save space, it’s nearly impossible to find what’s useful, let alone fast enough to act.
Modern log intelligence fixes that by:
Indexing log data for real-time, full-text search
Applying smart retention policies so you keep what matters
Reducing noise with filters and pattern recognition, not guesswork
Critical Signals Get Lost in the Noise
Even with centralized logging, critical log events can still get buried, especially when high-volume systems flood your tools with repetitive info. It’s not possible to have prior knowledge of or create rules to surface all the unusual activity in log data. Additionally, you miss the warning signs (like a failed service restart or unexpected config change) because they’re buried under a pile of “normal.”
Modern log intelligence helps by:
AI-powered analysis to detect unusual system behavior present in log data
Surfacing “never-before-seen” logs without creating rules or having prior knowledge of what to look for
Ranking logs by severity or sentiment to help teams triage what matters first
Disconnected Tools, Siloed Teams
You’ve got metrics in one tool, logs in another, and tickets in a third. When your platforms don’t talk to each other, neither do your teams, and every alert takes longer to resolve.
Modern log intelligence solves this through:
Correlating logs, metrics, and alerts in a unified and repeatable workflow
Providing shared context for ITOps, DevOps, and SecOps
Showing full service impact—not just isolated events
Slow Troubleshooting Wastes Time (and Credibility)
When something breaks, you don’t have time to scroll through thousands of log lines or write custom queries under pressure. Every minute spent chasing the wrong lead is a minute more of degraded service, service-level agreement (SLA) risk, or frustrated users.
Grouping related log messages into patterns for faster triage
Linking logs to the alert or system that triggered them, so you start with context
Security & Compliance Risks Hide in the Gaps
Logs contain sensitive data, including personal details and system secrets. If they’re not protected, searchable, or appropriately retained, you’re not just exposed, you’re out of compliance.
Modern log intelligence can help security teams stay audit-ready by:
Creating tamper-evident audit trails with full user and system activity
Detecting suspicious behavior in real time (like failed logins or unauthorized changes)
Generating exportable, time-stamped reports for frameworks like HIPAA and ISO 27001
From Log Chaos to Service Clarity
Log intelligence isn’t just about collecting data. It’s about giving your team the visibility, speed, and context to stay ahead of incidents, instead of reacting to them after the fact.
The best teams don’t waste time writing queries or switching between tools. They use observability platforms with AI-driven log functionality that surface anomalies automatically, tie logs to the alerts that matter, and filter out the noise before it ever hits their screen.
That’s the difference between hunting for problems and fixing them fast. And it’s what log intelligence—done right—delivers on.
FAQs
Answers to your most frequently asked questions on log monitoring →
1. How does log intelligence fit into a broader log management strategy?
Log intelligence focuses on surfacing insights and anomalies. But to get the full picture, it should be part of a complete strategy that includes collection, retention, archiving, and compliance.
2. What types of log files should I prioritize in hybrid or multi-cloud environments?
System logs, application logs, access logs, and audit trails are the top priorities. They provide the clearest signals for troubleshooting, performance tracking, and security.
3. How does log intelligence correlate logs with alerts and metrics?
Modern platforms align data by time, source, and service relationships. This lets you see what happened, where it occurred, and why, without needing to build complex queries.
4. Can logs be correlated even without trace IDs or shared metadata?
Yes. AI-powered tools can spot related events across systems by looking at timing, patterns, and context, even when IDs are inconsistent or missing entirely.
5. What’s the best way to reduce noise and avoid alert fatigue in log monitoring?
Use pattern recognition, severity filters, and anomaly detection to filter out routine logs. Let the platform highlight what’s new, unexpected, or critical.
6. How do I control storage costs without losing important log data?
Apply tiered retention policies. Store high-value logs longer, archive older ones for compliance, and drop redundant data to cut costs without sacrificing visibility.
7. What are the common challenges teams face when scaling log monitoring?
Teams often run into too much data, disconnected tools, and slow triage. Without strong correlation and prioritization, it’s easy to chase noise or miss what matters.
8. How do log intelligence tools detect anomalies without manual rules?
They learn what’s normal for each system, then flag deviations automatically. That means faster responses to things like failed logins, traffic spikes, or new patterns—no rule writing required.
e-book
Logging made easy – with LM Logs
LM Logs empowers Ops teams to put the operational focus back on logs without sacrificing productivity
Log data is one of the most context-rich data sources Ops teams ingest. But benefiting from that data is often a struggle with antiquated tools, siloed operations, inability to access the data, and manual collection – not to mention the difficulty of diving through the massive noise of log volume.
Download this eBook to learn how LM Logs was built to empower ITOps and DevOps. Cut through the red tape to pinpoint root causes with contextual and centralized log data. With LM Logs, discover exactly what is happening across your hybrid and multi-cloud environments, where the issues occur, and why.
In this E-book we explore:
How to correlate logs and metrics to centralize data
Benefits of LM Logs for Ops teams of all skill levels
LM Logs streamlines access to log data for Ops teams to resolve business-critical issues efficiently within hybrid and multi-cloud environments.
Features include:
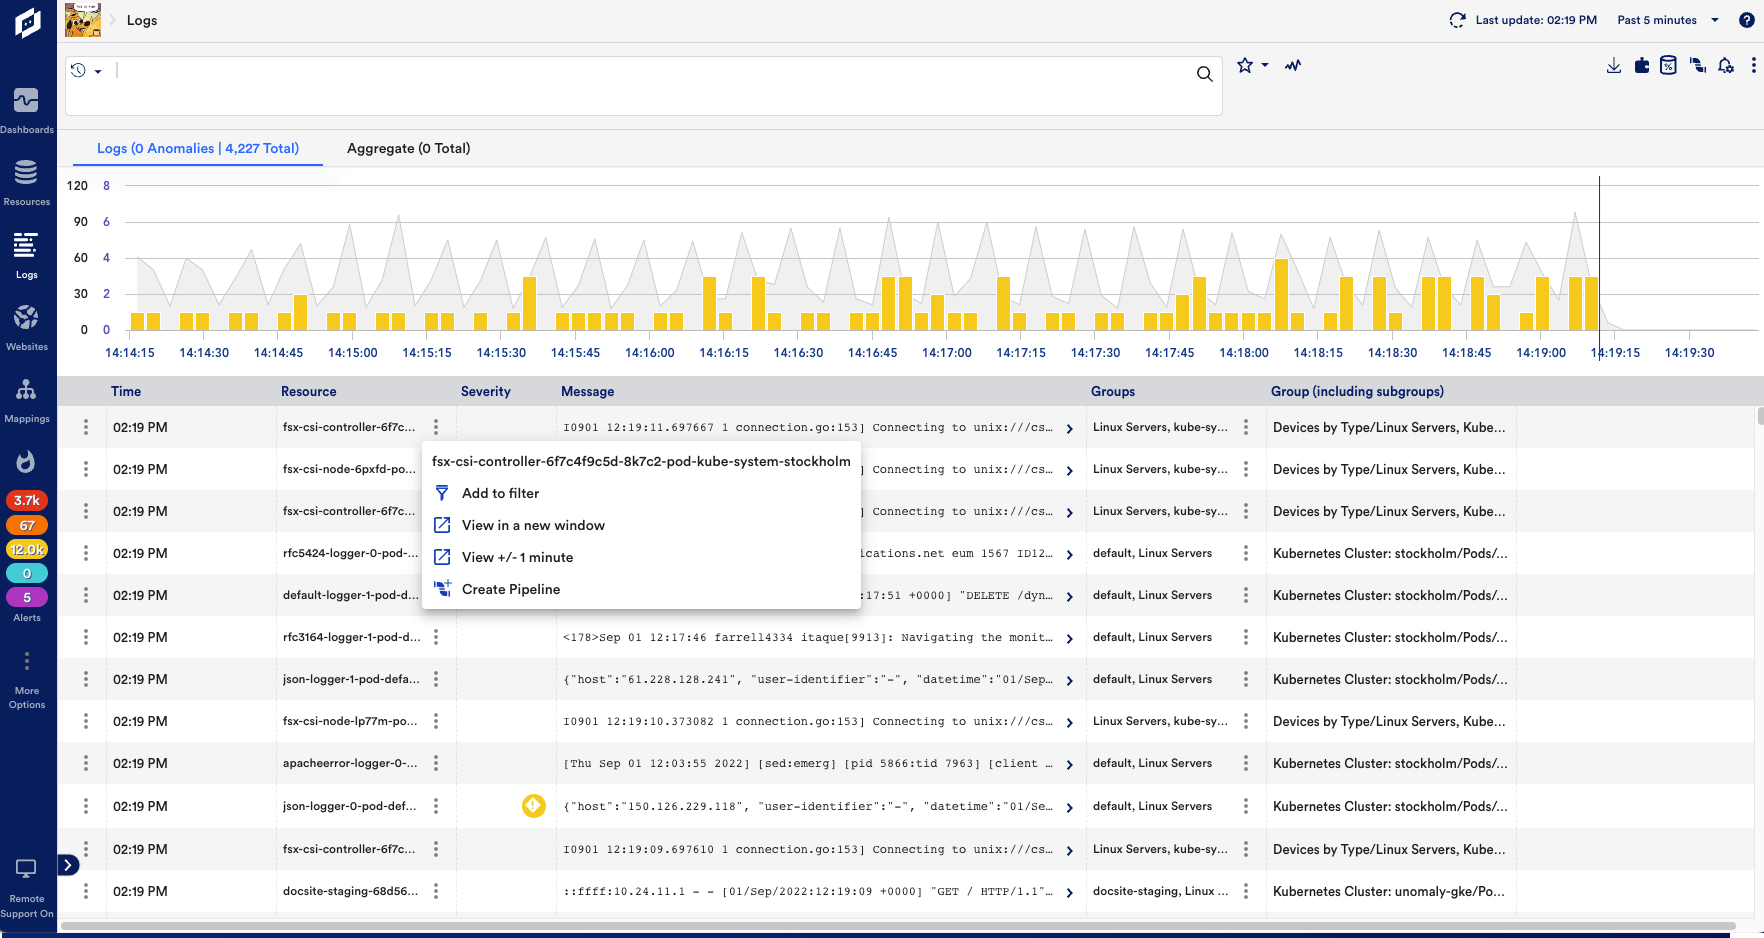
Importing log data to LM Envision for monitoring and analysis
Unified logs and metrics within LM Envision
Intelligent log-based anomaly detection
Automation correlation via alerting
Intelligent log-based anomaly detection
Sophisticated algorithms automatically analyze every element of log data events to detect anomalies and surface them alongside infrastructure alerts for proactive troubleshooting.
Rapid Troubleshooting via centralized log data
Pivot from metrics to logs in-context to uncover insights across infrastructure resources to remove dead-end investigations.
Dynamic observability experience
Remove monitoring blind spots by adding context-rich IT and log data to every tech stack layer—in both hybrid and multi-cloud environments.
Enterprise-scale SaaS platform
Built on LogicMonitor’s enterprise-scale SaaS monitoring platform that successfully monitors complex, multi-cloud, and hybrid enterprise infrastructures at a global scale.
As companies adopt more artificial intelligence (AI) to stay competitive and simplify operations, they’re hitting a snag they’ve seen plenty of times before: complexity. Those user-friendly chatbots and impressive predictive models aren’t magic—they run on powerful GPUs like NVIDIA’s and rely on cloud services such as Azure OpenAI or Amazon SageMaker. Keeping these sophisticated systems running smoothly, especially when they’re spread across hybrid environments, is a challenge well known to many IT professionals.
And legacy solutions aren’t built for the task. Most IT teams end up using several monitoring solutions, each covering just one piece of their setup. But juggling multiple platforms creates blind spots, slows your team down, and makes solving problems proactively almost impossible. That’s why having a clear, unified observability system makes all the difference. It helps you see everything in one place, so your team spends less time fixing things and more time building what’s next.
Unified Monitoring of Hybrid and AI Environments
LogicMonitor Envision gives your team one clear view of all your AI workloads and critical systems, no matter where they’re running—on-prem, in the cloud, or on the edge. Instead of jumping between separate monitoring solutions, you get all your essential metrics and alerts in one place, making it easy to spot and fix issues quickly.
Good observability for AI starts by knowing exactly what to watch. Metrics like how many requests you’re handling, how quickly your systems respond, and how hard your GPUs are working are a great place to start. To really understand performance, you need data from different sources—logs, user activity, and system metrics—pulled together to create a clear picture. By regularly looking at this data, your team can spot issues early and make quick adjustments. Plus, keeping clear records and sharing regular updates ensures everyone stays informed about how your AI systems are doing.
Dive deeper into observability for AI workloads on LM Envision
LM Envision makes it easy for your IT team to find and track your AI resources—whether they’re running in your own data center or private and public clouds, or using services like Azure OpenAI, Amazon Bedrock, and Amazon SageMaker. With our resource discovery feature, your team can quickly see AI assets right alongside traditional infrastructure, all in one place. To get started, just select “AI and LLMs,” and LM Envision will walk you through it.
Select “AI and LLMs” to start discovering AI-related resources.
Optimizing AI Resource Usage and Cost Control
Once your resources are discovered, LM Envision gives you detailed insights into how everything is performing. For NVIDIA GPUs, you’ll see exactly how much they’re being utilized, memory use, thermal load, and power consumption. For cloud-based AI services, you’ll be able to track things like token usage and API error rates. All these metrics help your team make smarter decisions around budgeting, sustainability, and model performance. Plus, you can set up customized alerts and access controls, keeping your systems secure and efficient.
Select “Learn how” under the AI resources you want to discover and add to monitoring. A discovery widget will open and walk you through the process.
And we’re always expanding: soon we’ll support even more services like OpenLit, TraceLoop, and GCP AI Services.
Proactive AI Issue Detection and Resolution
When it comes to keeping your AI systems running smoothly, LM Envision lets your team set dashboards and thresholds so you know immediately when there’s an issue. Whether it’s a GPU that’s overloaded, latency in cloud services, or a sudden infrastructure problem, your team gets real-time alerts, so you can jump in fast, fix things quickly, and keep everything performing at its best.
AI Observability with LogicMonitor Envision
Bottom line: AI success depends on clearly seeing what’s happening across your entire system. LM Envision gives your team the straightforward insights needed to manage your AI workloads proactively. With better visibility and easier management, your IT team can simplify operations, stay sustainable, and confidently scale your AI-driven initiatives.
Syngenta, a global agricultural leader, relies on a complex IT infrastructure to support its operations in 90 countries. Managing a network of 9,000 devices across 400 locations presented significant challenges for their lean IT team. These challenges included an overwhelming volume of daily alerts (up to 12,500), difficulty isolating critical issues, and limited resources for proactive management. This impacted network reliability and hindered their ability to support Syngenta’s mission of global food security.
The Solution: AI-Powered Observability with LogicMonitor
To improve IT performance visibility and enhance business agility, Syngenta implemented LogicMonitor’s AI-powered platform, Edwin AI. This solution provided rapid time-to-value, empowering Syngenta’s lean IT team to proactively manage their complex global infrastructure. Advanced event correlation, exemplified by the immediate discovery of a pre-existing BGP configuration issue, provided proactive insights, enabling faster issue resolution and improved service availability. Seamless integration with existing tools streamlined workflows and minimized disruptions, ultimately supporting Syngenta’s mission of global food security.
Reaping the rewards of intelligent IT management
LogicMonitor’s platform delivered substantial improvements for Syngenta:
80% Reduction in Alert Volume: Filtering noise and prioritizing critical issues.
30% Faster Mean Time to Resolution (MTTR): Accelerated issue resolution through real-time insights.
20% Reduction in Manual Effort: Automating tasks and freeing up IT resources.
Enhanced Visibility and Control: Improved oversight of the global IT infrastructure.
Shift to Proactive Management: Enabling the IT team to focus on strategic initiatives.
Future Plans: Expanding AI-Driven Capabilities
Syngenta plans to leverage LogicMonitor’s AI capabilities, including developing an AI assistant for troubleshooting, implementing predictive analytics for proactive issue prevention, and enhancing root cause analysis. These advancements will further optimize their IT operations and support Syngenta’s continued innovation in agriculture and global food security.
Infographic
4 tips to accelerate time to value
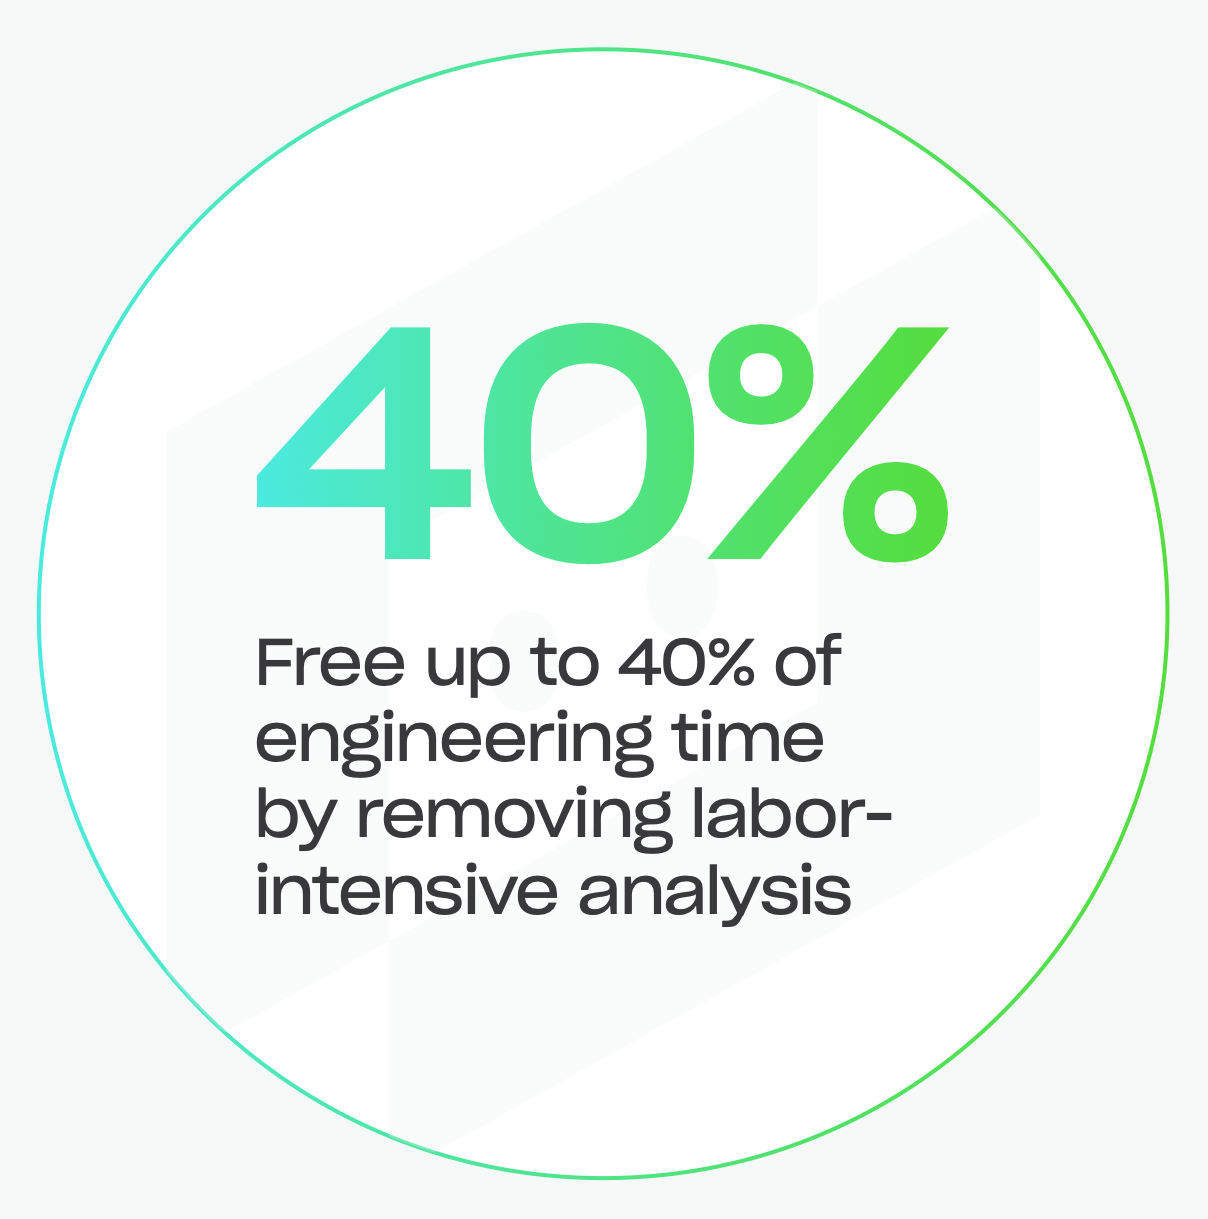
Accelerate your time-to-value journey with four key steps: rapid deployment and ready-to-use templates, predictive capacity management, seamless workflow automation, and significant engineering time savings.
LogicMonitor can liberate up to 40% of your engineering time by eradicating labor-intensive analysis. Step into the future of effortless tech management with LogicMonitor – designed by engineers, for engineers.
Learning from log anomalies: a guide to proactive monitoring
Your customer reaches out to let you know that something isn’t working and there’s an issue with your application. You had no idea. While everyone scrambles to react, you wonder if there’s a more proactive solution.
Monitoring alone is not enough to quickly diagnose and resolve issues. But the resources that you monitor generate a lot of log data that can be useful when you know what to look for. While manually sifting through alerts is time-consuming and resource-intensive, there’s a better way to reduce MTTR. It starts with log data + anomalies.
In this guide, we’ll dive into:
What log anomalies are (and what they’re not)
How log anomalies enable less downtime and better service availability
How LogicMonitor identifies log anomalies alongside metrics
Tips to help you proactively learn from log anomalies
Download the guide now
Thank you!
Your video will begin shortly
Report
2024 G2 Grid® Report for Log Monitoring
See how LogicMonitor, Dynatrace, Sumo Logic, Datadog and other top log monitoring vendors stack up in this third-party comparison from G2, based on real customer reviews.
This report dives into customer satisfaction ratings related to:
Ease of implementation (deployment, implementation time, and more).
Feature comparison (visibility, and monitoring and management).
Relationship ratings (ease of doing business, quality of support, and more).
Here’s what you’ll find in the report:
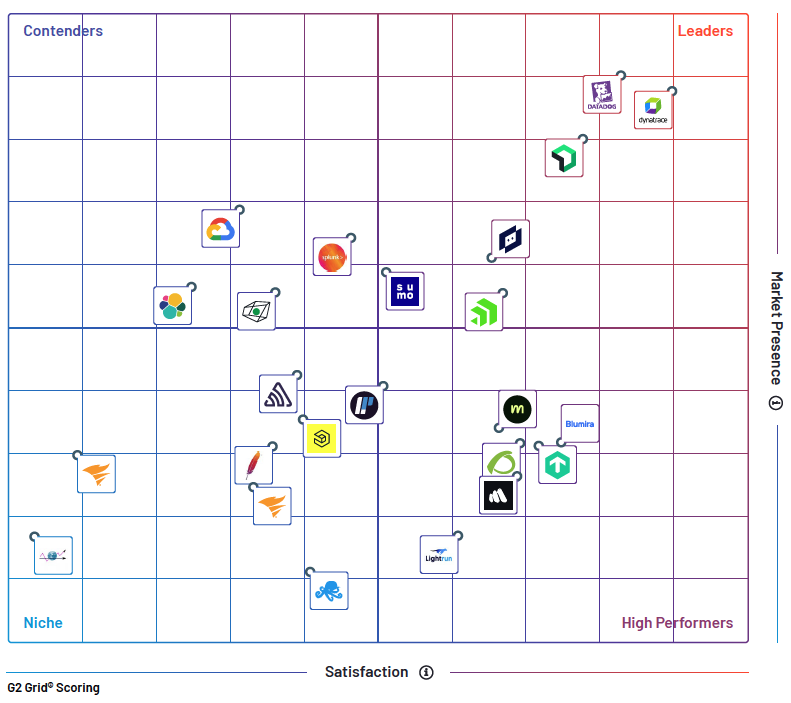
G2 Grid® for Log Monitoring: A comprehensive overview of the Log Monitoring Software landscape from validated, third-party data.
Head-to-Head Product Comparisons: How the top log monitoring softwares stack up in terms of customer segments, implementation, market presence, user adoption and ROI.
Real User Testimonials: Don’t take it from us. Find out why other IT Pros are turning to LogicMonitor.
Download report
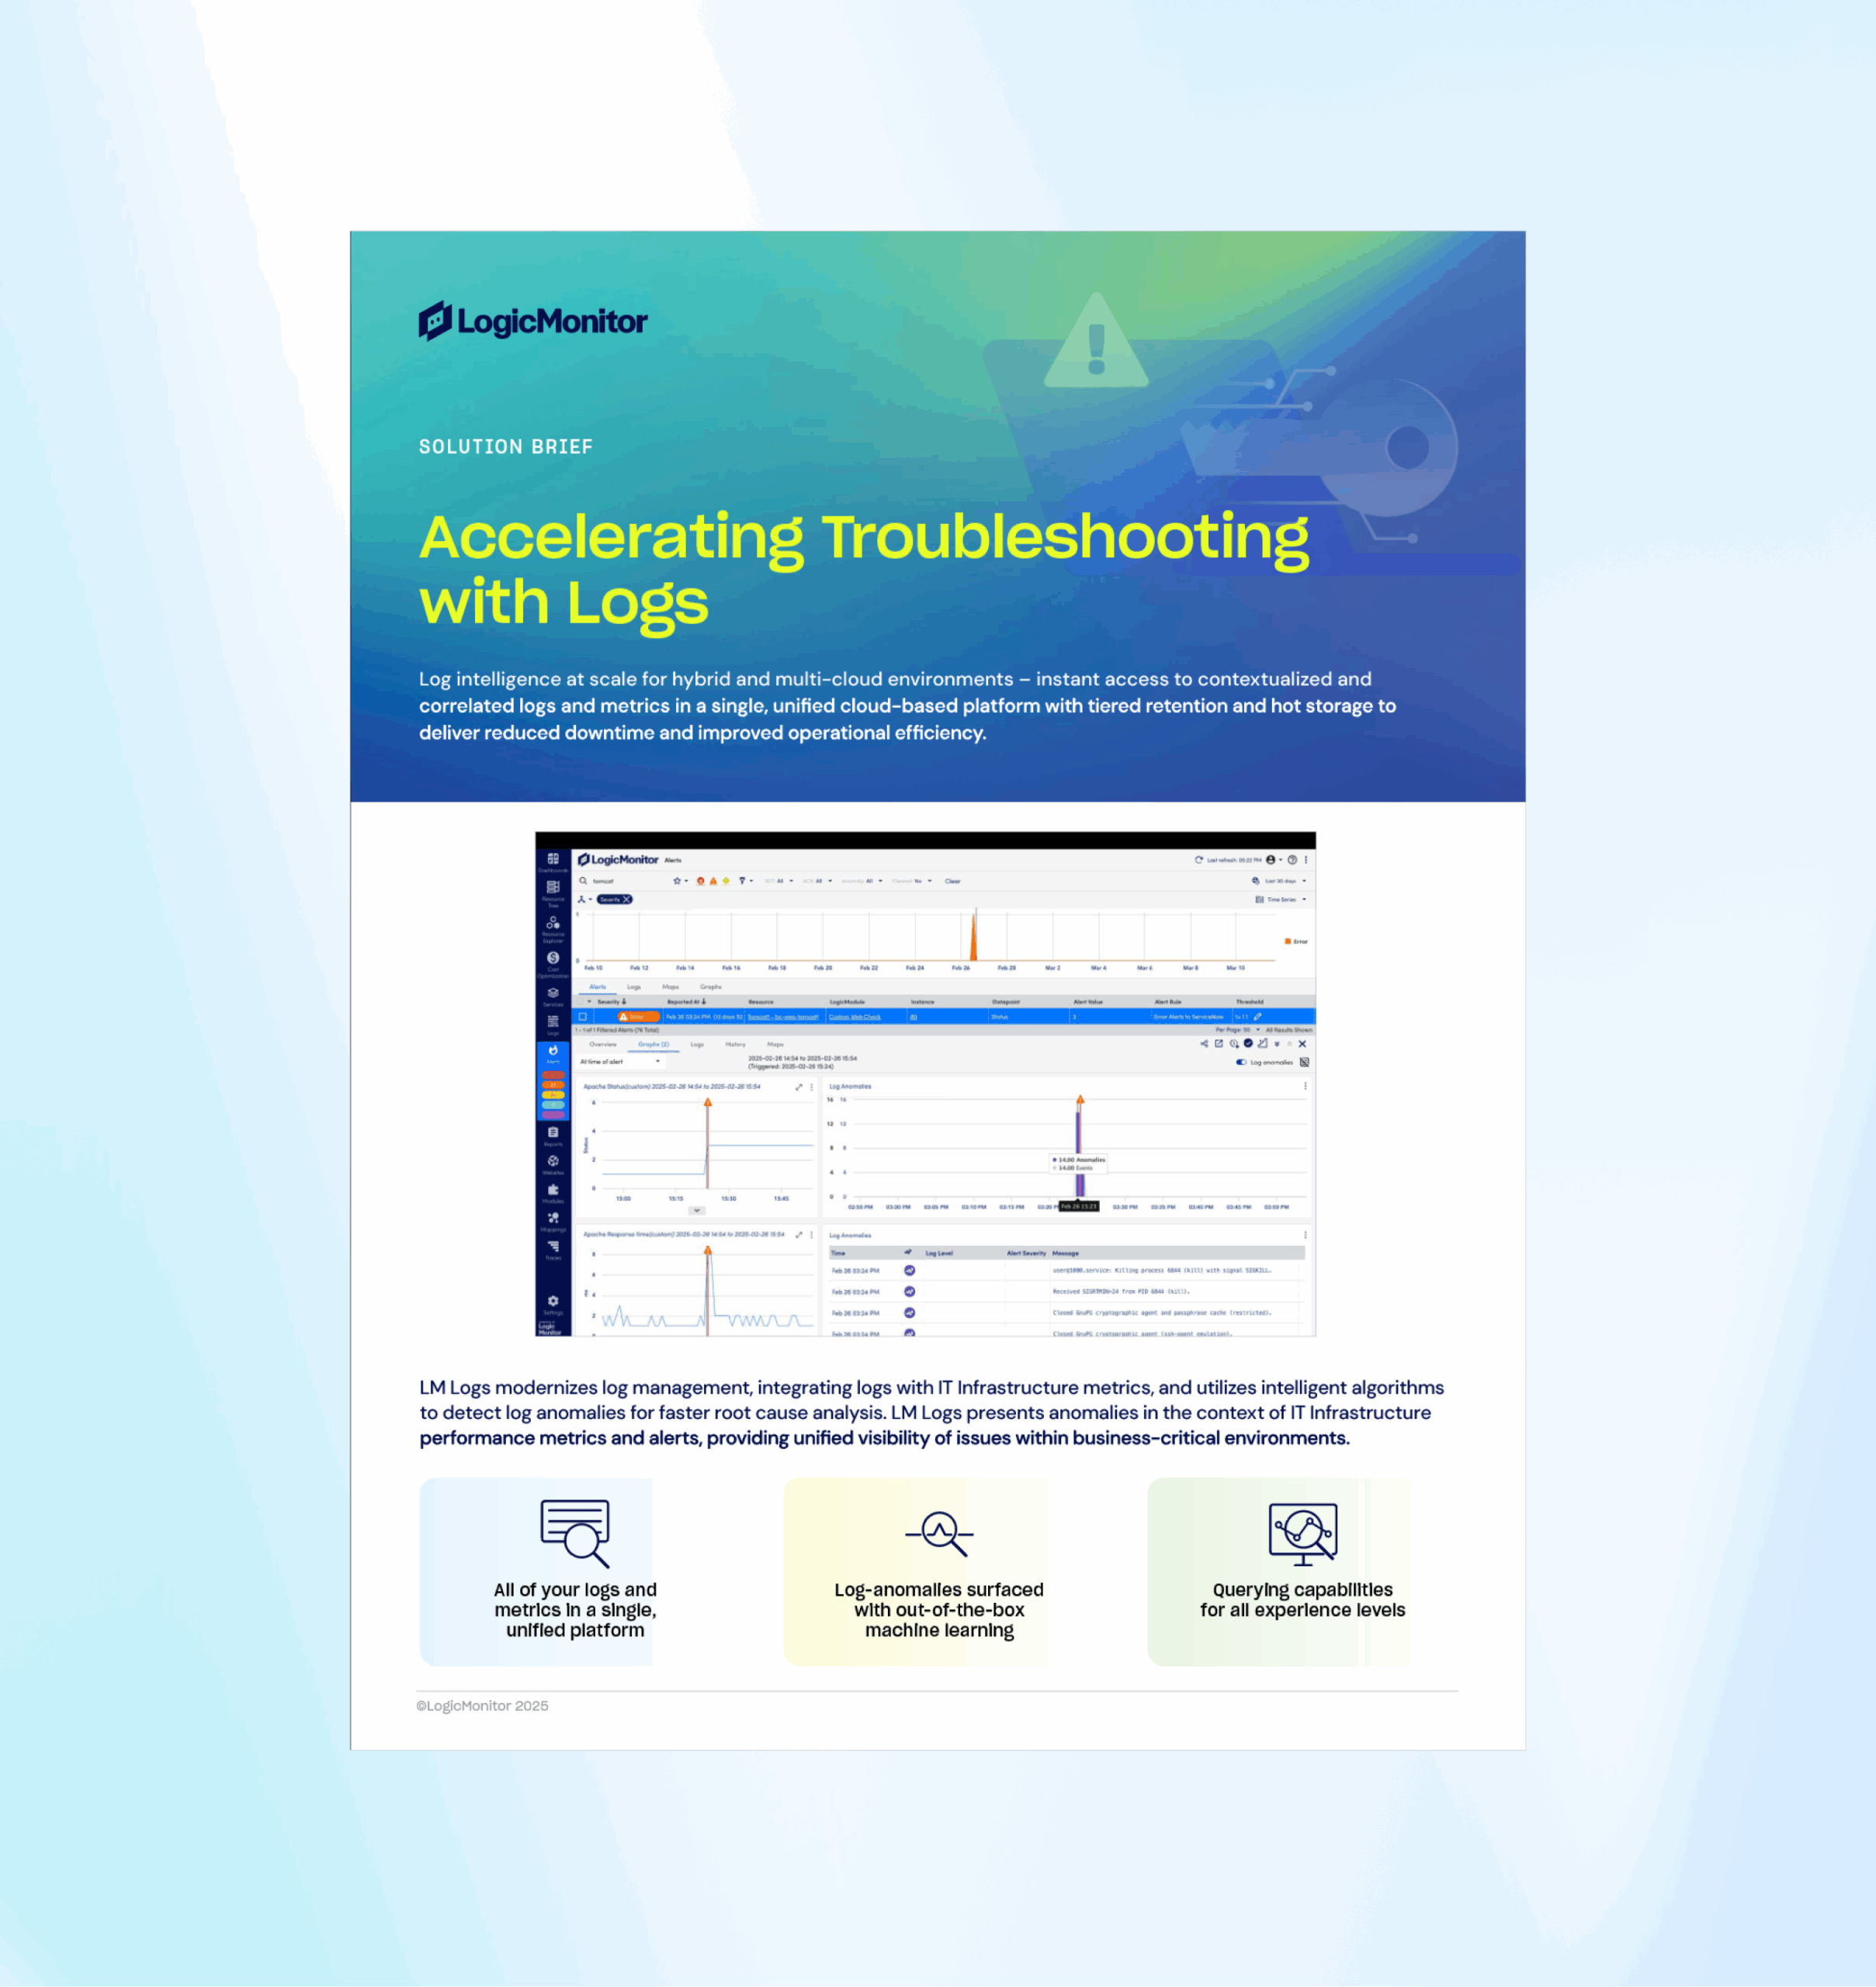
Solution brief
Accelerate Troubleshooting with Logs
LM Logs
IT teams are overwhelmed with alerts and data silos, making it harder than ever to diagnose and resolve issues before they impact business operations. By leveraging AI-driven anomaly detection and automated correlation of logs and performance metrics, teams can quickly surface root causes, reduce noise, and act before minor issues become major incidents.
With a unified approach to troubleshooting, IT teams can eliminate context switching, streamline workflows across hybrid environments, and significantly cut resolution times. The result? Enhanced reliability, reduced downtime, and greater operational efficiency.