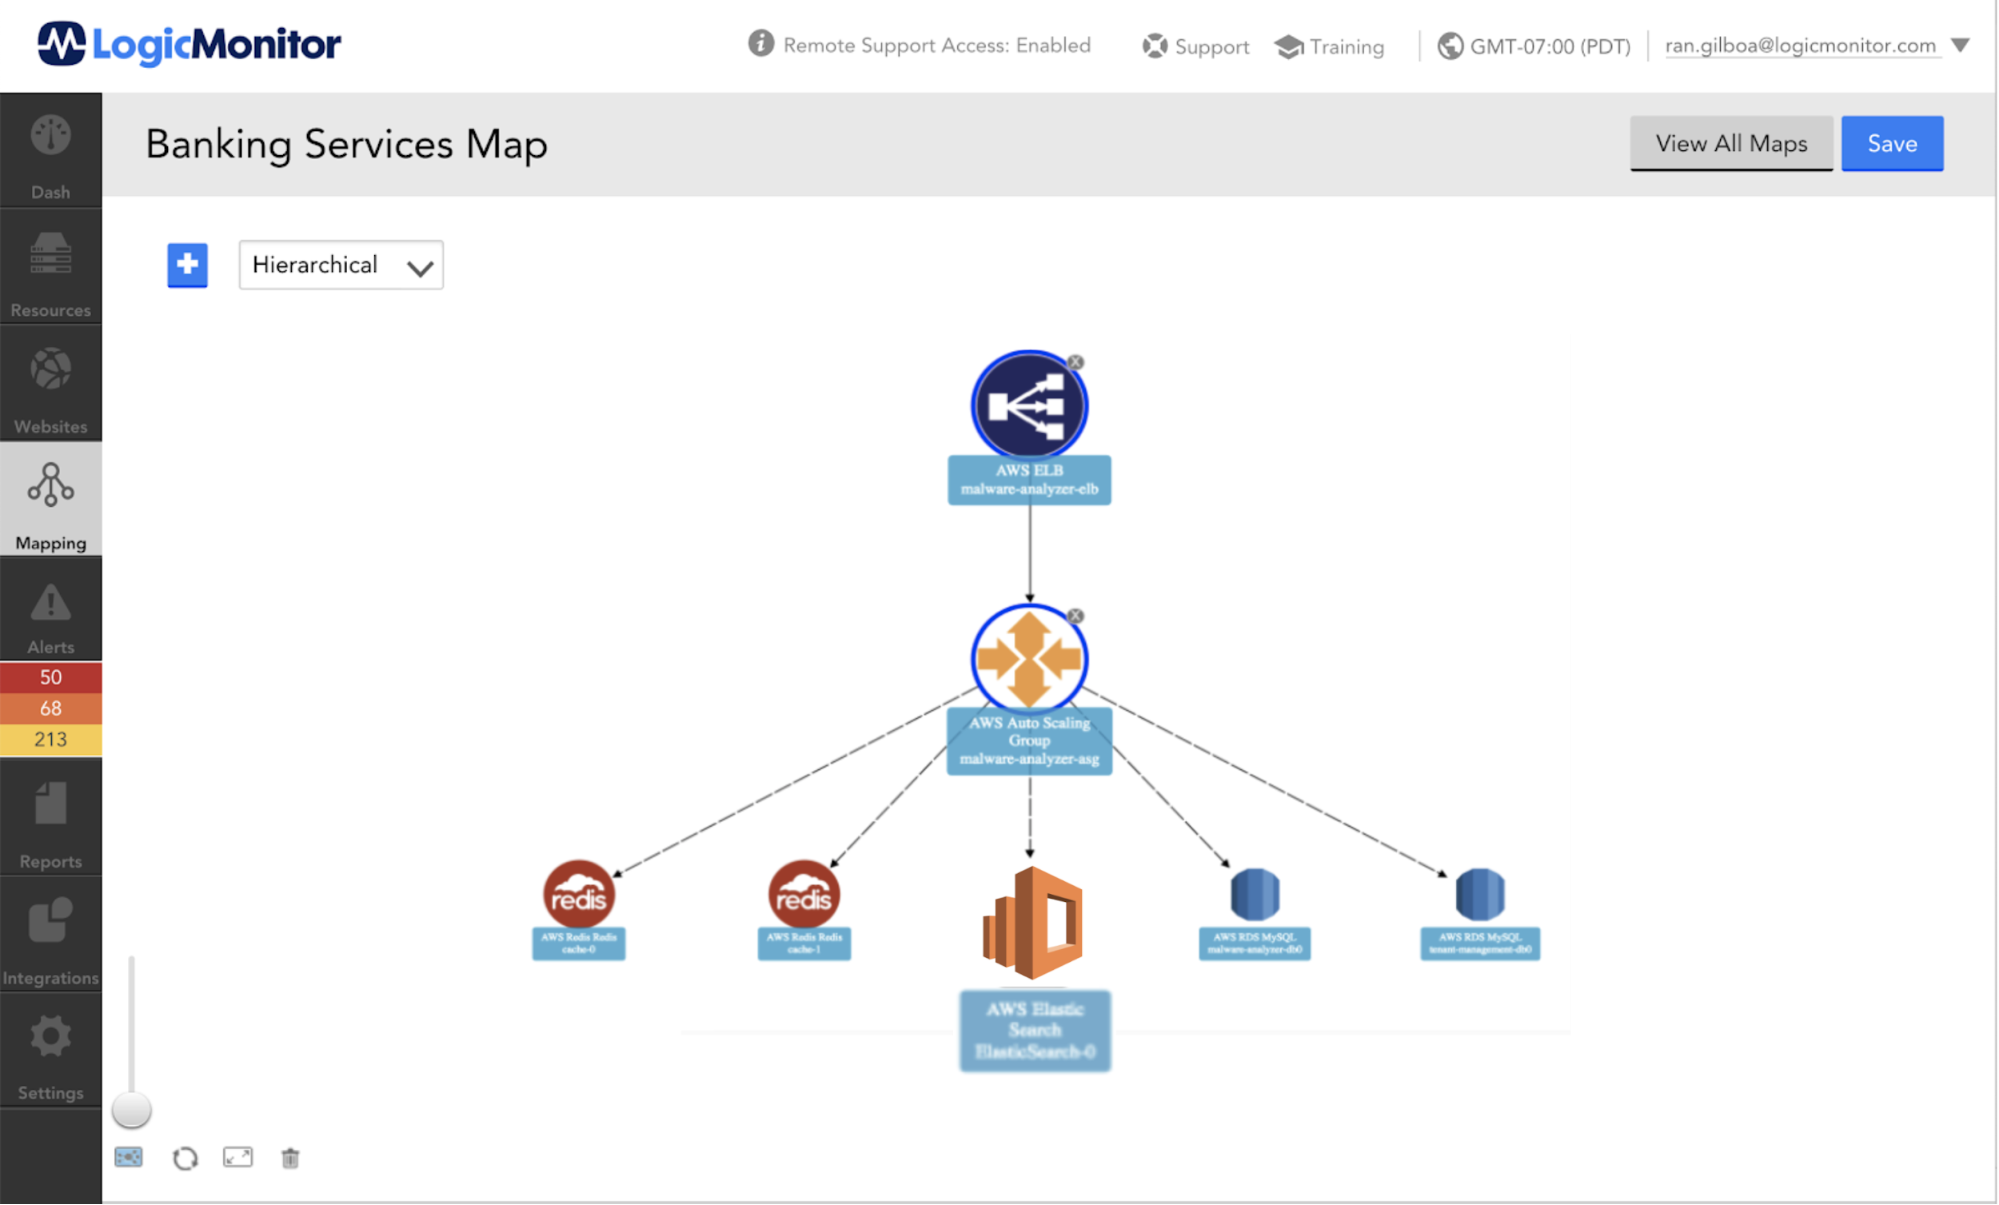
Amazon Web Services Elasticsearch Service enables an organization to deploy, secure, and run their Elasticsearch clusters. AWS Elasticsearch is a cost-effective way to operate at scale.
Elasticsearch offers a way to provide quick search experiences for your applications, websites, and data lake catalogs. It can also be used to monitor and collect logs from your infrastructure and applications. Elasticsearch is AWS’s service based on Elastic’s open-source Elasticsearch coined as an “open-source, distributed, RESTful search engine”. It is designed to provide fast, relevant, and scalable searching for your data.
AWS Cloudwatch Metrics
Elasticsearch publishes data points to Amazon CloudWatch for your Elasticsearch instances. CloudWatch enables you to retrieve statistics about those data points as an ordered set of time-series data, known as metrics. For Elasticsearch service, Amazon listed a few basic metrics and their Recommended CloudWatch Alarms.
Why Should I Add My Own Metrics?
LogicMonitor introduced Complex Datapoints to try to bring understanding around metrics value over time or as percentages. Tracking available capacity using raw values such as ClusterUsedSpace is a hard task. A complex datapoint that calculates the percentile is much more meaningful and easier to alert on.
CloudWatch enables you to retrieve https errors codes 4xx and 5xx as raw values. Consider the next question: Is the value 2 for the 5xx metric good or bad? And how good (or bad) is it? Usually, when I present this question, the person would say, “It depends how many requests”. In this case, too, a complex datapoint that calculates the percentile is much more meaningful and easier to alert on.
A complex datapoint that calculates the percentage of the cluster space that is used. By default, LogicMonitor recommends a warning at 85% used and an error at 95% used.
The average maximum percentage of CPU resources used for data nodes in the cluster. LogicMonitor recommends a warning at 85% utilization and an error at 95% utilization.
ClusterStatusRed
This indicates that the primary and replica shards of at least one index are not allocated to nodes in a cluster. LogicMonitor recommends an error if this value is not 0.
ClusterStatusYellow
This indicates that the primary and replica shards of at least one index are not allocated to nodes in a cluster. LogicMonitor recommends an error if this value is not 0. Please note that if you do not have replication for your Elasticsearch instances you will want to edit this metric to not alert you.
JVMMemoryPressure
This metric shows the maximum percentage of the Java heap used for all data nodes in the cluster. LogicMonitor recommends a warning if this value is above 80.
What Should I Enable Anomaly Detection Dynamic Threshold On?
While using Dynamic threshold and Static thresholds for key metrics is expected, there are other use-cases.
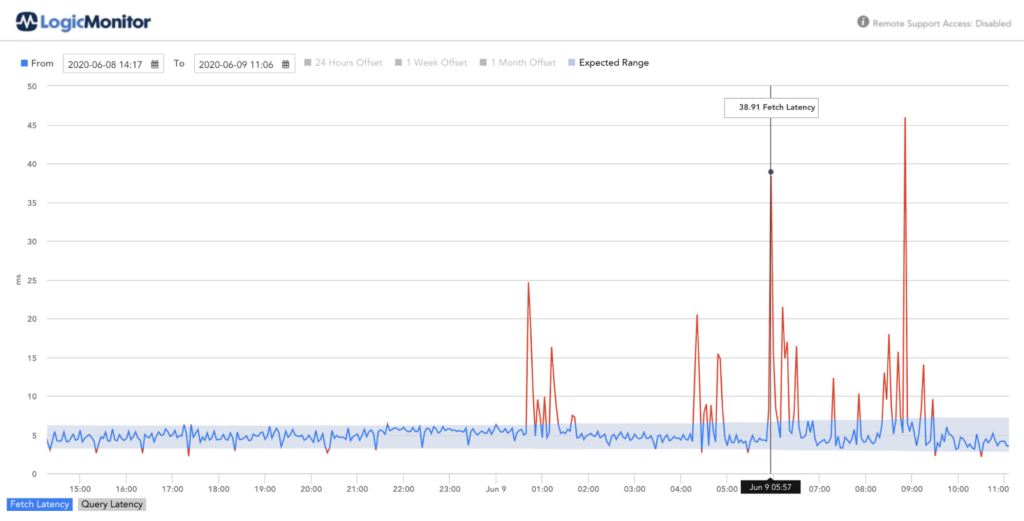
Example 1
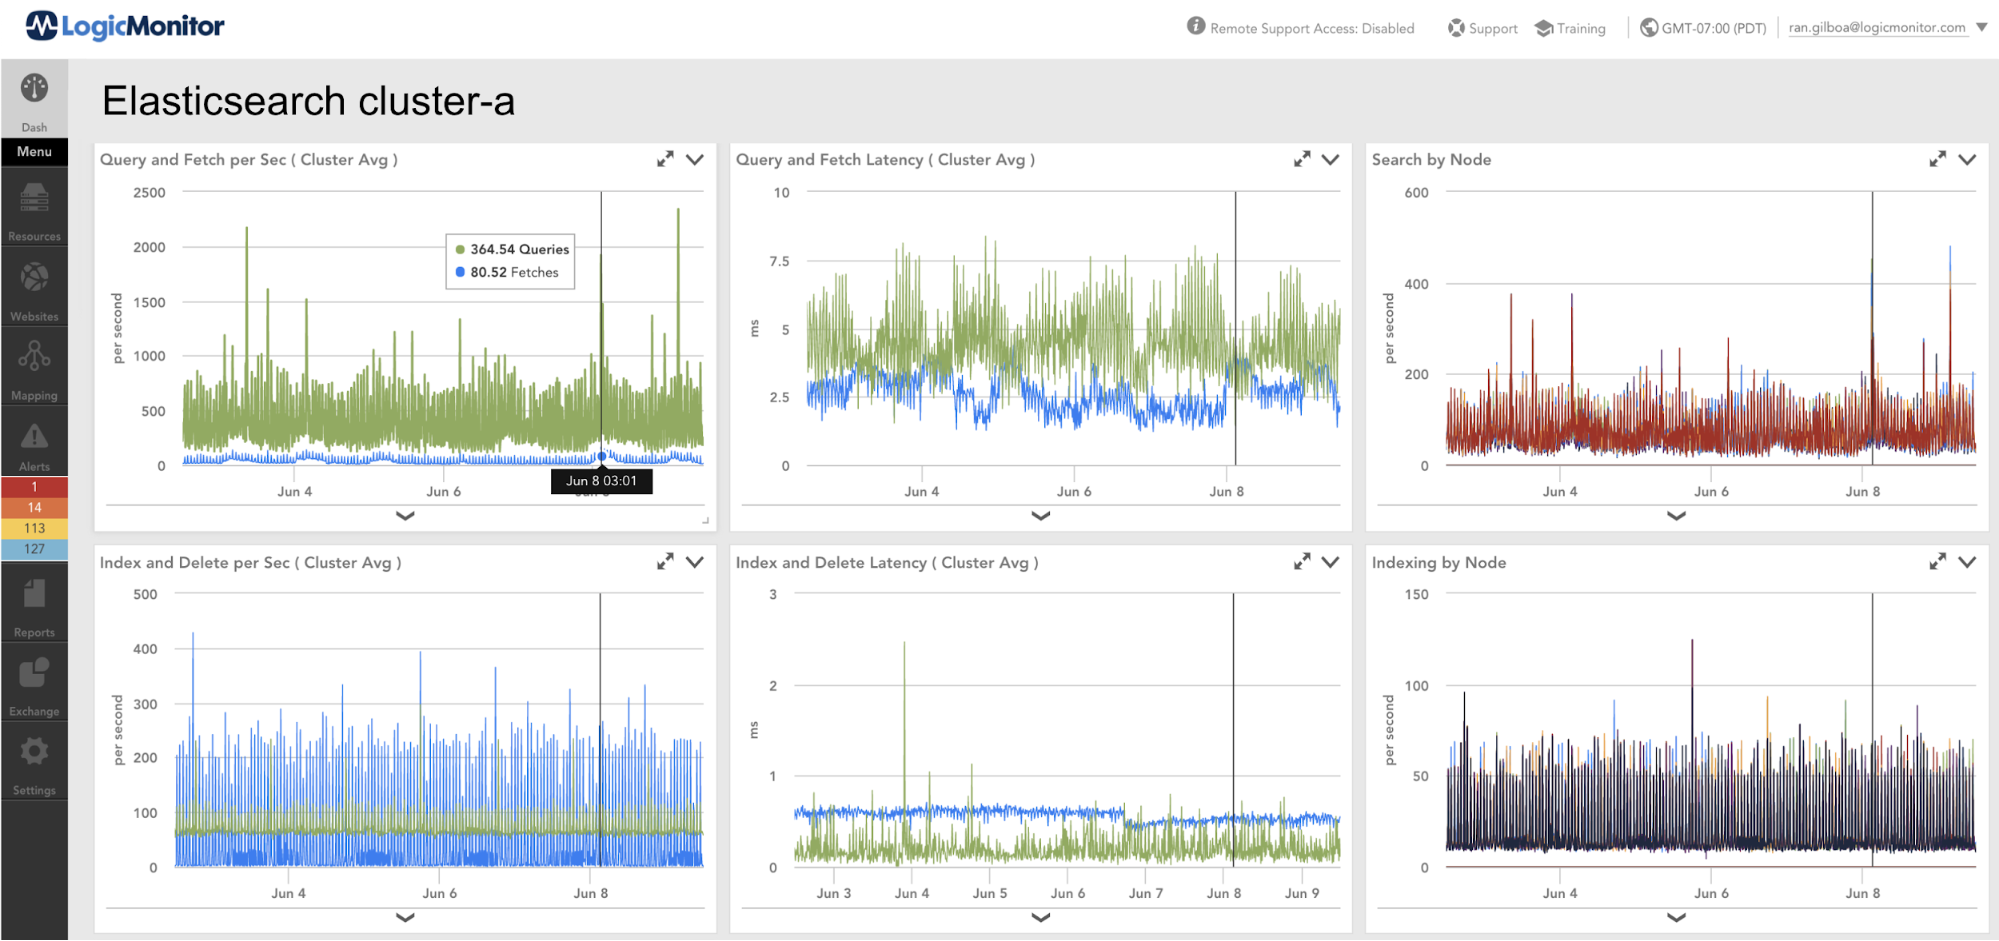
Enabling Anomaly Detection for Query and Fetch Latency is a way to denote the potential degradation of a service and a way to have advanced warning when there is a shift in expected operation.
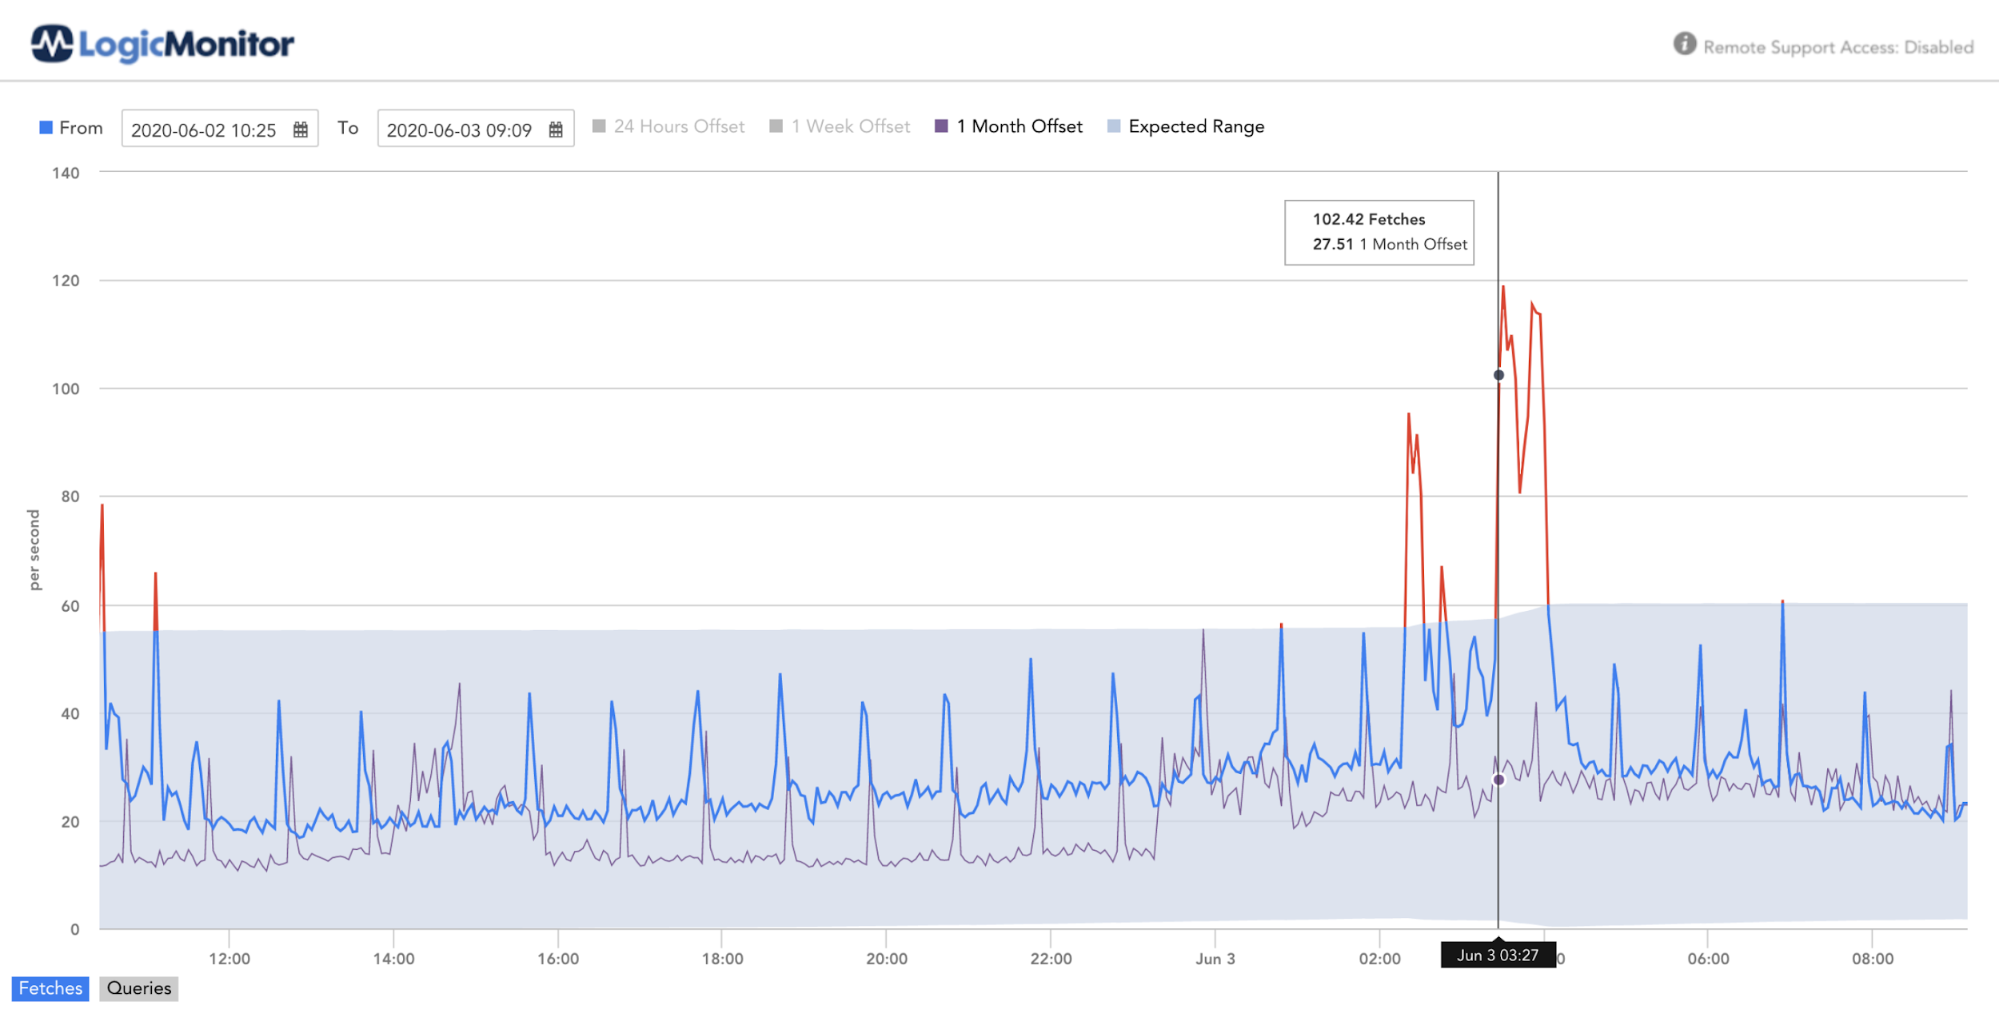
Example 2
Enabling Anomaly Detection for Query and Fetch count is a way to denote potential abnormal load on the system (or onboarding new customers).
Disclaimer: The views expressed on this blog are those of the author and do not necessarily reflect the views of LogicMonitor or its affiliates.