At LogicMonitor, we deal primarily with large quantities of time series data. Our backend infrastructure processes billions of metrics, events, and configurations daily.
In previous blogs, we discussed our transition from monolith to microservice. We also explained why we chose Quarkus as our microservices framework for our Java-based microservices.
In this blog we will cover:
- The LogicMonitor Microservice Technology Stack
- How We Used A Kafka Partition Layout in a Multi-Tenant Environment
- How We Used Quarkus With Kafka
- How We Scale in and Out of Microservice Containers
- The Top 5 KPIs
LogicMonitor Microservice Technology Stack
LogicMonitor’s Metric Pipeline, where we built out multiple microservices with Quarkus in our environment, is deployed on the following technology stack:
- Java 11 (corretto, cuz licenses)
- Kafka (managed in AWS MSK)
- Kubernetes
- Nginx (ingress controller within Kubernetes)
How We Used A Kafka Partition Layout in a Multi-Tenant Environment
Our microservices use Kafka topics to communicate. Each microservice gets data messages from some Kafka topics and publishes the processing results to other topics.
Each Kafka topic is divided into partitions. The data messages of multiple tenants that are sharing the same Kafka cluster are sent to the same topics.
When a microservice publishes a data message to a partition of a Kafka topic, the partition can be decided randomly or based on a partitioning algorithm based on the message’s key. We chose to use some internal ID as the message key so that the time-series data messages from the same device can arrive at the same partition in order and be processed in that order.
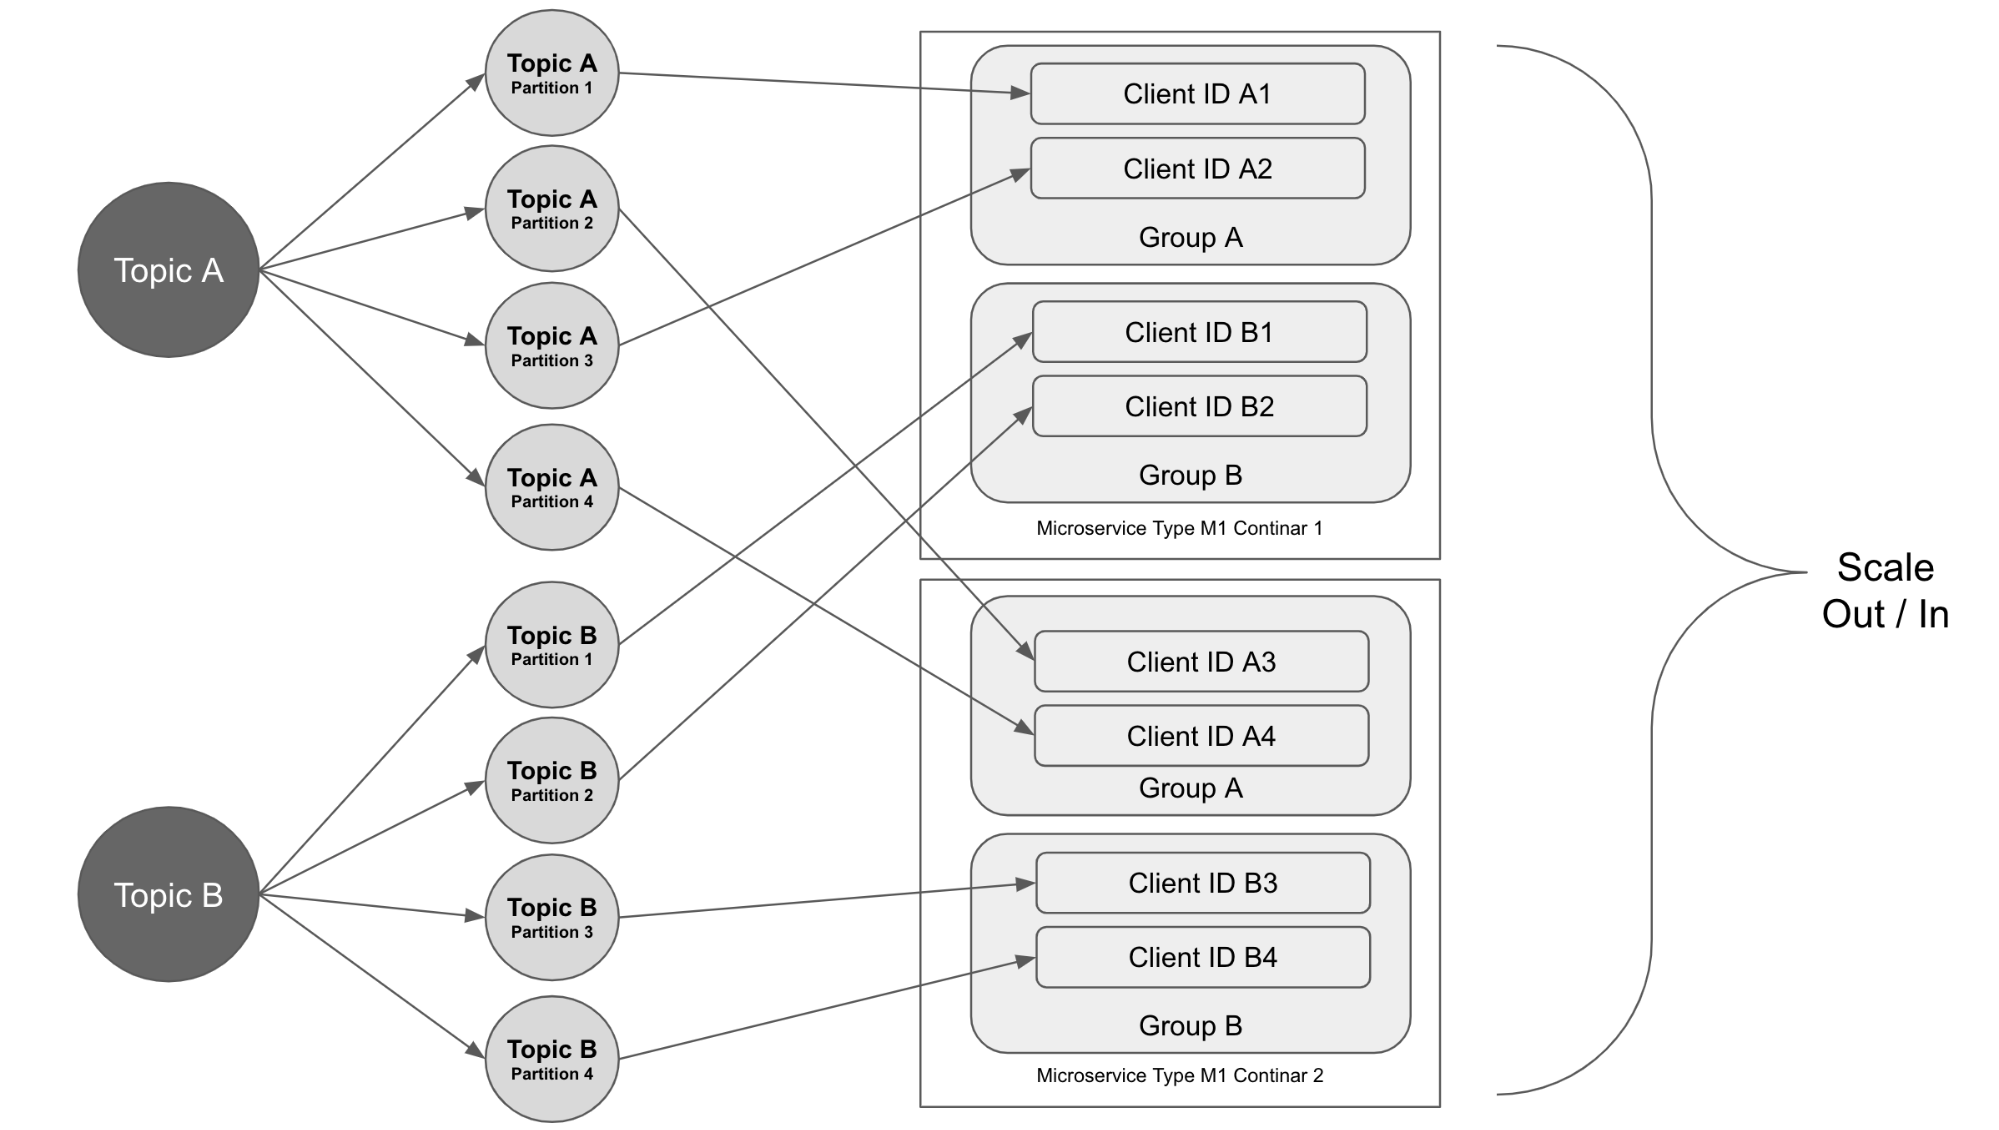
The data on a topic across the multiple partitions sometimes can be out of balance. In our case, some data messages require more processing time than others and some partitions have more messages than the other partitions. This leads to some microservice instances falling behind. To solve this problem, we separated the data messages to different topics based on their complexity and configured the consumer groups differently. This allows us to scale in and out services more efficiently.
The microservice that consumes the data from the topic has multiple instances running and they are joining the same consumer group. The partitions are assigned to the consumers in the group and when the service scales out, more instances are created and join the consumer group. The partition assignments will be rebalanced among the consumers and each instance gets one or more partitions to work on.
In this case, the total number of partitions decides the maximum number of instances that the microservice can scale up to. When configuring the partitions of a topic, we should consider how many instances of the microservice that will be needed to process the volume of the data.
How We Used Quarkus With Kafka
We started with Quarkus’s Kafka extension based on MicroProfile Reactive Messaging: smallrye-reactive-messaging-kafka. It’s easy to use and has great support for health checks.
We set up the Kafka producer with imperative usage. There are a couple of configurations that need to be adjusted to make sure the throughput of the producer is good, which we mentioned in our Quarkus vs Spring blog.
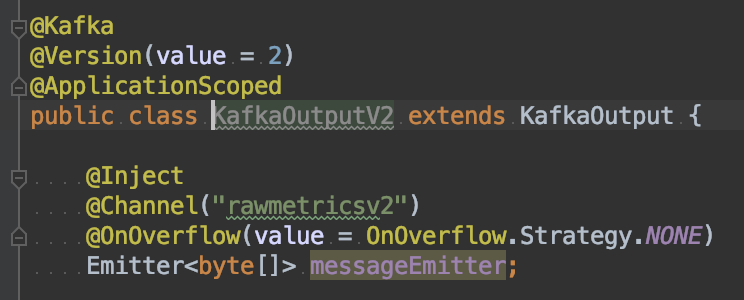
- Overflow Strategy: By default, the producer’s overflow strategy is that of a small memory buffer. The Kafka Emitter will wait for a signal from the Kafka consumer (reactive messaging) to know that a given message will be processed correctly. This is bad news though, if your Kafka consumer is in a different application and unable to send any signal to the Emitter. So, we set this strategy to NONE. The risk here is that we don’t have anything within the application to know if the Kafka consumer is keeping up or not. We solved this by using the Kafka client JMX metrics directly in our monitoring solution.
- WaitForWriteCompletion: By default, the producer was waiting for an ack from Kafka that the message was accepted correctly and fully even if acks was set to 0. By default, this config value is true, so we had to set it to false in order to keep up with the volume of data we were processing.
However, we did have some challenges while setting up the Kafka consumers. These are also mentioned in the Quarkus vs. Spring blog.
- Auto Commit: by default, the Quarkus consumer was committing to Kafka after every message was received, causing a big pile-up in consumer lag.
- Single-Threaded Consumer: this caused us to actually avoid using the Quarkus Kafka consumer for metrics processing. After a lot of troubleshooting hours and headaches, our team found that not only was it single-threaded, it was processing messages serially. It just couldn’t keep up with our volume, so we ended up building a Kafka consumer based on the Apache Kafka Java SDK directly so that we could have multiple consumer threads per application container. We did, however, keep the Quarkus Kafka consumer for another use case that had a much lower volume of messages, simply because of the ease of use to configure it:
- Other “gotchas” with the Quarkus Kafka Consumer include:
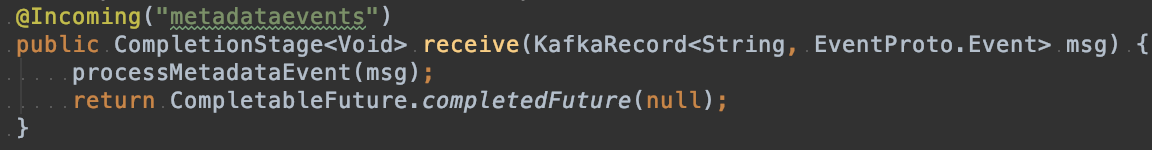
- You have to be very careful to return a completedFuture, otherwise, we found that the reactive framework took way too long to process each message, sometimes hanging indefinitely.
- Exceptions thrown in the @Incoming method aren’t handled gracefully either (the consumer will stop), so be sure to be careful here too.
- The Reactive Messaging Framework’s channel implementation doesn’t allow consumption of topics based on a pattern (i.e. only a single topic can be consumed from per channel)
In the end, we chose to implement Kafka consumers with Apache Kafka Client. There have been multiple improvements added in Kafka support of MicroProfile Reactive Messaging, for example, allowing multiple consumer clients and supporting subscribing to topics by patterns. In the future, we may reevaluate the Kafka extension in Quarkus for the consumer implementation.
How We Scale in and Out of Microservice Containers
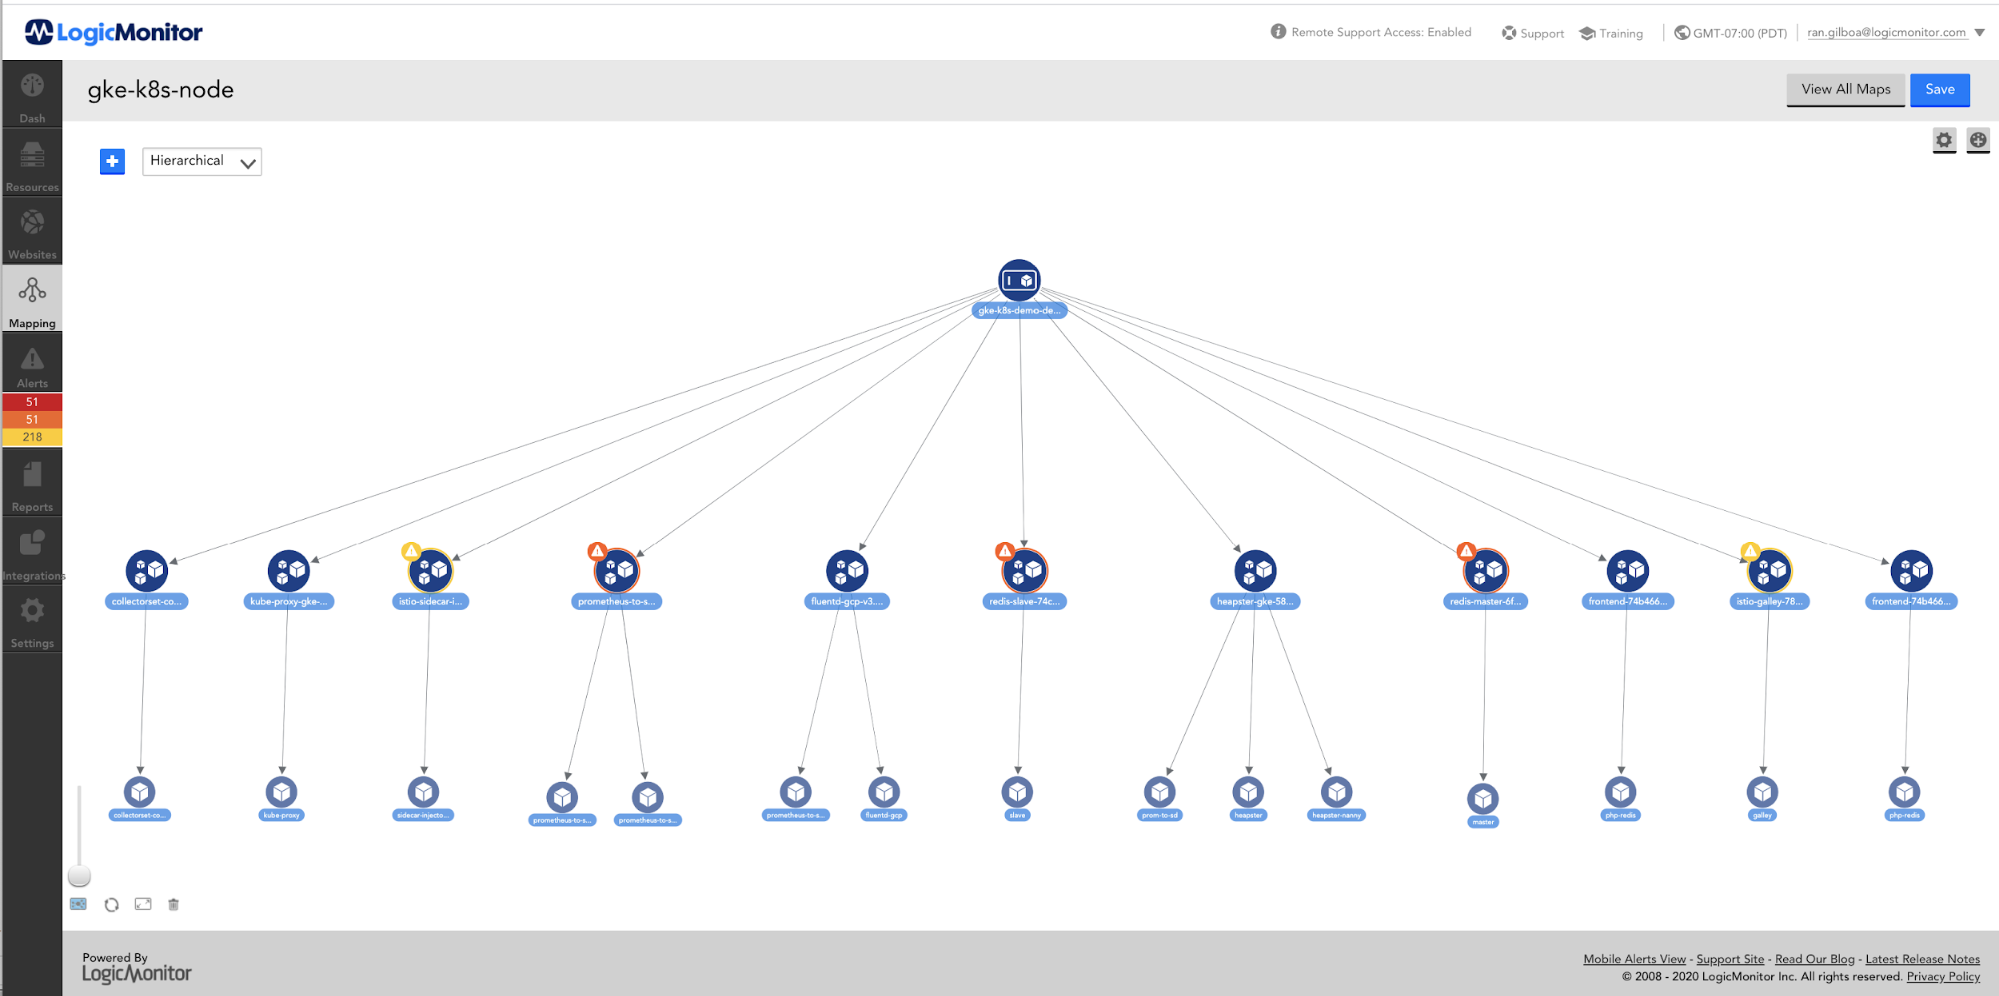
All of our microservices are deployed in Docker containers on Kubernetes clusters. In a Kubernetes cluster, multiple namespaces are used to divide the resources between the multiple tenants. Most of our microservices are deployed at the namespace level.
At the cluster level, the Kubernetes cluster can scale up and down by the Cluster Autoscaler. For each microservice in a namespace, we use the Horizontal Pod Autoscaler to automatically scale the number of container replicas based on the application CPU utilization. The number of replications of a microservice in a namespace is dependent on the load from the tenants belonging to that namespace. When the load goes up and CPU utilization of a microservice increases, more replicas of the service will be created automatically. Once the load goes down and the CPU utilization decreases, the number of replicas will scale down accordingly. Our next goal is to use the horizontal pod autoscaler with the custom metrics from the application.
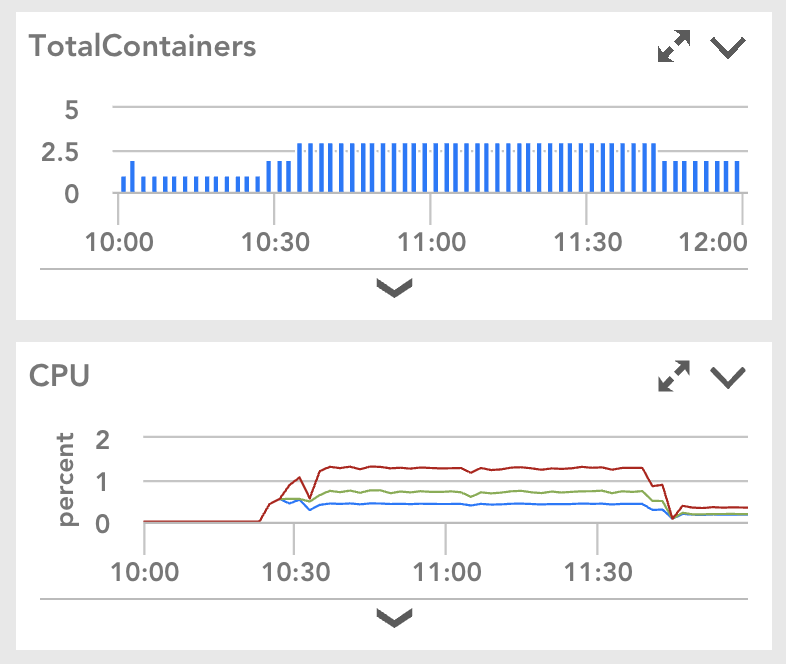
All of our microservices are monitored with LogicMonitor. Here is an example from the monitor dashboard. It shows the number of container replicas was automatically scaled up and down because of CPU utilization changes.
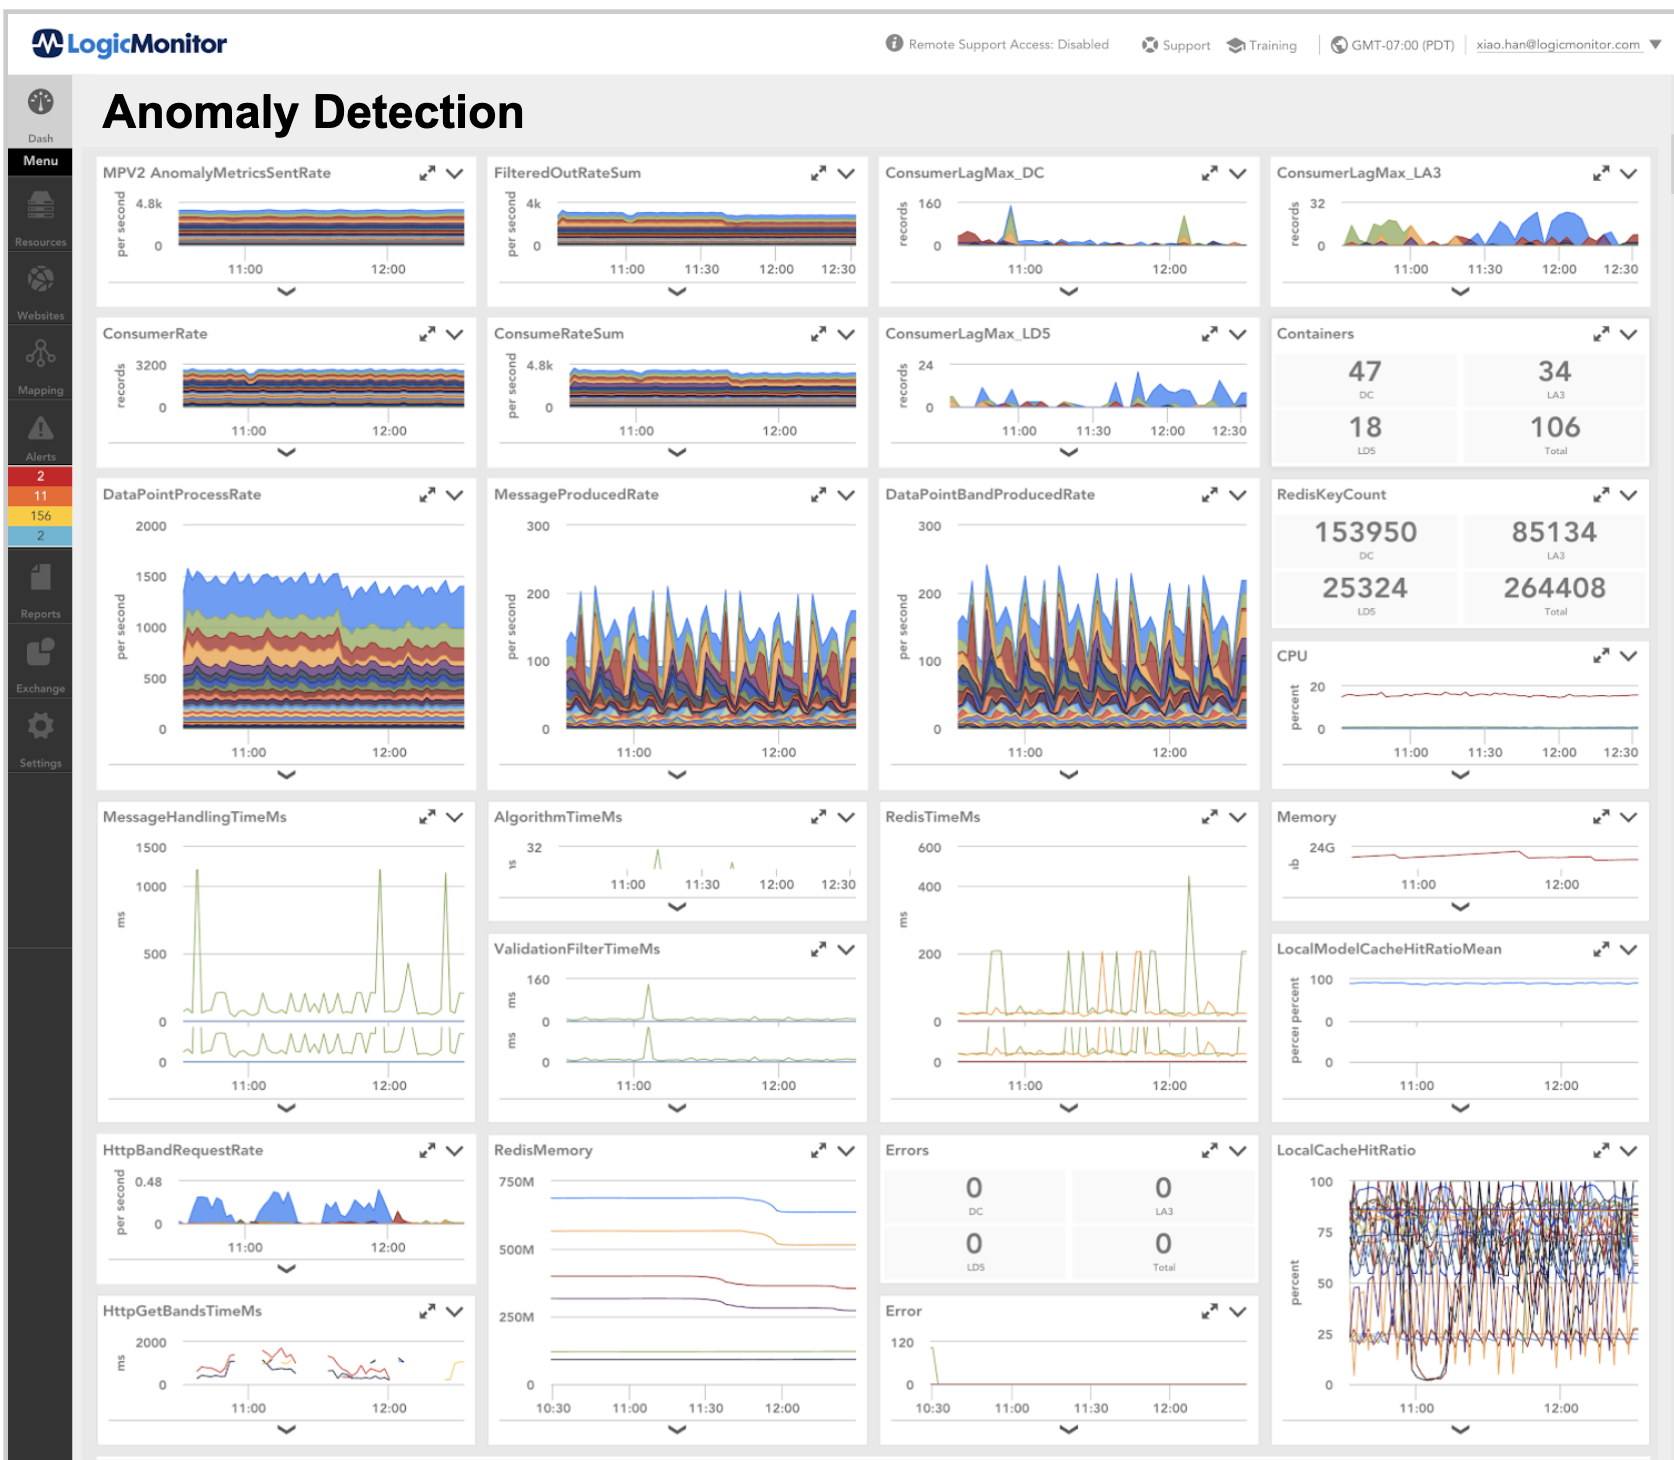
The Top 5 KPIs
We use LogicMonitor for the microservice KPI monitoring. The KPI metrics include but are not limited to:
- Kafka consumer lag – The lag there is between Kafka producers and consumers
- Request rate or consume rate – The number of network requests per second
- Latency – Time it takes for a record produced to Kafka to be fetched by the consumer
- Error rate – The average per-second number of record sends that resulted in errors for a topic
- Resource usage (CPU, Memory)
Here is an example of our Anomaly Detection microservice dashboard: