In modern application development and architecture, there has been a big push from monolithic, large applications that can do everything a product needs to many smaller services with a specific purpose. This onset has brought on the age of microservice frameworks (micro-frameworks) to make it easier to prototype, build, and design applications in this paradigm.
When looking at Quarkus vs. Spring Boot, each offers unique strengths to help you accomplish your goals as a microservice application developer, but which should you pick?
TL;DR
What is Quarkus?
Quarkus is a Kubernetes-Native Java framework tailored for GraalVM and HotSpot, crafted from best-of-breed Java libraries and standards. The goal of Quarkus is to make Java a leading platform in Kubernetes and serverless environments. It also offers developers a unified reactive and imperative programming model to optimally address a wider range of distributed application architectures.
Some notable features of Quarkus include:
- Live coding: Quarkus offers a development mode that enables live coding, allowing developers to make changes to their code and see the results instantly without having to restart the application. This feature significantly speeds up the development process.
- Unified configuration: Quarkus provides a centralized configuration system, making it easy to manage and organize configuration properties across the application.
- Reactive programming: Quarkus supports reactive programming with Vert.x, a toolkit for building high-performance, event-driven applications. This feature allows developers to create responsive and resilient systems capable of handling large amounts of concurrent connections.
- Extensibility: Quarkus has a vast ecosystem of extensions, making it simple to integrate with various technologies, libraries, and frameworks, such as RESTEasy, Hibernate, and Apache Camel.
- Native image generation: Quarkus supports generating native executables with GraalVM, resulting in faster startup times and lower memory usage compared to traditional Java applications.
Quarkus is designed for fast, efficient cloud-native deployments, while Spring Boot brings deep functionality and stability for enterprise-scale applications.
What is Spring Boot?
Spring Boot is an open-source Java-based framework used to create a micro-service. It was developed by the Pivotal Team and is used to build stand-alone and production-ready spring applications. It’s a commonly chosen application framework for a MicroServices architecture.
Here are some notable features of Spring Boot:
- Autoconfiguration: Spring Boot automatically configures your application based on the dependencies you include, reducing the amount of manual configuration required. This feature streamlines the development process and helps developers focus on writing code rather than dealing with configuration files.
- Embedded servers: Spring Boot applications can be packaged with embedded web servers like Tomcat, Jetty, or Undertow, eliminating the need to deploy your application to an external server. This feature simplifies the deployment process and makes it easier to create self-contained applications.
- Starter dependencies: Spring Boot offers a set of pre-configured “starter” dependencies that allow developers to quickly add and configure common functionality, such as web services, data access, and security. These starter dependencies help reduce boilerplate code and ensure consistent configurations across projects.
- Actuator: The Spring Boot Actuator module provides built-in production-ready features like health checks, metrics, and application information, making it easier to monitor and manage your application in production environments.
- YAML configuration: In addition to traditional Java properties files, Spring Boot supports YAML-based configuration files. This feature offers a more human-readable and concise syntax for configuring your application.
LogicMonitor Microservice Technology Stack
LogicMonitor’s Metric Pipeline (where we built out a proof-of-concept of Quarkus in our environment) is deployed on the following technology stack:
- Java 11 (corretto, cuz licenses)
- Kafka (Managed in AWS MSK)
- Kubernetes
- Nginx (ingress controller within Kubernetes)
Why Move From Spring Boot to Quarkus?
Our legacy pipeline was based on Spring and Tomcat. There were a couple of things about this framework choice that we didn’t like when we inherited its maintenance and deployment, including:
- Memory and CPU consumption: For the operations being performed, an inordinate amount of resources were being utilized outside of the application’s main purpose by the framework of Spring and Tomcat.
- Warmup time: The spring application could take anywhere from 10-20 seconds to start up, at which point the application could then start to warm up.
- Less code: As developers, we all hate boilerplate code. ‘Nuf said.
- Testing: Quarkus makes it really easy to write both unit and integration tests. Just slap a @QuarkusTest annotation on there and it will actually spin up the whole application in order to run your test.
- Scale-out (horizontal) vs. Scale-up (vertical): The smaller each application could be (resource-wise), the more we could add. Horizontal Scalability for the win.
- Learning curve: Quarkus’ docs online were very straightforward and easy to absorb.
How Did We Choose Quarkus Over Other Java Microframeworks?
In addition to Quarkus, we explored two other Java Micro-Frameworks: Helidon.io and MicroNaut.
Micronaut
Micronaut was probably the most comparable with Quarkus. The declarative nature of the framework was very similar and it had out of the box support for technologies we use heavily here:
- Kafka
- Docker / Kubernetes
- APIs
- Relational / Non-Relational databases
- Gradle
The main reason we didn’t end up with Micronaut was that it was not based on the eclipse microprofile framework, but something homegrown. We felt that since Quarkus was backed by Redhat and was based on microprofile, it had a better situation regarding community support and documentation
Helidon.io
Helidon was also one of the top contenders. It’s API framework was based on JAX-RS, and in general, we felt that it still required way too much boilerplate to get things up and running. It had a lot of similar technologies supported but it wasn’t as well integrated.
What We Learned
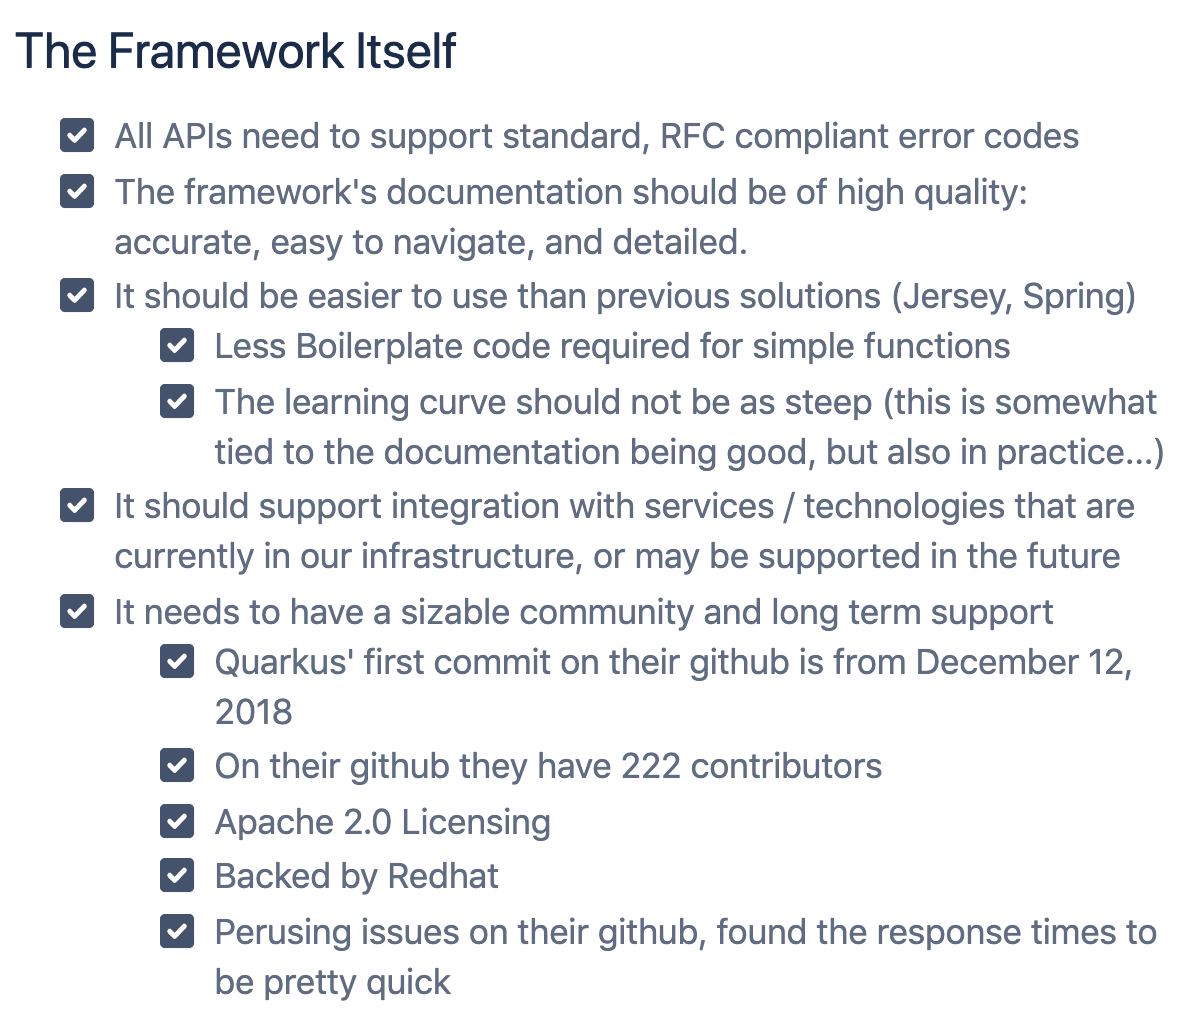
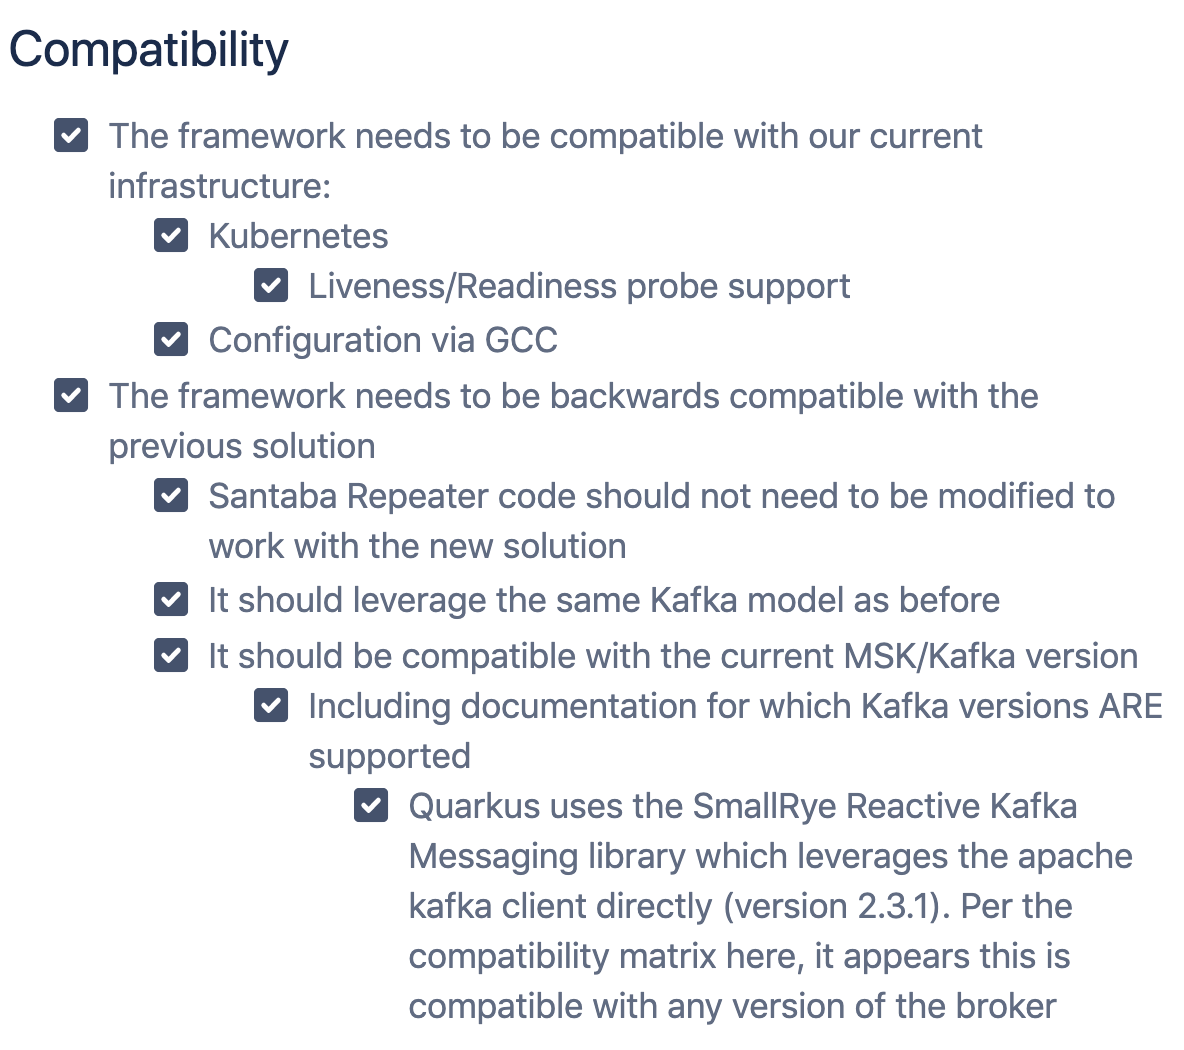
When we set out to build a POC of one of the applications in the pipeline, we set up an internal document laying out the success criteria:
APIs were very easy to design and implement. We went with Quarkus’ rest-easy implementation and found it to be both RFC compliant and similar to the JERSEY framework we were already familiar with in other applications in our infrastructure. We weren’t able to use their built-in authentication implementation, however, due to some backward compatibility issues with how the existing application authenticated requests (based on a homegrown request header token).
Kubernetes Support
One of the things we really liked about the Quarkus framework was how easy it was to set up the Kubernetes Liveness/Readiness probes. All we had to do was add a dependency (smallrye-health), enable a configuration, and we had a kafka liveness/readiness probe ready to go. Adding our own health check to make sure our application was configured correctly was as easy as annotating a class, and implementing a simple interface. Then, probes were available at the “/health” (gets both liveness and readiness check results), “health/live”, and “health/ready” endpoints.
CDI Bean Injection
In addition to the probes, we also really liked the CDI bean injection. We found this to be more easily conceptualized than Spring’s DI implementation, and it enabled us to build a lot quicker than normal. One thing to note though, is that in order to expose metrics, those metrics must be exposed from a class with a bean-defining annotation. This is part of how microprofile works, more on metrics later.
Configuration
In terms of configuration, Quarkus has support for profiles and configuration from multiple sources. At LogicMonitor, we use a central configuration service, so we ended up setting System Properties based on an eagerly-instantiated bean which polled that service for its configuration settings. We didn’t have a huge use case for the @ConfigProperty annotation because we want most of our configurations to be easily changed at runtime, and those are usually defined on a bean’s instance variables. Most of the beans in our POC app were @ApplicationScoped, so that would have required the config values to be static.
Quarkus Kafka Limitations
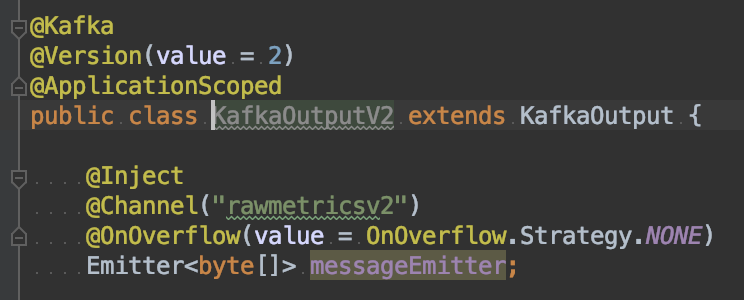
Quarkus has support for Kafka through the SmallRye Reactive Messaging framework. We had a good experience with this framework for our Kafka Producer, but not our Kafka Consumer application. The Kafka Producer is fairly easy to set up for imperative usage in this guide. There are a couple of things to be careful of with here regarding default configuration values of the producer that caused a bunch of issues for us (and a few hours of troubleshooting headache):
- Overflow Strategy: By default, the producer’s overflow strategy is that of a small memory buffer. The Kafka Emitter will wait for a signal from the Kafka consumer (reactive messaging) to know that a given message will be processed correctly. This is bad news though, if your Kafka consumer is in a different application, unable to send any signal to the Emitter. So, we set this strategy to NONE. The risk here is that we don’t have anything within the application to know if the Kafka consumer is keeping up or not. But we solved this by using the Kafka client JMX metrics directly in our monitoring solution.
- WaitForWriteCompletion (see configuration section here): By default, the producer was waiting for an ack from Kafka that the message was accepted correctly and fully even if acks was set to 0. By default, this config value is true, so we had to set it to false in order to keep up with the volume of data we were processing.
When it came to the Kafka Consumer we also ran into a fair bit of trouble in two main areas:
- Auto Commit: by default, the Quarkus consumer was committing to Kafka after every message was received, causing a big pile-up in consumer lag.
- Single-Threaded Consumer: this caused us to actually avoid using the Quarkus Kafka consumer for metrics processing. After lots of troubleshooting hours and headaches, our team found that not only was it single-threaded, it was processing messages serially. It just couldn’t keep up with our volume, so we ended up building a Kafka consumer based on the Apache Kafka Java SDK directly so that we could have multiple consumer threads per application container. We did, however, keep the Quarkus Kafka consumer for another use case we had that had a much lower volume of messages, simply because of the ease of use to configure it:
- Other “gotchas” with the Quarkus Kafka Consumer include:
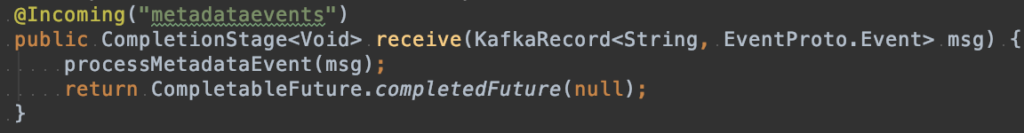
- You have to be very careful to return a completedFuture, otherwise, we found that the reactive framework took way too long to process each message, sometimes hanging indefinitely.
- Exceptions thrown in the @Incoming method aren’t handled gracefully either (the consumer will stop), so be sure to be careful here too.
- The Reactive Messaging Framework’s channel implementation doesn’t allow consumption of topics based on a pattern (i.e. only a single topic can be consumed from per channel)
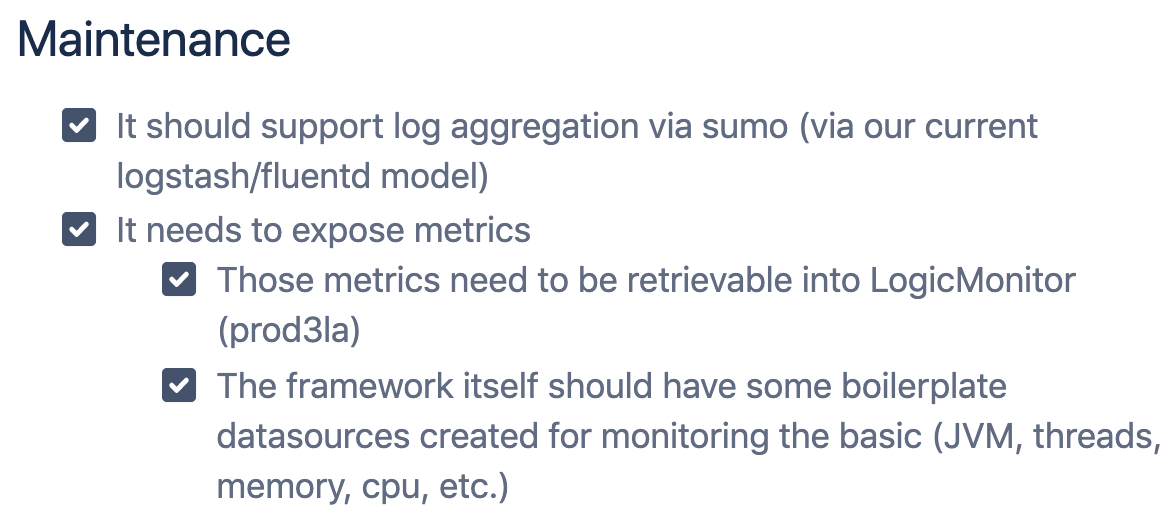
Quarkus played very nicely with our existing Java monitoring via JMX (all the garbage collection, heap, threads, uptime DataSources applied, and gathered data automatically). It also allowed us to define our own application metrics easily. In my opinion, this was one of the biggest benefits of the app: using microprofile metrics. We were able to both time and count operations through a simple annotation, that instantly makes those metrics available from a “/metrics/application” endpoint:
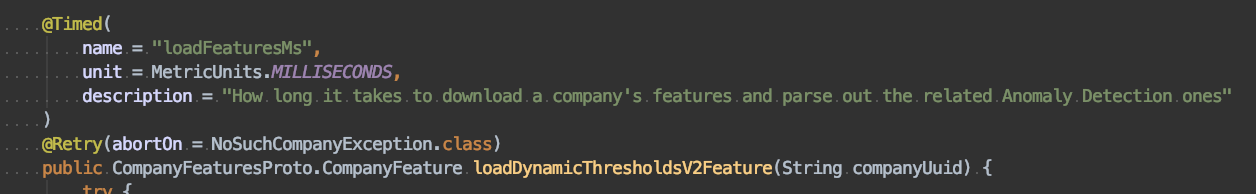
The @Timed Annotation gives you tons of information: min, max, mean, throughput, percentiles). This screenshot also shows the fault tolerancy feature too (which exposes its own metrics by the way). That along with the scheduled tasks was a nice treat to discover (sidenote: we discovered that the initial delay of the scheduler was not configurable, so we put in a feature request, and it was fixed within two weeks!). Okay, back to metrics:
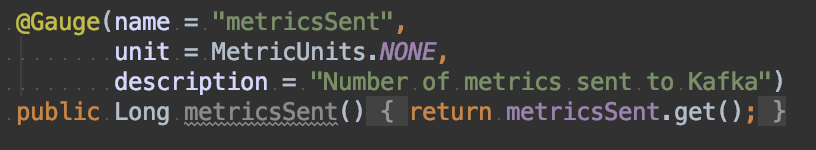
Gauges and Counters, super easy too:
Logging in Quarkus is done via JBoss, and once we added a logging.properties file we were able to tune things no problem.
Quarkus Performance – A Huge Improvement
- CPU: After deploying, we found that Quarkus used about 15% of the CPU from the previous Spring/Tomcat solution. We were able to really scale down one of the POC application’s resource requests/limits in kubernetes (about 200 cores worth across our infrastructure’s kubernetes worker nodes)
- Memory: We also saw that Quarkus used about 12% of the memory from before, so we could scale down a bunch here too (~500 GB of memory reduction across the infrastructure in this application alone)
- Startup – From 15 seconds before, we are now seeing an average of two seconds, 85% faster than before
Conclusion
At the end of our POC and deployment across our infrastructure, we ended up with both explicit and implicit improvements from resource utilization to ease of programming in the framework. So far, we are sticking with Quarkus!
About LogicMonitor
LogicMonitor is the only fully automated, cloud-based infrastructure monitoring platform for enterprise IT and managed service providers. Gain full-stack visibility for networks, cloud, servers, and more within one unified view.