Keep reading for an overview of the LogicMonitor AIOps Early Warning System and how dynamic thresholds can mitigate these common challenges and add value for MSPs.
The AIOps Early Warning System
The AIOps Early Warning System intelligently detects signals from noise. This helps you identify where to efficiently allocate your engineers’ time. Quickly identifying these signals also helps you resolve issues faster. The Early Warning System consists of four main components: anomaly detection, dynamic thresholds, topology, and root cause analysis.
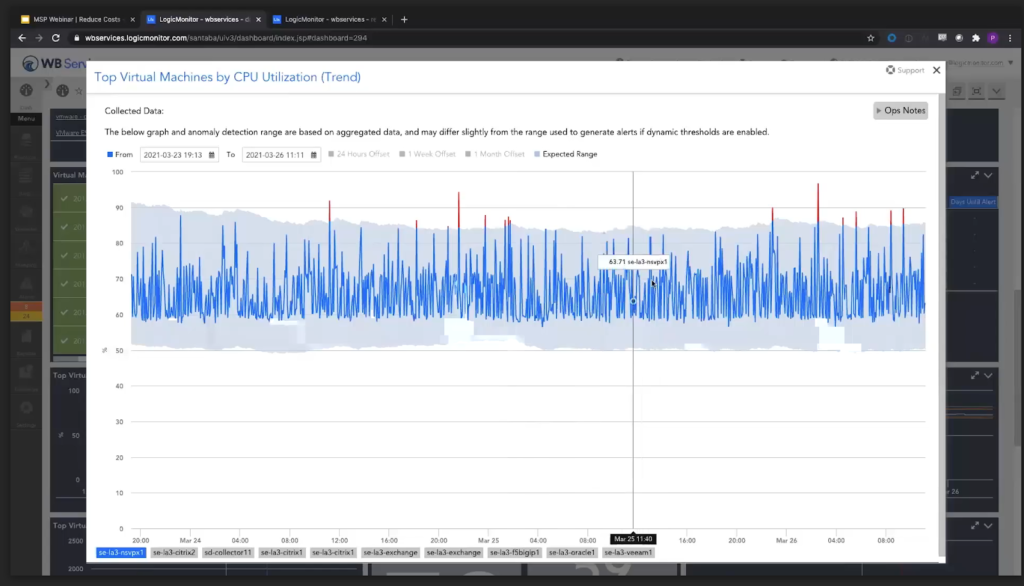
Anomaly Detection
Anomaly detection lets you visualize expected performance and compare it to historical offsets. Within the LogicMonitor platform, you can pop out an anomaly detection view to see whether what you’re seeing is normal performance or an anomaly. This saves engineers time in the troubleshooting process by allowing them to eliminate metrics or indicators that aren’t relevant.
Dynamic Thresholds
Dynamic thresholds expand on the visual anomaly detection that we offer in our metrics. Dynamic thresholds limit alert notifications based on normal behavior, such as knowing that the CPU on a server is always hot during a certain time of day. Since it detects and alerts on deviations from normal behavior, dynamic thresholds will allow you to catch deviations like a server CPU going to 0% when it is supposed to be busy.
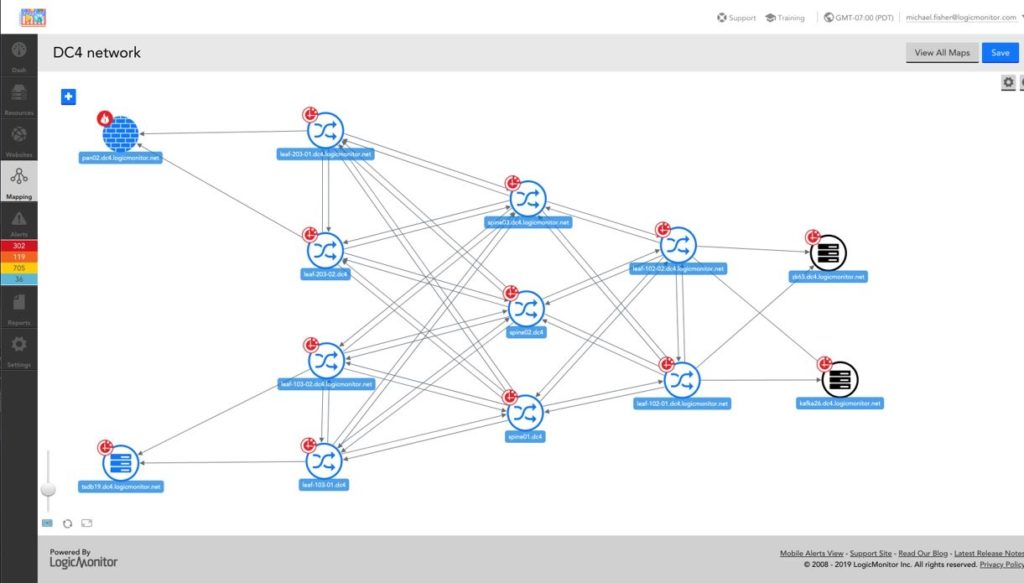
Topology
Topology automatically discovers relationships for monitored resources. It is a key part of the next component, root cause analysis.
Root Cause Analysis
Root cause analysis leverages topology to limit alert notifications. It identifies what the root incident is and group alerts due to dependencies. For example, if a firewall goes down, LogicMonitor knows what other things depend on the firewall and will only send one alert instead of many.
How Dynamic Thresholds Add Value For MSPs
Combined with other features from LogicMonitor’s Early Warning System, dynamic thresholds can help MSPs more proactively prevent problems that result in business impact. Let’s dive a little deeper into why dynamic thresholds are a key component in issue detection.
#1- Increase Productivity
The biggest benefit of dynamic thresholds is the fact that it saves engineers time. By detecting a resource’s expected range based on past performance, dynamic thresholds reduce alert noise and only send alerts when an anomaly occurs. This means that the alerts that engineers receive are meaningful. They spend less time looking at alerts and can help more customers.
#2- Resolve Issues Faster
Dynamic thresholds don’t make you wait for the static amounts to be hit, which could take hours or days. It quickly detects deviations and determines whether the alert is a warning, error, or critical. As soon as an anomaly is detected, an alert is sent to get human eyes on it. Being able to hone in on the exact cause of the alert provides engineers with more context so issues can be resolved faster.
#3- Reduce Costs
Along with saving time and resolving issues quicker, dynamic thresholds also allow MSPs to reduce costs. Experienced engineers, which are expensive, no longer need to handle monitoring and can focus on other areas of the business. Dynamic thresholds make the task of chasing thresholds easier, and less experienced engineers are empowered to do monitoring and really understand what’s going on and where their attention needs to be focused. Less experienced engineers using less time to figure out issues means more money in your pocket.
The intelligence of dynamic thresholds combined with LogicMonitor’s comprehensive monitoring coverage ensures that MSPs have the visibility they need to succeed even in the most complex of environments. To learn more about how LogicMonitor can reduce costs and accelerate workflows for MSPs, check out this on-demand webinar.
Disclaimer: The views expressed on this blog are those of the author and do not necessarily reflect the views of LogicMonitor or its affiliates.