Azure environments are growing fast, and so are the challenges of monitoring them at scale. In this blog, part of our Azure Monitoring series, we look at how real ITOps and CloudOps teams are moving beyond Azure Monitor to achieve hybrid visibility, faster troubleshooting, and better business outcomes. These real-life customer stories show what’s possible when observability becomes operational. Want the full picture? Explore the rest of the series.
When you’re managing critical infrastructure in Microsoft Azure, uptime isn’t the finish line. It’s the starting point. The IT teams making the biggest impact today aren’t just “watching” their environments. They’re using observability to drive real business results.
Here’s how a few teams across MSPs, transportation, healthcare, and financial services industries made it happen.
From Alert Overload to 40% More Engineering Time
A U.S.-based MSP hit a wall. Their engineers were buried in noisy alerts from Azure Monitor, most of them triggered by hard-coded thresholds that didn’t reflect actual performance risk. Every spike above 80% CPU usage was treated like a fire, regardless of context. Even low-priority virtual machines (VMs) were flooding their queue. The engineers risked missing acting upon critical alerts from customer environments as a result of the alert volume.
They replaced static thresholds with dynamic alerting tuned to each environment’s baseline behavior. They grouped resources by service tier (prod, dev, staging), applied tag-based routing, and built dashboards that surfaced only the issues tied to Service Level Agreements (SLAs). Alert noise dropped by 40%, and engineering teams reclaimed hours every week.
That shift gave them room to grow. With alerting automated and right-sized in hybrid cloud environments, they began onboarding larger Azure and AWS clients, without hiring a single new engineer.
Closing a Two-Year-Old Security Incident in Weeks
A large State Department of Transportation agency had a major incident stuck open for two years. The issue stemmed from legacy configuration still active on hundreds of network switches scattered across their Azure-connected infrastructure. Locating the problematic issues was manual and perpetually delayed.
They implemented a daily configuration check using LM Envision’s config monitoring module. It parsed more than 200,000 lines of device config and flagged insecure settings, like enablement and out-of-date templates. The checks were centralized and visualized in a dashboard that allowed regional teams to see their exposure and act fast.
The result: the ticket that had been aging for 24 months was resolved in less than 30 days. With better security posture and a clean audit trail, leadership could reallocate engineers on other tasks.
How Faster Onboarding Opened the Door to New Revenue
This US-based MSP had strong cloud expertise but couldn’t scale their customer resource onboarding. Setting up Azure, AWS, and GCP monitoring for each new client meant dozens of hours of manual discovery, custom dashboards, and alert tuning. That friction slowed down sales and burned out engineers, risking an impact on customer experiences.
They used LM Envision’s NetScans to automatically detect resources and apply monitoring templates out of the gate. Azure tags were used to dynamically assign devices to dashboards and alert groups based on environment type (e.g., staging, prod, compliance-sensitive).
With onboarding time cut by 50%, engineers stopped spending entire days mapping assets. They started delivering value in hours, not weeks. That faster resource discovery turned into a 25% boost in upsell revenue and stronger relationships with larger clients.
Disaster Recovery That Actually Worked When It Mattered
When a major hurricane approached, a national healthcare organization had one goal: to keep patient services online.
Instead of guessing, they built a hurricane dashboard using LM Envision’s map widgets, Azure health metrics, WAN connectivity, and power backup status from key clinics. Each site was tied to alert routing by region and risk level.
When the storm hit, they saw in real time which sites were offline, which were degraded, and which needed immediate intervention. In some cases, IT teams were on-site fixing issues before the clinic staff even realized that the systems were down.
That level of coordination protected patient communication, medication workflows, and internal scheduling during one of the most vulnerable weeks of the year.
From Cost Overruns to Six-Figure Savings
This financial services company knew Azure was expensive, but they didn’t realize how many untagged, idle, or misconfigured resources were going unnoticed.
They enabled Cost Optimization in LM Envision, giving them clear visibility into underutilized resources like VMs running 24/7 with minimal CPU usage and premium-priced disks or databases with no active connections. These insights were difficult to surface in Azure Monitor alone.
They also configured cost anomaly detection using custom thresholds tied to monthly budgets. Within 90 days, they identified and decommissioned more than $100K of wasted resources and reduced their mean time to resolution (MTTR) for cost-related incidents by 35%.
Finance teams got cleaner forecasts. Engineering teams kept their performance visibility. Everyone got a win.
The Real Lesson
Monitoring Azure in a hybrid environment helps MSPs and enterprises deliver more uptime, better security, lower costs, and faster growth. Engineers experience reduced alert noise, lower costs, and faster resource discovery so their time could be better spent solving critical problems related to their businesses.
These teams didn’t just swap tools. They shifted mindsets. If you’re ready to do the same, we’re here to help.
Your Kubernetes environment feels perpetually sluggish. Applications that once met performance benchmarks and service-level agreements are now struggling to keep up and operating costs continue to rise. With no clear indicators, you’re left sifting through application logs and dependencies for a root cause.
For modern CloudOps teams, this scenario is all too familiar and it’s happening with increasing frequency as containerized applications become more complex. At the heart of this challenge lies the very nature of Kubernetes itself: an inherently dynamic system where resources like pods, nodes, and containers are constantly being created, scaled, and destroyed. In this environment, even a single pod failure can cascade into application-wide outages.
Robust monitoring isn’t just helpful—it’s critical for maintaining visibility across the Kubernetes ecosystem. Proactive management of these dynamic resources ensures smooth operations and prevents issues before they disrupt your users.
In this guide, you’ll learn about Kubernetes monitoring by exploring its role in maintaining the health and performance of your hybrid cloud applications.
Understanding Kubernetes monitoring
Kubernetes monitoring involves tracking and analyzing the applications and infrastructure running within your Kubernetes cluster. It uses logs, metrics, and events to monitor health and performance, helping you identify potential issues, optimize workloads, and maintain high availability. In addition, Kubernetes deployments are often spread across development teams where limited visibility can lead to forms of cloud sprawl and infrastructure inefficiencies.
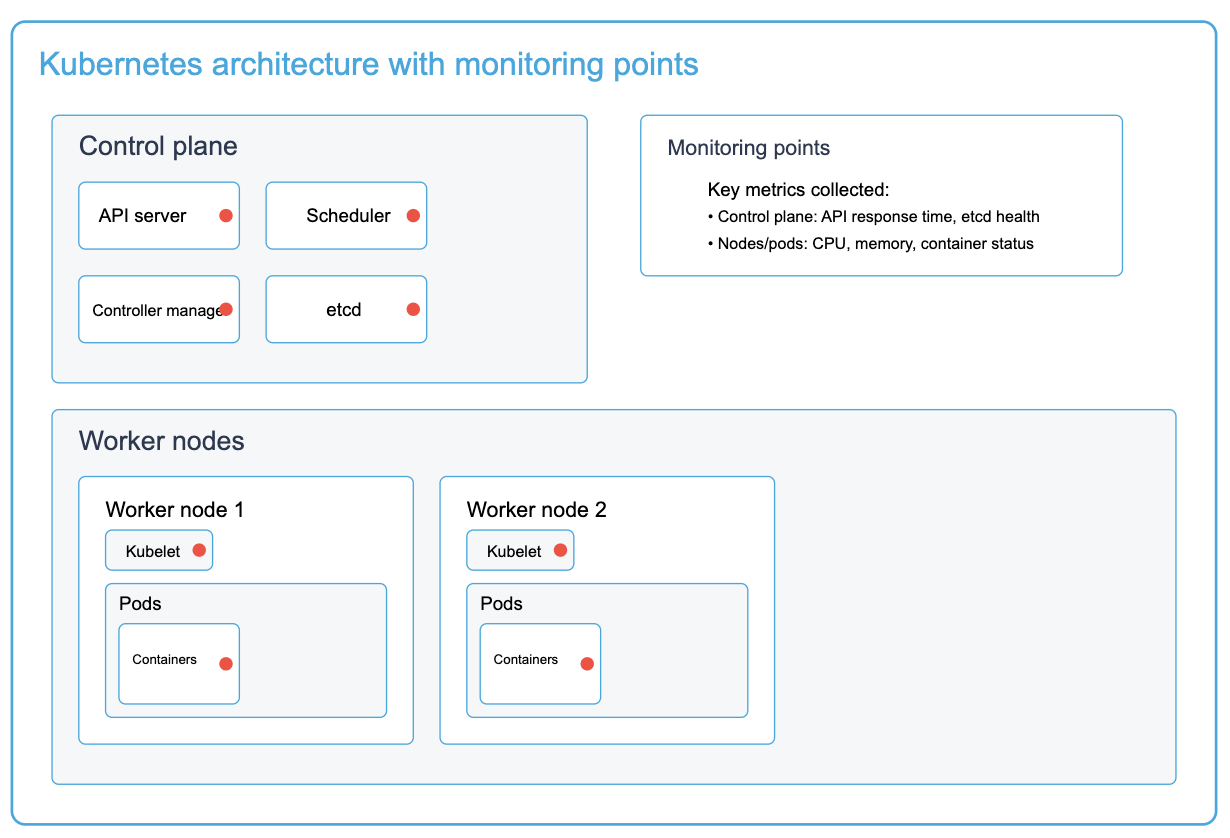
A comprehensive view of a Kubernetes cluster architecture showing key monitoring points across the control plane and worker nodes. Red indicators represent critical monitoring points where metrics are collected for observability
Strategies for monitoring Kubernetes deployments
Within your Kubernetes infrastructure, you have a master node with Kubernetes-specific components, like the scheduler and API server, as well as the worker nodes with their respective pods, containers, and containerized applications. To get a clear picture of your Kubernetes cluster and how it affects business services, tracking the health and performance of its components at every level is critical, including monitoring the Kubernetes cluster, individual pods, and application-specific metrics.
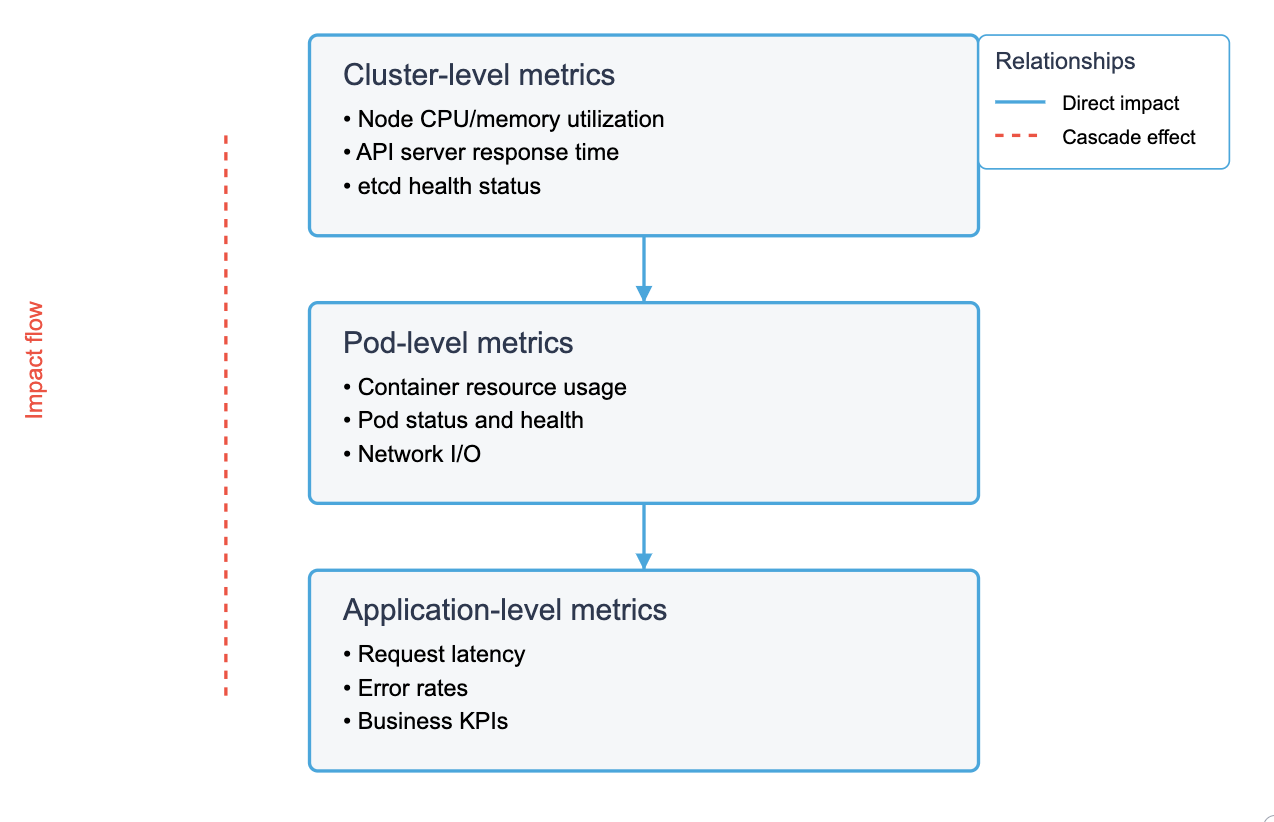
Hierarchical view of Kubernetes metrics showing the relationships between infrastructure, workload, and application monitoring. The cascade effect (red dashed line) demonstrates how issues at any level can impact overall system health and performance.
Let’s explore each layer of your Kubernetes infrastructure to understand what metrics matter and why.
Monitoring the Kubernetes cluster
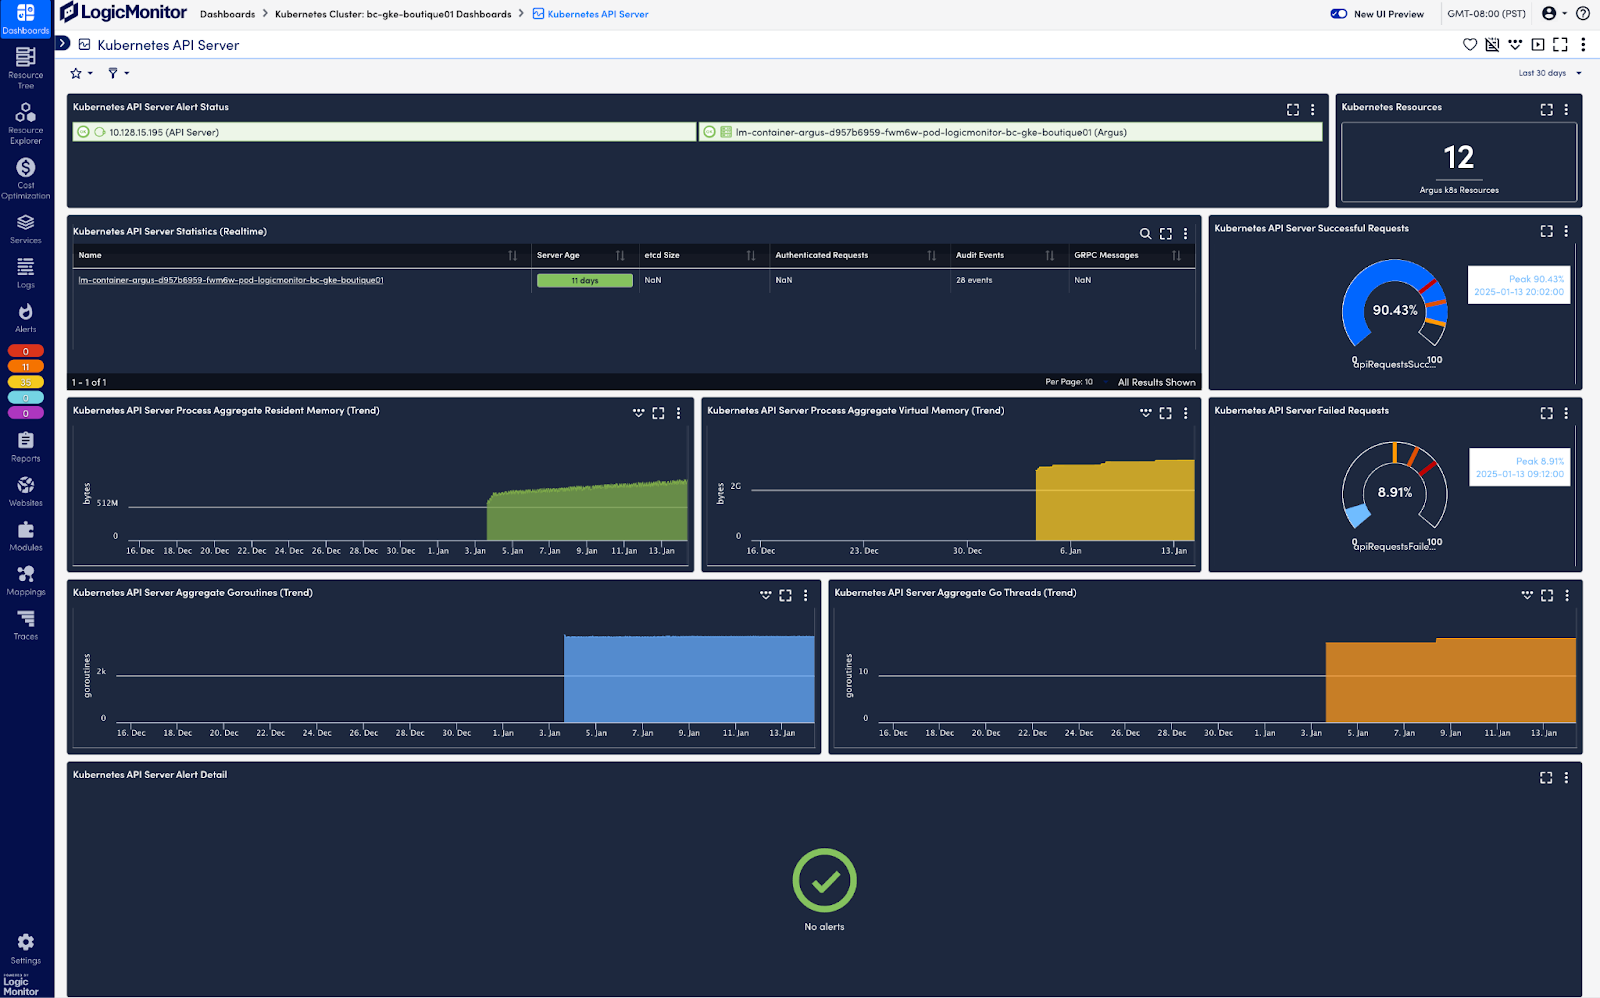
Gaining observability of your overall cluster is necessary to understand your Kubernetes environment effectively. This means: collecting resource metrics on what is being used within your cluster; identifying which elements, like pods, are currently running; and assessing the current status of components (e.g., API server, scheduler) within your Kubernetes environment. Kubernetes automatically collects these data points and exposes them through its API.
To collect and analyze metrics and resource data from the Kubernetes API, the Cloud Native Computing Foundation (CNCF) recommends solutions like LogicMonitor Envision. LM Envision integrates as a pod in your cluster, listening to the Kubernetes event stream without requiring additional monitoring agents. It automatically discovers new resources, aggregates operational data, and surfaces actionable insights through comprehensive dashboards. This enables effective monitoring of resource utilization metrics, providing the visibility needed to analyze nodes, pods, and applications and optimize cluster performance:
Resource utilization within the cluster
CPU, memory, network, and disk utilization metrics are key to monitoring the health of your Kubernetes cluster. They help you identify if resources are being used efficiently and detect potential bottlenecks or performance issues that could impact your workload. These metrics can be automatically discovered and tracked through regular queries to the Kubernetes API, ensuring your monitoring adapts to changes in the Kubernetes environment.
Pro tip: Monitor both real-time usage and trends over time to identify potential capacity issues before they impact performance.
For example, you should monitor the number of nodes and the status of pods to maintain visibility into your cluster’s infrastructure. Downed nodes may indicate capacity issues, while pod failures and restarts could suggest issues with your application or resource constraints:
Tracking availability
Kubernetes components, such as the API server, form the core for all communication with the cluster and your Kubernetes operations. Monitoring the health and availability of your cluster’s API server can help with debugging and ensuring smooth executions within your cluster:
Paying attention to your Kubernetes network is important for tracking availability within your cluster. Set up alerts on network policy conflicts and service health checks to ensure network connectivity doesn’t affect service deployments, discovery, and pod operations.
Cluster-level metrics
The following are some critical data points to look for within your cluster. These metrics can help you proactively prevent large-scale Kubernetes outages:
- Node CPU utilization: High CPU usage can lead to throttling and degraded performance across all pods on the node. Set up specific alerting thresholds for your CPU utilization, such as a warning threshold at 70 percent and a critical threshold at 85 percent. This helps you effectively intervene before CPU constraints cause widespread problems.
- Node memory utilization: Low memory causes pod evictions and OOM kills. Configure alerts at 80 percent (warning) and 90 percent (critical) of total node memory to prevent these issues.
- Pod scheduling failures and pending pods: are indicators of cluster capacity issues. They can be caused by resource constraints or configuration issues. Monitor for spikes in failures and pending pods, such as three pods within a five-minute window or five pods for more than ten minutes.
- Node allocatable resources vs. requests/limits ratio: This ratio helps you maximize capacity and avoid resource depletion. It can also be used to forecast scalability needs and handle usage spikes. Try to maintain a buffer with about 20 percent of allocatable resources. Set up alerts when capacity falls below this value.
- Kubelet response latency: Slow kubelet responses indicate node health issues. Delays above 800ms suggest that the node is struggling to manage its pods, which can affect pod lifecycle operations and health checks.
- etcd health status and leader election rate: Issues with your etcd can disrupt the entire cluster. Leader election issues generally imply etcd network or consensus issues. Monitor the occurrence of leader elections, with two or more in 15 minutes or less being a warning sign.
- API server latency: Latency over 200ms affects deployments, scaling, and kubectl commands. It can also hinder control plane operations and responsiveness.
- Node not ready events: These events can indicate kubelet issues, network problems, or hardware failures affecting pod scheduling. Monitor their duration closely, as recurring events multiple nodes may point to cluster-wide problems.
- Persistent volume claim failures: These failures affect stateful applications and data persistence. They may also block pod scheduling and application deployment. Set up capacity alerts on your storage classes to ensure adequate buffer for your operations.
Pro tip: Set appropriate thresholds and alerts for these metrics to prevent cluster-wise issues.
With your general cluster monitoring setup, you’ve addressed visibility gaps for cluster-wide and infrastructure-related issues. The next step is examining the more granular level of individual pods and their specific monitoring requirements.
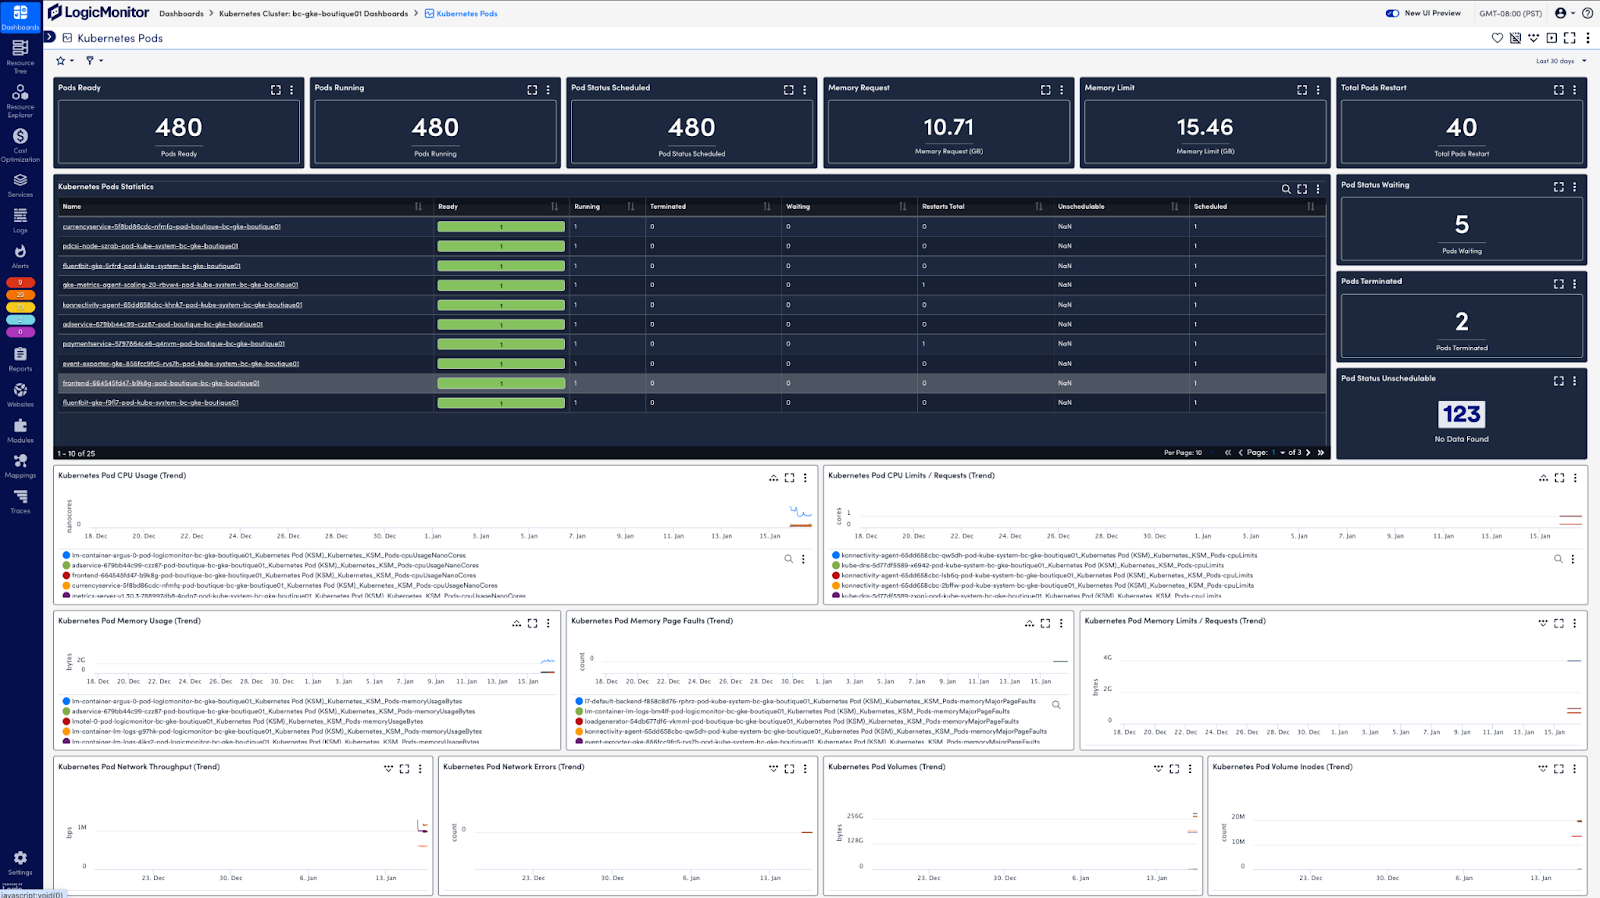
Monitoring individual pods
While cluster-level monitoring provides the big picture, pod-level observability helps you catch issues before they impact your applications.
Within your individual pods, you need to know how the pod itself is functioning and the execution of operations within the pod. You can start by tracking resource utilization. For example, CPU utilization (both requests and limits), memory consumption, storage metrics (if persistent volumes are in use), and network throughput (ingress and egress traffic) are important factors to track. The pod’s current status (e.g., running, pending, unknown, succeeded, or failed) and restart counts are also good indicators of pod readiness. This information can be retrieved through queries to the Kubernetes API and can be collected and displayed automatically with tools like LogicMonitor:
Pod logs
Logs also provide insights into operations within your pod and their containers. You can analyze timestamps between operations to observe response time and optimize efficiency. Warning and error messages reveal failures and bottlenecks, offering critical information for troubleshooting. Kubernetes inherently provides logs, which can be forwarded to your monitoring solution through the API.
With LM Envision, you can ingest Kubernetes logs and events, such as pod creation and removal. You can also set up alerts on your resource metrics and logged events, helping you respond quickly to failed operations or unplanned spikes.
Pro tip: Use log aggregation to correlate events across multiple pods and identify patterns.
Tracking configuration changes
Configuration changes in your Kubernetes environment can lead to broad transformations across pods and services. This can be a source of problems in your deployed applications. Updates to deployment manifests, resource quotas, or network policies can destabilize previously running workloads. Solutions like LM Envision offer configuration monitoring, giving you a detailed log of modifications to deployment and network configurations. This enables you to directly correlate changes to performance metrics and set up alerts and triggers on these monitored datapoints. Monitoring and storing your configuration changes also gives you a detailed audit trail for troubleshooting and debugging.
Resource grouping
You can also group and aggregate Kubernetes resources and components to better correlate observed behavior across your pods, applications, and the general cluster. This is usually done using key-value labels attached to your Kubernetes resources or using Kubernetes namespaces to delineate resources. With this setup, you can navigate between high-level metrics and granular events, moving from an overview of cluster and pod performance to detailed information on operations within individual components.
Pod-level metrics
Let’s look at some specific pod-level metrics that are critical to the health of your infrastructure and can help you debug and predict issues:
- Container restart count: The kubelet restarts containers to handle faults and failures in the container. Frequent restarts indicate application instability or resource constraint issues. For example, more than three restarts in 15 minutes is a warning sign.
- Pod scheduling latency: refers to the speed at which new pods are placed—long scheduling times affect your deployment speed and scaling efficiency. If new pods take more than ten seconds to be scheduled, you might have issues with your pods.
- Pending pod count: A pod is considered pending when it can’t be scheduled onto a node. Explore your resources, node taints, affinity rules, and PVC bindings if this count exceeds observed benchmarks.
- Pod startup time: Prolonged startup times during updates or failures can disrupt application availability. A pod taking more than 30 seconds to start can indicate resource or application failures.
- OOMKilled events: These events point to memory limit issues or memory leaks within your applications. Set up alerts for their occurrence, with spikes of more than two within 30 minutes being critical.
- Container throttling metrics: Examples include the number of times the container has been throttled and how long it has been throttled. Monitor these metrics to optimize your resource allocation and operations.
- Pod network I/O errors: Errors in network I/O directly affects services and operations within your pod.
- Volume I/O latency: Important for database applications and transaction-intensive workloads. It helps with storage inefficiencies and bottlenecks. Delays above 100ms could lead to further clogs in your workflow.
- Init container failures: Crucial for application and pod startup. It can indicate issues within your application logic.
- Probe failures: Liveness and readiness probes are important indicators for application health and service availability.
- ImagePullBackOff errors: Indicate faulty container images and affect pod deployments and updates.
Understanding cluster and pod health is crucial, but ultimately, application performance is what matters to your end users.
Application logging and tracing
To effectively monitor your application, start by collecting and querying your application logs for error messages, debugging information, and request details. Consistent log metadata is essential for enabling distributed tracing. The distributed tracing capability of LM Envision uses OpenTelemetry collectors to track and forward trace data for analysis. Your application and services may span multiple pods and nodes, with requests passing through various applications. Distributed tracing provides the visibility you need to track these requests and gain insights into service interactions and bottlenecks.
Pro tip: Use distributed tracing to track requests across microservices and identify bottlenecks.
Integrating tools like Prometheus and OpenTelemetry enables more granular metrics and tracing within your application. These tools give you the control and flexibility you need to monitor specific areas and behavior within your application. With their support for interoperability and the OpenMetrics standard, you can easily expose custom data and integrate it into LM Envision for streamlined analysis.
Tailored monitoring
Different applications require different monitoring approaches and performance indicators. For a web application, focus on availability, content delivery metrics, and user behavior. For data-heavy or database applications, prioritize query performance, processing power, and storage capacity.
Using tools like LM Envision integrates both application and Kubernetes infrastructure metrics into one platform. For example, application metrics collected from Prometheus can be displayed alongside Kubernetes-specific infrastructure metrics correlating application performance with underlying infrastructure health. This provides unified dashboards for quick visibility, helping you pinpoint bottlenecks and fix infrastructure and application issues.
Application-level metrics
Lastly, let’s look at some key application-level data points for debugging and proactive optimization.
- Request latency percentiles: Showcase the maximum response times influencing application performance, speed, and user experience. For example, a p95 of 150ms means 95 percent of the requests made by your users were completed within 150ms or less.
- Error budget consumption rate: If your SLOs have explicit margins for errors, it’s important to track this and ensure you’re meeting service reliability targets. Try to monitor for repeated errors within a short period of time to debug issues quickly.
- Service level indicator (SLI) metrics: are contractual markers for your service to your customers. They commonly include golden signals, such as latency, traffic, and errors. You can set up alert thresholds based on your service agreements (e.g., warnings on sudden drops in traffic (>20 percent) and more than 80 percent of resource utilization).
Wrapping up
When managing Kubernetes clusters in production, especially in hybrid cloud environments, your monitoring suite can make or break you. Operations span multiple environments and services, and failures in one component can trigger widespread issues. As you scale, having clear visibility and the ability to trace and resolve problems is crucial.
LM Envision is an AI-powered hybrid observability platform that integrates seamlessly across Kubernetes environments (on-premises and cloud) and cloud providers, including Amazon Elastic Kubernetes Service (Amazon EKS), Azure Kubernetes Service (AKS), and Google Kubernetes Engine (GKE). With a full suite of metrics, events, logs, and traces, LogicMonitor also has a generative AI agent designed to help IT teams reduce alert noise and move from reactive to proactive.
If Artificial Intelligence is the ultimate multi-tool for IT operations (as discussed in our first article), then DevOps, Network Ops, Site Reliability Engineers (SREs), and SecOps are the teams using it. How each team uses AIOps’ capabilities will improve interconnectivity across an organization’s digital landscape, accelerate the production of high-priority business objectives, and reduce downtime to pave the way for a smoother developer and user experience.
Understanding the teams driving IT operations success
Before we map capabilities to teams, let’s establish some broad team definitions as they may currently exist within IT operations:
- DevOps: Ensure smooth collaboration between development and operations.
Priorities include automation, issue detection, and optimizing workflows to speed up software development and delivery.
- IT operations: Manage and maintain the organization’s IT infrastructure.
Priorities include improving operational efficiency, reducing downtime, and improving system reliability.
- Network operations: Manage and maintain the operation’s network infrastructure.
Priorities include identifying bottlenecks and predicting potential network issues.
- SRE: As an operational group, SREs own the back-end infrastructure responsible for the customer experience and consult with developer teams to ensure the infrastructure can support applications.
Priorities include avoiding downtime among revenue-critical systems, preventing bandwidth outages, and fixing configuration errors.
- Security operations: Protects the organization’s systems and data from security threats.
Priorities include security log analysis and response, as well as identifying anomalies or vulnerabilities.
Establishing a strong foundation: Key AIOps capabilities by team
AIOps uses artificial intelligence, machine learning, and consolidated operational platforms to automate repetitive or mundane tasks and streamline cross-team communications. An AIOps deployment is the scaffolding IT operations use to build evolving workflows so the teams can be more proactive, innovative, and able to accelerate the delivery of high-priority projects. That’s why we are seeing more AIOps success stories about how AIOps can liberate 40% of your engineering time through the automation of labor-intensive analysis or how Managed Service Providers (MSPs) are implementing AIOps’ intelligent alerting capabilities to dramatically reduce downtime.
So let’s dig into which three AIOps capabilities each team may leverage first:
DevOps
- Enhanced efficiency: Automating repetitive and manual tasks frees up time to focus on higher-value initiatives, increasing efficiency and productivity across the entire team.
- Faster mean time to resolution (MTTR): Streamlining incident management processes ensures faster issue identification, analysis, “next steps,” cross-team communications, and, ultimately, issue resolution. With automation doing the heavy lifting, these steps can happen outside of work hours. This 24/7 approach reduces the time to resolution, minimizing any impact on operations.
- Scalability and adaptability: AI and machine learning’s self-learning properties are made to handle complex and rapidly evolving technology stacks in dynamic environments.
Watch the 3-minute video below for more on how DevOps can use AIOps for faster issue resolution through integration with open-source provisioning and configuration management tools.
IT Operations
- Incident management: AIOps streamline incident identification and root cause analysis and escalate incidents to the right teams and people who can pinpoint the source of an issue and quickly fix it. Post-incident reviews are used to build resilience in systems to prevent future occurrences of similar incidents. Faster resolution reduces MTTR and operational impact.
- Scalability and adaptability: IT infrastructure has to adapt to business needs. AIOps systems handle the complexity of evolving modern stacks and dynamic environments, including hybrid and multi-cloud architectures. Faster scaling sets ITOps up for success in that they can effectively manage and monitor expanding IT landscapes at any stage of growth.
- Resource and cost optimization: Capacity planning and the automation of tasks lets ITOps teams allocate resources more efficiently, freeing up budget and personnel for new endeavors or headcount strategies.
Network Ops
- Streamlined troubleshooting: Automated root cause analysis capabilities quickly pinpoint the root causes of network issues, accelerating troubleshooting and improving uptime.
- Capacity planning: Historical and real-time data analysis on network use patterns, forecasted future demands, and resource allocation enables the team to reassign assets as needed to prevent network congestion and keep operations consistent while supporting business growth.
- Network security enhancement: Leveraging AI-driven algorithms that analyze network traffic, detect anomalies, and identify potential security threats enables Network Ops teams to take proactive measures ahead of a breach.
SRE
- Elasticity: As SRE teams manage complex and dynamic environments, including cloud-based systems and microservices architectures, AIOps provides the ability to scale and adapt to changing demands. AIOps ensures the SRE team can effectively monitor, manage, and optimize the system’s performance as it grows and evolves.
- Continuous optimization: AIOps analyzes data from various sources, including logs, metrics, and events, then identifies optimization opportunities that SRE teams can enact. Leveraging AI insights to make data-driven decisions, implement proactive measures, and continuously refine their infrastructure to achieve greater reliability.
- Collaboration and knowledge sharing: By providing a centralized platform for data collection, analysis, and visualization, AIOps facilitates communication and sharing of information so associated teams (such as developers) can align their efforts towards common goals, leading to improved teamwork and faster problem-solving.
SecOps
- Advanced threat detection: AIOps enhances threat detection capabilities by analyzing vast amounts of security-related data from various sources, such as logs, network traffic, and user behavior. AI-driven algorithms can identify patterns, anomalies, and potential security threats in real time, enabling SecOps teams to respond promptly to security incidents, minimizing damage caused by cyber threats.
- Threat intelligence integration: AIOps integrates with threat intelligence feeds and external security sources to enhance the effectiveness of security operations. By leveraging external threat intelligence data, AIOps enriches its analysis and detection capabilities, allowing SecOps teams to stay updated on the latest threats and attack vectors. This integration strengthens the overall security posture and enables proactive defense against emerging threats.
- Compliance and regulatory requirements: AIOps automate compliance monitoring and reporting processes and then compare them against predefined standards and regulations to evolve the automation and compliance process so teams consistently meet compliance and regulatory requirements.
Integrating AIOps for teams with existing tools
Seamless integration for unified operations
One of the standout advantages of AIOps is its ability to integrate with existing IT tools, providing a unified platform for monitoring, automation, and insights. Whether you’re leveraging monitoring tools like LogicMonitor, managing hybrid or multi-cloud environments, or maintaining CI/CD pipelines, AIOps can enhance and extend their functionality rather than replace them.
Compatibility with monitoring tools
AIOps platforms, such as LogicMonitor, act as a central hub, aggregating data from multiple monitoring tools to provide a unified view of IT operations. For example, integrating LogicMonitor with AIOps capabilities allows teams to consolidate alerts, correlate events, and automate responses—all from a single dashboard. This integration reduces manual intervention and provides actionable insights in real-time.
Enhancing cloud platforms
AIOps is designed to operate seamlessly in hybrid and multi-cloud environments. By analyzing data from cloud-native tools, AIOps systems provide predictive analytics, helping IT teams optimize workloads, prevent resource exhaustion, and identify anomalies before they escalate into problems.
Streamlining CI/CD pipelines
For DevOps teams, AIOps tools integrate with CI/CD platforms to enable continuous monitoring and intelligent automation throughout the development lifecycle. This ensures faster feedback loops, reduces downtime caused by deployment errors, and optimizes application performance.
Addressing legacy system concerns
One common concern when adopting AIOps is its compatibility with legacy systems. AIOps platforms are built with integration in mind, offering APIs and connectors that bridge the gap between older systems and modern tools. By applying machine learning to data generated by legacy tools, AIOps can derive valuable insights while extending the life of existing systems.
Laying the groundwork for success
To fully unlock the transformative potential of AIOps, organizations need to establish a strong foundation. These best practices ensure that teams can effectively leverage AIOps capabilities while minimizing disruptions and maximizing impact.
1. Prioritize data quality and accessibility
AIOps thrives on accurate and comprehensive data. Ensure all data sources—whether from legacy systems, monitoring tools, or cloud platforms—are clean, consistent, and consolidated. By breaking down data silos and standardizing formats, teams can enable AIOps to deliver actionable insights with precision.
2. Foster cross-team collaboration
AIOps works best when IT teams such as DevOps, Network Ops, and SREs collaborate seamlessly. Establish shared goals and encourage open communication to align team efforts. Unified dashboards, like those offered by LogicMonitor, help bridge gaps and provide everyone with a clear view of the operational landscape.
3. Start with targeted use cases
Rather than implementing AIOps broadly, begin with specific high-impact applications. Use cases such as automated incident management or anomaly detection are excellent starting points for demonstrating value and gaining stakeholder buy-in.
4. Balance automation with human oversight
While AIOps excels at automating repetitive tasks, human judgment remains critical for nuanced decision-making. Pair automated workflows with manual checks for complex scenarios to ensure both speed and accuracy in IT operations.
5. Commit to continuous improvement
AIOps systems evolve over time. Regularly monitor performance metrics, gather team feedback, and refine algorithms to adapt to changing environments. This iterative approach ensures long-term success and sustained benefits.
AIOps Use Cases
Here are some of the key use cases of AIOps in IT operations:
1. Identifying problems based on anomalies or deviations from normal behavior
AIOps enhances IT systems by using machine learning to detect anomalies and potential issues, unlike traditional tools that rely on manual configuration and threshold alerts. It analyzes data in real-time, flags deviations from normal behavior, and allows IT teams to address problems before they escalate.
2. Forecasting the value of a certain metric to prevent outages or downtime
AIOps forecasts crucial metrics like server capacity and network bandwidth, alerting IT teams before they reach critical levels. This proactive approach helps prevent outages and disruptions. By using machine learning algorithms, AIOps monitors data trends to predict threshold breaches, enabling preemptive actions to mitigate issues.
3. Improving incident response and resolution times
AIOps substantially improves incident response and resolution times by automatically correlating events from various sources and providing intelligent insights for root cause analysis. Machine learning algorithms effectively process large volumes of data from logs, alerts, and metrics to identify the root cause of incidents. This methodology not only expedites incident response but also reduces the mean time to resolution (MTTR), thereby minimizing the impact on business operations.
4. Enhancing IT operations through automation
AIOps presents substantial benefits by automating routine tasks and processes within IT operations, allowing IT teams to focus on higher-value activities such as strategic planning and problem-solving. This automation ranges from fundamental tasks like ticket routing and categorization to more complex processes such as incident remediation based on predefined rules. Consequently, it enhances efficiency, reduces the risk of human error, and streamlines workflows.
Take your IT operations to the next level
AIOps give teams the tools they need to transform from reactive to proactive. The combination of artificial intelligence and machine learning accelerates issue mitigation, breaks through work silos, improves systems security and scalability, increases productivity, reduces error risk and optimizes resources and costs. Having an AI-empowered IT operation means an organization’s infrastructure is instantly ready to handle roadblocks for a smoother developer and user experience.
LogicMonitor’s AIOps platform empowers businesses to transition from reactive troubleshooting to proactive, intelligent operations. With AI and machine learning capabilities, LogicMonitor provides meaningful alerts, illuminates patterns, and enables foresight and automation. Spend less time resolving issues and more time driving innovation.
LogicMonitor is proud to power the journey to AIOps by offering these free educational resources:
What is AIOps and How is it Changing IT Operations?
Simplify Troubleshooting with AIOps
Monitoring and Alerting Best Practices Guide
Sensirion Goes from 8 Monitoring Tools to Just One
Comprehensive AIOps for monitoring
Unlocking the Path to Automation with LogicMonitor
Keeping a network in top shape is essential, especially when a single bottleneck can slow down the whole operation. Troubleshooting network problems quickly keeps network performance on track, and NetFlow delivers advanced network services to organizations. This gives network admins and engineers real-time traffic visibility that helps track bandwidth and resolve issues before they become headaches—while also boosting performance.
By tapping into built-in NetFlow on routers and switches, you can get a front-row view of what’s actually happening across your network. This guide dives into everything you need to know about how to effectively use a NetFlow traffic analyzer to track bandwidth usage, identify traffic bottlenecks, and optimize network performance, giving your IT teams the tools to address issues before they impact users.
This article will touch base on the following areas:
- NetfFlow versions and flow record
- Key applications of NetfFlow
- Monitoring NetFlow data
- Insights gained through NetFlow monitoring
What is a NetFlow traffic analyzer?
A NetFlow traffic analyzer is a powerful tool that provides deep insights into network traffic patterns by analyzing NetFlow data generated by network devices. This tool helps network engineers and administrators monitor bandwidth, detect anomalies, and optimize network performance in real-time. Analyzing NetFlow data shows where bandwidth is used, by whom, and for what purpose, giving IT teams critical visibility to troubleshoot and manage network traffic effectively.
Understanding NetFlow
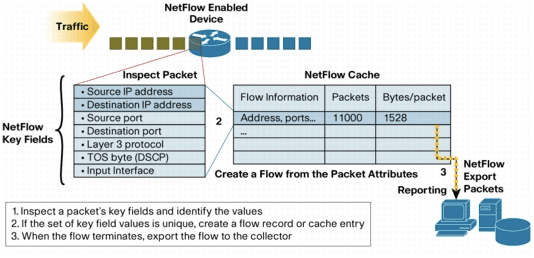
NetFlow is a network protocol developed by Cisco Systems to collect detailed information about IP traffic. Now widely used across the industry, NetFlow captures data such as source and destination IP addresses and ports, IP protocol, and IP service types. Using this data, network teams can answer essential questions, such as:
- Who is using the bandwidth? (Identifying users)
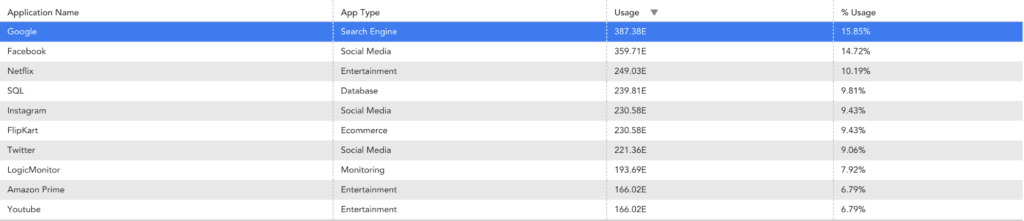
- What is consuming bandwidth? (Tracking applications)
- How much bandwidth is being used? (Highlighting “Top Talkers”)
- When is the peak bandwidth usage? (Monitoring top flows)
- Where are bandwidth demands the highest? (Analyzing network interfaces)
What is NetFlow data?
NetFlow data refers to the specific information the NetFlow protocol captures to track and analyze network behavior. It acts like a blueprint of network traffic, detailing everything you need to know about how data moves through your network. By breaking down source, destination, and flow details, NetFlow data allows network administrators to pinpoint the who, what, where, when, and how of bandwidth usage.
The evolution of NetFlow and Flow Records
NetFlow has come a long way since its start, with multiple versions introducing new capabilities to meet the growing demands of network monitoring. Each iteration brought enhanced features to capture and analyze network traffic, with NetFlow v5 and NetFlow v9 currently being the most commonly used versions. NetFlow v5 was an early standard, capturing a fixed set of data points per packet. NetFlow v9, however, introduced a more adaptable template-based format, including additional details like application IDs.
The most recent iteration, IPFIX (often called NetFlow v10), is an industry-standard version offering even greater flexibility. IPFIX expanded data fields and data granularity, making it possible to gather highly specific network metrics, such as DNS query types, retransmission rates, Layer 2 details like MAC addresses, and much more.
The core output of each version is the flow record, which is a detailed summary of each data packet’s key fields, like source and destination identifiers. This flow is exported to the collector for further processing, offering IT teams the granular data they need to make informed decisions and address network challenges efficiently.
How to monitor network traffic using a NetFlow analyzer
Monitoring network traffic with a NetFlow analyzer enables IT teams to capture, analyze, and visualize flow data, helping them track bandwidth usage and detect inefficiencies across the network. Here’s a breakdown of the key components in this process:
Flow exporter
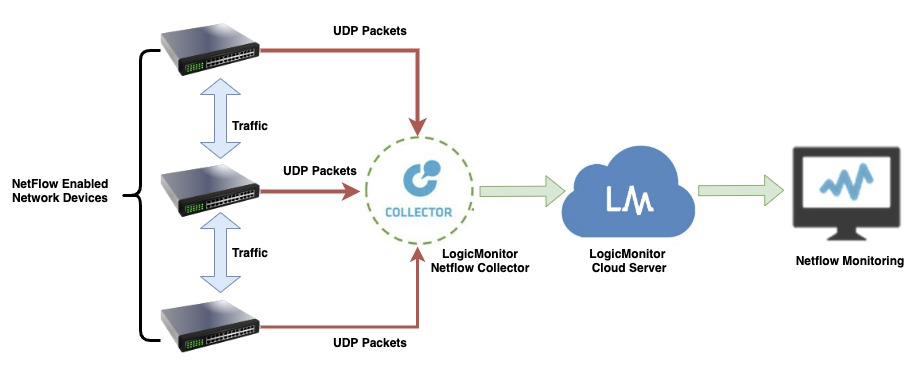
A network device, such as a router or firewall, acts as the flow exporter. This device collects packets into flows, capturing essential data points like source and destination IPs. Once accumulated, it forwards the flow records to a flow collector through UDP packets.
Flow collector
A flow collector, such as LogicMonitor’s Collector, is a central hub for all exported flow data. It gathers records from multiple flow exporters, bringing network visibility across all devices and locations together in one place. With everything in one spot, admins can analyze network traffic without the hassle of manually aggregating data.
Flow analyzer
Like LogicMonitor’s Cloud Server, the flow analyzer processes the collected flow data and provides detailed real-time network traffic analysis. This tool helps you zero in on bandwidth-heavy users, identify latency issues, and locate bottlenecks. By linking data across interfaces, protocols, and devices, LogicMonitor’s flow analyzer gives teams real-time insights to keep traffic moving smoothly and prevent disruptions.
Real-time network traffic analysis across environments
When dealing with interconnected networks, real-time analysis of network traffic helps you better understand your data flows, manage your bandwidth, and maintain ideal conditions across on-premises, cloud, and hybrid IT environments. A NetFlow analyzer lets LogicMonitor users track data flow anywhere they need to examine it and optimize traffic patterns for current and future network demands.
Real-time traffic analysis for on-premises networks
For on-prem systems, LogicMonitor’s NetFlow analysis gives you immediate insights into local network behavior. It pinpoints peak usage times and highlights applications or devices that may be using more bandwidth than they should. This real-time visibility helps you prioritize bandwidth to avoid bottlenecks and get the most out of your on-site networks.
Cloud network traffic monitoring in real-time
In a cloud environment, real-time monitoring gives you a deep look into traffic flows between cloud-native applications and resources, helping you manage network traffic with precision. LogicMonitor’s NetFlow analysis identifies high-demand services and simplifies bandwidth allocation across cloud instances, ensuring smooth data flow between applications.
Traffic analysis in hybrid cloud networks
In a hybrid cloud environment, data constantly moves between on-premises and cloud-based resources, making the LogicMonitor real-time network traffic analysis even more critical. Our NetFlow analyzer tracks data flows across both private and public cloud networks, providing real-time visibility into how traffic patterns impact bandwidth. Using real-time monitoring and historical data trends, our tools enable network administrators to ensure network resilience, manage traffic surges, and improve overall network efficiency in complex hybrid cloud settings.
LogicMonitor’s flow analyzer lets IT teams spot high-traffic areas and identify the root causes of slowdowns and bottlenecks. Armed with this information, admins can proactively adjust bandwidth allocation or tweak routing protocols to prevent congestion. This type of traffic analysis optimizes bandwidth utilization across all types of environments, supporting smooth data transfer between systems.
Why use a NetFlow traffic analyzer for your network?
A NetFlow traffic analyzer does more than just monitor your network—it gives you real-time visibility into the performance and security needed to keep everything running smoothly. With insights that help optimize network efficiency and troubleshoot issues before they become disruptions, NetFlow monitoring is an invaluable tool for keeping your network in top shape. Here’s a look at some key ways NetFlow monitoring can drive network efficiency and keep everything running smoothly:
1. Clear network visibility
A NetFlow traffic analyzer gives network admins real-time visibility into traffic flows, making it easy to see who’s using bandwidth and which apps are hogging resources. With live insights like these, admins can jump on performance bottlenecks before they become full-blown issues, ensuring users experience a smooth, seamless network. Using this data, you can quickly predict QoS (Quality Of Service) and direct resources based on users. You can also prevent network exposure to malware risks and intruders.
2. Root cause analysis of network issues
NetFlow monitoring makes finding the root cause of network slowdowns much easier. When users experience delays accessing applications, NetFlow data gives you a clear view of where your problem might be located. By analyzing traffic patterns, packet drops, and response times, your team can pinpoint which device, application, or traffic bottleneck is causing the lag. Your teams can use this data to resolve the problem at its source, keeping the network humming and users unaware.
3. Bandwidth optimization and performance troubleshooting
NetFlow data drills down into bandwidth usage across interfaces, protocols, and applications, helping you spot “top talkers”—the heaviest bandwidth users—on the network. With this detailed view, IT teams can quickly decide if high-usage traffic is relevant or needs adjusting. This helps balance resources efficiently, boosting overall network performance.
4. Forecasting bandwidth utilization and capacity planning
NetFlow data isn’t just for today’s needs; it helps IT teams look ahead. By analyzing traffic patterns over time, admins can forecast future bandwidth requirements, giving them the insight to plan capacity strategically. This proactive approach ensures your network can handle peak traffic times without slowdowns, keeping performance steady in the long run.
5. Identification of Security Breach
A NetFlow traffic analyzer is invaluable for detecting potential security threats, from unusual traffic spikes to unauthorized access attempts. Many types of security attacks consume network resources and cause anomalous usage spikes, which might mean a security breach. NetFlow data enables admins to monitor, receive alerts, and investigate suspicious patterns in real-time, addressing issues before they become security breaches.
Key insights from LogicMonitor’s NetFlow monitoring
Using LogicMonitor’s NetFlow Monitoring, one can get valuable insights on the below data points:
- Bandwidth Utilization
Identify the network conversation from the source and destination IP addresses and traffic path in the network from the Input and Output interface information.

- Top Flows and Top Talkers
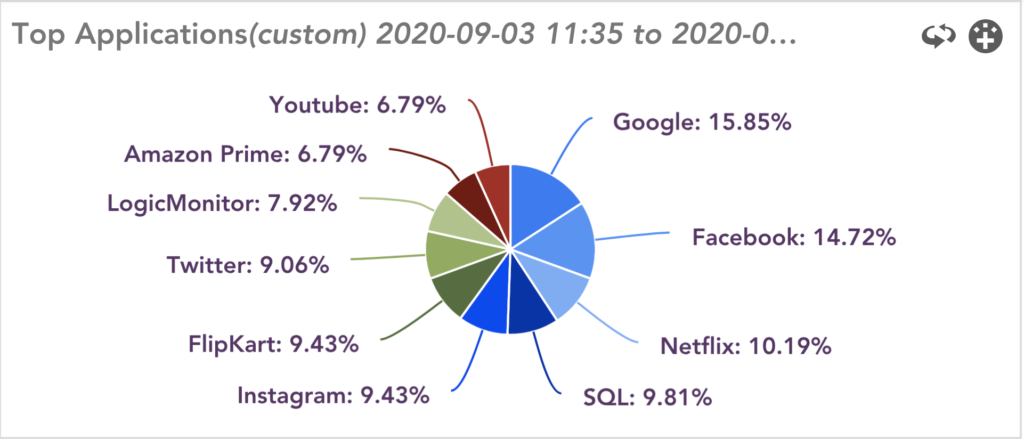
Identify Top N applications, Top Source/Destination Endpoints, and protocols consuming the network bandwidth.
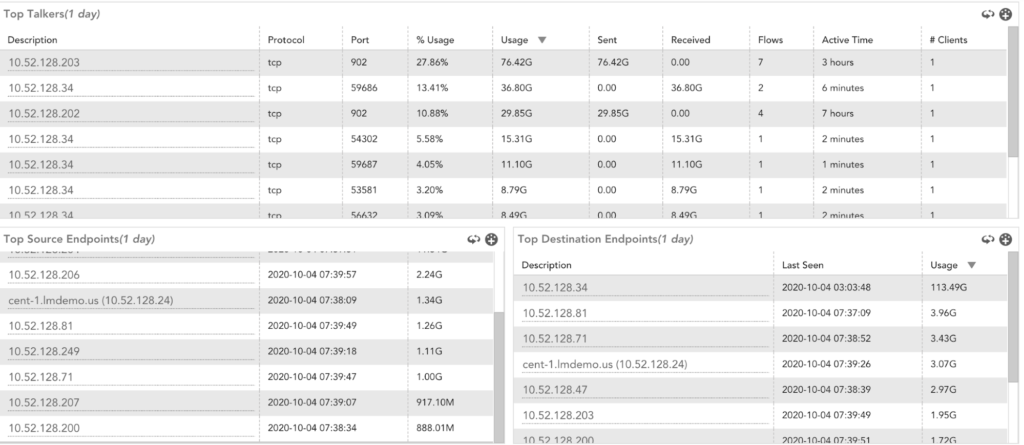
- Consumers of the Bandwidth
Keep track of interface details and statistics of top talkers and users. This can help determine the origin of an issue when it’s reported.

- Bandwidth Hogging
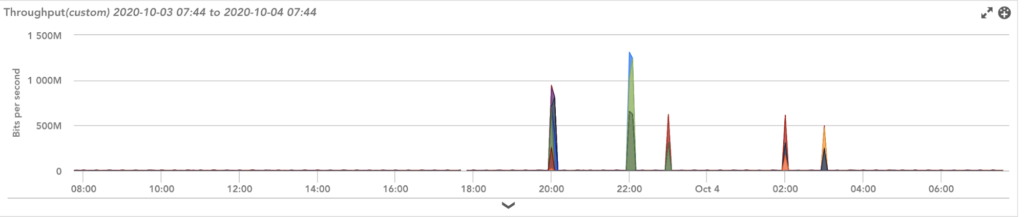
Analyze historical data to examine incident patterns and their impact on total network traffic through the packet and octet count.
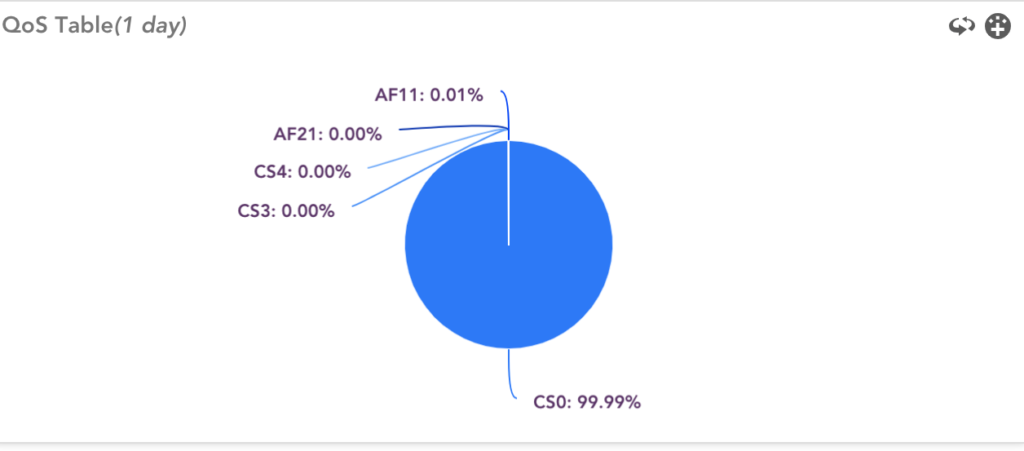
- ToS and QoS Analysis
Using ToS (Type of Service), ensure the right priorities are provided to the right applications. Verify the Quality of Service (QoS) levels achieved to optimize network bandwidth for the specific requirements.
- IPv6 Traffic Monitoring
LogicMonitor’s NetFlow Monitoring provides out-of-the-box support for a mix of IPv4 and IPv6 environments and the flexibility to differentiate TopN flows in each protocol. IPv6 adoption is gaining significant traction in the public sector, large-scale distribution systems, and companies working with IoT infrastructures.
- Applications Classification through NBAR2
Network-Based Application Recognition (NBAR) provides an advanced application classification mechanism using application signatures, databases, and deep packet inspection. Enabling NBAR on specific devices directly within the network accomplishes this.
NetFlow traffic analyzer vs. other network monitoring tools
Each network monitoring tool brings its own strengths to the table, but NetFlow stands out when you need detailed traffic insights. With its ability to capture entire traffic flows, track bandwidth usage, and provide real-time visibility down to the user level, NetFlow is uniquely suited for in-depth network analysis. Here’s how NetFlow stacks up to other common methods:
- SNMP (Simple Network Management Protocol): SNMP is a popular go-to for device monitoring, providing valuable status data, such as device health and connectivity. However, unlike NetFlow, it doesn’t offer the granularity to drill down into specific traffic flows or analyze bandwidth by user or application.
- sFlow: sFlow offers real-time network monitoring similar to NetFlow but samples traffic instead of tracking every packet. This is helpful in high-speed networks with massive data volumes. NetFlow’s detailed traffic records provide a fuller view, making it the preferred choice of many admins and engineers for in-depth traffic analysis.
- Packet sniffers: Packet sniffers, like Wireshark, capture every packet for deep packet inspection and troubleshooting. While packet sniffers are great for precise packet analysis, they’re resource-heavy, less scalable, and lack NetFlow’s high-level summary, making NetFlow better suited for long-term traffic analysis and monitoring.
Choosing the right NetFlow traffic analyzer for your network
A NetFlow traffic analyzer is no place to cut corners. When choosing a traffic analysis tool, consider factors like network size, complexity, and scalability. The right NetFlow analyzer will simplify monitoring, enhance capacity planning, and support a complex network’s performance needs. Keep these features in mind when selecting your traffic analysis tool:
- Scalability: Plan for growth. Select a solution that can keep up as your network expands. For example, LogicMonitor’s NetFlow analyzer supports a range of network sizes while maintaining high performance.
- Integration: Compatibility is key. Choose a tool that integrates smoothly with your existing infrastructure, including network devices, software, and other bandwidth monitoring tools. This ensures better data flow and fewer integration hurdles.
- Ease of use: Sometimes, simplicity is best. An intuitive interface and easy-to-navigate dashboards streamline network management. Look for tools with customizable dashboards, like LogicMonitor, to make data visualization and metric tracking more accessible for your team.
Leveraging historical data from a NetFlow analyzer for trend analysis
A NetFlow analyzer does more than keep tabs on what’s happening right now—it also builds a rich library of historical data that’s invaluable for understanding network patterns over time. Harnessing historical NetFlow data transforms your network management from reactive to proactive, giving your team the foresight to stay ahead of network demands and keep performance steady. Analyzing traffic trends allows you to catch usage shifts, pinpoint recurring bottlenecks, and anticipate future bandwidth needs. Here’s how trend analysis is a game-changer for network management:
- Capacity planning: Historical data better prepares you for growth. Analyzing traffic patterns lets you predict when and where you might need to expand your network, helping you avoid unexpected slowdowns and allocate resources where your system needs them most.
- Issue prevention: Spotting patterns in past issues can reveal weak spots. By identifying trends in packet loss, latency spikes, or high bandwidth usage, your team can address problem areas and prevent potential disruptions.
- Optimizing resource allocation: Historical data helps you understand not only peak usage times but also which applications or users consistently consume a lot of bandwidth. With these insights, you can fine-tune resource allocation to maintain smooth network performance, even as demands evolve.
Customizing LogicMonitor’s NetFlow dashboards for better insights
Personalizing NetFlow dashboards is key to tracking the metrics that matter most to your network. With personalized dashboards and reports, LogicMonitor’s NetFlow capabilities provide a clear view of your network’s performance and use filters to narrow down metrics that impact network reliability. LogicMonitor makes it easy to set up custom views, helping you keep essential data at your fingertips.
- Tailored tracking: Customize dashboards to display specific metrics, such as top talkers, application performance, or interface traffic. Your team can monitor critical elements without sifting through unnecessary information by zeroing in on relevant data.
- Detailed reporting: You can generate reports that match your organization’s needs, from high-level summaries to deep-dive analytics. Custom reports let you focus on trends, performance, and usage patterns—whether you’re managing day-to-day operations or planning for growth.
Threshold alarms and alerts
LogicMonitor’s NetFlow analyzer lets you configure threshold alarms and alerts that enable your team to monitor network performance and detect anomalies in real-time. These alerts immediately flag unusual activity, such as bandwidth spikes or sudden drops in traffic, helping your team react quickly and keep network disruptions at bay. Here are a few ways that threshold alarms and alerts work to enhance monitoring:
- Customizable thresholds: Set individual thresholds for various traffic metrics, including bandwidth usage, latency, or protocol-specific data flows. Customization lets you tailor alerts to align with your network’s normal behavior, so you’re only notified when activity deviates from the expected range.
- Real-time alerts: LogicMonitor’s real-time alerts let you know the moment traffic deviates from set parameters. This instant feedback lets you respond quickly to potential issues, avoiding outages, slowdowns, or security vulnerabilities.
- Incident prioritization: By configuring alerts based on severity levels, you can prioritize responses according to the potential impact. You can set critical alerts to escalate instantly for immediate action, while you can document less urgent instances for review, keeping your team focused where they’re needed most.
- Performance tuning: Use historical data to fine-tune thresholds over time. Analyzing past trends helps optimize threshold settings, minimizing false alarms and improving accuracy for current network conditions.
Common network issues solved by NetFlow traffic analyzers
A NetFlow traffic analyzer is a powerful tool for spotting and resolving common network issues that can slow down or even compromise performance. Here’s a look at some of the most frequent network problems it addresses, along with how NetFlow data supports quick troubleshooting and issue resolution:
Bandwidth hogging
Heavy bandwidth usage, or “bandwidth hogging,” is a common culprit behind slow network speeds. NetFlow lets you see the heaviest bandwidth users, enabling your IT team to track which applications, devices, or users use the most resources. With this information, admins can adjust traffic flow to ensure everyone gets the necessary bandwidth.
Application slowdowns
Slow applications can get in the way of productivity. By analyzing NetFlow data, you can pinpoint the exact source of the slowdown, whether it’s high traffic volume, network latency, or misconfigured settings. With targeted data on hand, your team can quickly address the root cause of lagging applications and restore performance.
Network congestion and bottlenecks
Traffic congestion is especially common during peak usage times. NetFlow data highlights areas of high traffic density, helping admins identify and manage bottlenecks in real-time. By analyzing traffic flows across devices and interfaces, IT teams can reroute traffic or adjust resources to reduce congestion and keep data flowing smoothly.
Security threats and unusual activity
Unexpected traffic patterns can be an early warning sign of security threats, like DDoS attacks or unauthorized access attempts. NetFlow data enables IT teams to monitor and investigate unusual activity as it’s happening. With instant alerts and historical traffic records, teams can quickly detect, analyze, and shut down suspicious behavior before it escalates into a security breach.
Resource misallocation
Sometimes, network issues come down to how resources are allocated. NetFlow helps administrators track traffic by specific protocols or applications, enabling more precise resource distribution. By understanding actual usage patterns, IT can allocate bandwidth and prioritize applications more effectively, ensuring that critical services are always well supported.
In tackling these common network challenges, NetFlow’s data-driven insights let you respond proactively, keeping networks running efficiently and securely while reducing the risk of interruptions.
Take control of your network with NetFlow analysis
NetFlow for your network management is about staying proactive, enhancing performance, and making informed decisions based on real data. A NetFlow traffic analyzer equips your team with the insights they need to keep your networks operating securely and efficiently. With LogicMonitor’s AI-powered, customizable dashboards and threshold alerts, you’re fully prepared to track bandwidth usage, detect anomalies, and get ahead of issues before they impact the user experience.
At LogicMonitor, we manage vast quantities of time series data, processing billions of metrics, events, and configurations daily. As part of our transition from a monolithic architecture to microservices, we chose Quarkus—a Kubernetes-native Java stack—for its efficiency and scalability. Built with the best-of-breed Java libraries and standards, Quarkus is designed to work seamlessly with OpenJDK HotSpot and GraalVM.
To monitor our microservices effectively, we integrated Micrometer, a vendor-agnostic metrics instrumentation library for JVM-based applications. Micrometer simplifies the collection of both JVM and custom metrics, helping maximize portability and streamline performance monitoring across our services.
In this guide, we’ll show you how to integrate Quarkus with Micrometer metrics, offering practical steps, code examples, and best practices. Whether you’re troubleshooting performance issues or evaluating these tools for your architecture, this article will help you set up effective microservice monitoring.
How Quarkus and Micrometer work together
Quarkus offers a dedicated extension that simplifies the integration of Micrometer, making it easier to collect both JVM and custom metrics. This extension allows you to quickly expose application metrics through representational state transfer (REST) endpoints, enabling real-time monitoring of everything from Java Virtual Machine (JVM) performance to specific microservice metrics. By streamlining this process, Quarkus and Micrometer work hand-in-hand to deliver a powerful solution for monitoring microservices with minimal setup.
// gradle dependency for the Quarkus Micrometer extension
implementation 'io.quarkus:quarkus-micrometer:1.11.0.Final'
// gradle dependency for an in-memory registry designed to operate on a pull model
implementation 'io.micrometer:micrometer-registry-prometheus:1.6.3'
What are the two major KPIs of our metrics processing pipeline?
For our metrics processing pipeline, our two major KPIs (Key Performance Indicators) are the number of processed messages and the latency of the whole pipeline across multiple microservices.
We are interested in the number of processed messages over time in order to detect anomalies in the expected workload of the application. Our workload is variable across time but normally follows predictable patterns. This allows us to detect greater than expected load, react accordingly, and proactively detect potential data collection issues.
In addition to the data volume, we are interested in the pipeline latency. This metric is measured for all messages from the first ingestion time to being fully processed. This metric allows us to monitor the health of the pipeline as a whole in conjunction with microservice-specific metrics. It includes the time spent in transit in Kafka clusters between our different microservices. Because we monitor the total processing duration for each message, we can report and alert on average processing time and different percentile values like p50, p95, and p999. This can help detect when one or multiple nodes in a microservice along the pipeline are unhealthy. The average processing duration across all messages might not change much, but the high percentile (p99, p999) will increase, indicating a localized issue.
In addition to our KPIs, Micrometer exposes JVM metrics that can be used for normal application monitoring, such as memory usage, CPU usage, garbage collection, and more.
Using Micrometer annotations
Two dependencies are required to use Micrometer within Quarkus: the Quarkus Micrometer dependency and Micrometer Registry Prometheus. Quarkus Micrometer provides the interfaces and classes needed to instrument codes, and Micrometer Registry Prometheus is an in-memory registry that exposes metrics easily with rest endpoints. Those two dependencies are combined into one extension, starting with Quarkus 1.11.0.Final.
Micrometer annotations in Quarkus produce a simple method to track metric names across different methods. Two key annotations are:
- @Timed: Measures the time a method takes to execute.
- @Counted: Tracks how often a method is called.
This, however, is limited to methods in a single microservice.
@Timed(
   value = "processMessage",
   description = "How long it takes to process a message"
)
public void processMessage(String message) {
   // Process the message
}
It is also possible to programmatically create and provide values for Timer metrics. This is helpful when you want to instrument a duration, but want to provide individual measurements. We are using this method to track the KPIs for our microservice pipeline. We attach the ingestion timestamp as a Kafka header to each message and can track the time spent throughout the pipeline.
@ApplicationScoped
public class Processor {

   private MeterRegistry registry;
   private Timer timer;

   // Quarkus injects the MeterRegistry
   public Processor(MeterRegistry registry) {
       this.registry = registry;
       timer = Timer.builder("pipelineLatency")
           .description("The latency of the whole pipeline.")
           .publishPercentiles(0.5, 0.75, 0.95, 0.98, 0.99, 0.999)
           .percentilePrecision(3)
           .distributionStatisticExpiry(Duration.ofMinutes(5))
           .register(registry);
   }

   public void processMessage(ConsumerRecord<String, String> message) {
       /*
           Do message processing
        */
       // Retrieve the kafka header
       Optional.ofNullable(message.headers().lastHeader("pipelineIngestionTimestamp"))
           // Get the value of the header
           .map(Header::value)
           // Read the bytes as String
           .map(v -> new String(v, StandardCharsets.UTF_8))
           // Parse as long epoch in millisecond
           .map(v -> {
               try {
                   return Long.parseLong(v);
               } catch (NumberFormatException e) {
                   // The header can't be parsed as a Long
                   return null;
               }
           })
           // Calculate the duration between the start and now
           // If there is a discrepancy in the clocks the calculated
           // duration might be less than 0. Those will be dropped by MicroMeter
           .map(t -> System.currentTimeMillis() - t)
           .ifPresent(d -> timer.record(d, TimeUnit.MILLISECONDS));
   }
}
The timer metric with aggregation can then be retrieved via the REST endpoint at https://quarkusHostname/metrics.
# HELP pipelineLatency_seconds The latency of the whole pipeline.
# TYPE pipelineLatency_seconds summary
pipelineLatency_seconds{quantile="0.5",} 0.271055872
pipelineLatency_seconds{quantile="0.75",} 0.386137088
pipelineLatency_seconds{quantile="0.95",} 0.483130368
pipelineLatency_seconds{quantile="0.98",} 0.48915968
pipelineLatency_seconds{quantile="0.99",} 0.494140416
pipelineLatency_seconds{quantile="0.999",} 0.498072576
pipelineLatency_seconds_count 168.0
pipelineLatency_seconds_sum 42.581
# HELP pipelineLatency_seconds_max The latency of the whole pipeline.
# TYPE pipelineLatency_seconds_max gauge
pipelineLatency_seconds_max 0.498
We then ingest those metrics in LogicMonitor as DataPoints using collectors.
Step-by-step setup for Quarkus Micrometer
To integrate Micrometer with Quarkus for seamless microservice monitoring, follow these steps:
1. Add Dependencies: Add the required Micrometer and Quarkus dependencies to enable metrics collection and reporting for your microservices.
gradle
Copy code
implementation 'io.quarkus:quarkus-micrometer:1.11.0.Final'
implementation 'io.micrometer:micrometer-registry-prometheus:1.6.3'2. Enable REST endpoint: Configure Micrometer to expose metrics via a REST endpoint, such as /metrics.
3. Use annotations for metrics: Apply Micrometer annotations like @Timed and @Counted to the methods where metrics need to be tracked.
4. Set up a registry: Use Prometheus as a registry to pull metrics from Quarkus via Micrometer. Here’s an example of how to set up a timer:
java
Copy code
Timer timer = Timer.builder("pipelineLatency")
.description("Latency of the pipeline") .publishPercentiles(0.5, 0.75, 0.95, 0.98, 0.99, 0.999) .register(registry);5. Monitor via the endpoint: After setup, retrieve and monitor metrics through the designated REST endpoint:
urlCopy codehttps://quarkusHostname/metricsPractical use cases for using Micrometer in Quarkus
Quarkus and Micrometer offer a strong foundation for monitoring microservices, providing valuable insights for optimizing their performance. Here are some practical applications:
- Latency tracking: Use Micrometer to measure the time it takes for messages to move through your microservice pipeline. This helps identify bottlenecks and improve processing efficiency.
- Anomaly detection: By continuously analyzing metrics over time, you can detect unusual patterns in message processing rates or spikes in system latency, letting you address issues before they impact performance.
- Resource monitoring: Track JVM metrics like memory usage and CPU consumption to optimize resource allocation and ensure your services run smoothly.
- Custom KPIs: Tailor metrics to your specific business objectives, such as message processing speed or response times, allowing you to track key performance indicators that matter most to your organization.
LogicMonitor microservice technology stack
LogicMonitor’s Metric Pipeline, where we built out multiple microservices with Quarkus in our environment, is deployed on the following technology stack:
- Java 11 (corretto, cuz licenses)
- Kafka (managed in AWS MSK)
- Kubernetes
- Nginx (ingress controller within Kubernetes)

How do we correlate configuration changes to metrics?
Once those metrics are ingested in LogicMonitor, they can be displayed as graphs or integrated into dashboards. They can also be used for alerting and anomaly detections, and in conjunction with ops notes, they can be visualized in relation to infrastructure or configuration changes, as well as other significant events.
Below is an example of an increase in processing duration correlated to deploying a new version. Deploying a new version automatically triggers an ops note that can then be displayed on graphs and dashboards. In this example, this functionality facilitates the correlation between latency increase and service deployment.

Tips for efficient metrics collection and optimizing performance
To get the most out of Quarkus and Micrometer, follow these best practices for efficient metrics collection:
- Focus on Key Metrics: Track the metrics that directly impact your application’s performance, such as latency, throughput, and resource usage. This helps you monitor critical areas that influence your overall system health.
- Use Percentile Data: Analyzing percentile values like p95 and p99 allows you to spot outliers and bottlenecks more effectively than relying on averages. This gives you deeper insights into performance anomalies.
- Monitor Custom Metrics: Customize the metrics you collect to match your application’s specific needs. Don’t limit yourself to default metrics. Tracking specific business-critical metrics will give you more actionable data.
How to Track Anomalies
All of our microservices are monitored with LogicMonitor. Here’s an example of Anomaly Detection for the pipeline latencies 95 percentile. LogicMonitor dynamically figures out the normal operating values and creates a band of expected values. It’s then possible to define alerts when values fall outside the generated band.

As seen above, the integration of MicroMeter with Quarkus allows in conjunction with LogicMonitor a straightforward, easy, and quick way to add visibility into our microservices. This ensures that our processing pipeline provides the most value to our clients while minimizing the monitoring effort for our engineers, reducing cost, and increasing productivity.
Quarkus With Micrometer: Unlock the Power of Real-Time Insights
Integrating Micrometer with Quarkus empowers real-time visibility into the performance of your microservices with minimal effort. Whether you’re monitoring latency, tracking custom KPIs, or optimizing resource usage, this streamlined approach simplifies metrics collection and enhances operational efficiency.
Leverage the combined strengths of Quarkus and Micrometer to proactively address performance issues, improve scalability, and ensure your services are running at peak efficiency.
FAQs
How does Micrometer work with Quarkus?
Micrometer integrates seamlessly with Quarkus by providing a vendor-neutral interface for collecting and exposing metrics. Quarkus offers an extension that simplifies the integration, allowing users to track JVM and custom metrics via annotations like @Timed and @Counted and expose them through a REST endpoint.
What are the benefits of using Micrometer in a microservice architecture?
Using Micrometer in a microservice architecture provides observability, real-time visibility into the performance of individual services, helping detect anomalies, track latency, and monitor resource usage. It supports integration with popular monitoring systems like Prometheus, enabling efficient metrics collection and analysis across microservices, improving scalability and reliability.
How do you set up Micrometer metrics in Quarkus?
To set up Micrometer metrics in Quarkus, add the necessary dependencies (quarkus-micrometer and a registry like micrometer-registry-prometheus). Enable metrics exposure via a REST endpoint, apply annotations like @Timed to track specific metrics, and configure a registry (e.g., Prometheus) to pull and monitor the metrics.
What are common issues when integrating Micrometer with Quarkus, and how can they be resolved?
Common issues include misconfigured dependencies, failure to expose the metrics endpoint, and incorrect use of annotations. These can be resolved by ensuring that the proper dependencies are included, that the REST endpoint for metrics is correctly configured, and that annotations like @Timed and @Counted are applied to the correct methods.
How do I monitor a Quarkus microservice with Micrometer?
To monitor a Quarkus microservice with Micrometer, add the Micrometer and Prometheus dependencies, configure Micrometer to expose metrics via a REST endpoint, and use annotations like @Timed to track important performance metrics. You can then pull these metrics into a monitoring system like Prometheus or LogicMonitor for visualization and alerting.
Managing observability across hybrid and multi-cloud environments is like flying a fleet of planes, each with different routes, altitudes, and destinations. You’re not just piloting a single aircraft; you’re coordinating across multiple clouds, on-premises systems, and services while ensuring performance, availability, and cost-efficiency. AWS customers, in particular, face challenges with workloads spanning multiple regions, data centers, and cloud providers. Having a unified observability platform that provides visibility across every layer is critical.
This is where LogicMonitor Envision excels. Its ability to seamlessly integrate observability across AWS, Azure, Google Cloud, and on-premises systems gives customers a comprehensive view of real-time performance metrics and logs, such as EC2 CPU utilization or Amazon RDS database logs. Additionally, LM Envision delivers visibility before, during, and after cloud migrations—whether you’re rehosting or replatforming workloads.
Let’s dive into how LogicMonitor makes managing these complex environments easier, focusing on features like Active Discovery, unified dashboards, and Cost Optimization.
The challenge of hybrid and multi-cloud: Coordinating your fleet across complex skies
Hybrid and multi-cloud environments are like managing multiple aircraft, each with its own systems and control panels. AWS workloads, on-prem servers, and Azure or Google Cloud applications have their own monitoring tools and APIs, creating silos that limit visibility. Without a unified observability platform, you’re flying blind, constantly reacting to issues rather than proactively managing your fleet.
Working at LogicMonitor, I’ve seen many customers struggle to manage hybrid environments. One customer managed 10,000 assets across multiple regions and cloud providers, using separate monitoring tools for AWS, on-prem, and their private cloud. They described it as “trying to control each plane separately without an overall view of the airspace.” (The analogy that inspired this blog!) This led to constant reactive management. By switching to LM Envision, they eliminated blind spots and gained complete visibility across their entire infrastructure, shifting to proactive management—the dream for ITOps teams everywhere.
Active Discovery: The radar system for automatically detecting new resources
Think of your infrastructure as an expanding airport. New terminals (services), planes (instances), and runways (connections) are constantly being added or modified. Manually tracking these changes is like trying to direct planes without radar. LM Envision simplifies this by automatically discovering AWS resources, on-prem data center infrastructure, and other cloud providers like Azure and Google Cloud. This visibility provides a comprehensive real-time view across services like Amazon EC2, AWS Lambda, and Amazon RDS.
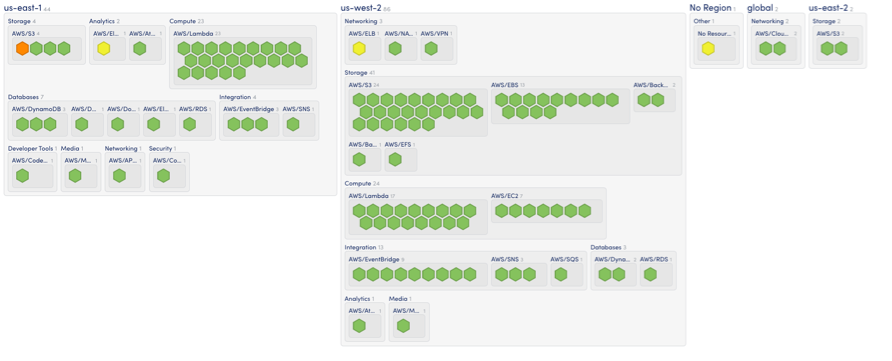
Now, think of LM Envision’s Active Discovery as the radar system that continually updates as new planes enter your airspace. For example, when you’re spinning up new AWS EC2 instances for a major campaign, you don’t have to worry about manually adding those instances to your monitoring setup. LM Envision automatically detects them, gathers performance metrics, and sends real-time alerts. It’s like flying a plane—LM Envision is the instrument panel, providing instant feedback so you can make quick decisions. You’ll always have a clear view of performance, allowing you to react immediately and prevent potential outages, ensuring smooth operations from takeoff to landing.
Unified dashboards: The control tower for complete IT visibility
In any complex environment, especially hybrid or multi-cloud setups, visibility is key. LM Envision’s unified dashboards act like the control tower for your fleet, offering a single pane of glass across AWS, on-premises systems, Azure, and Google Cloud. These customizable dashboards allow you to track key performance metrics such as CPU utilization, database performance, and network latency across all your environments.
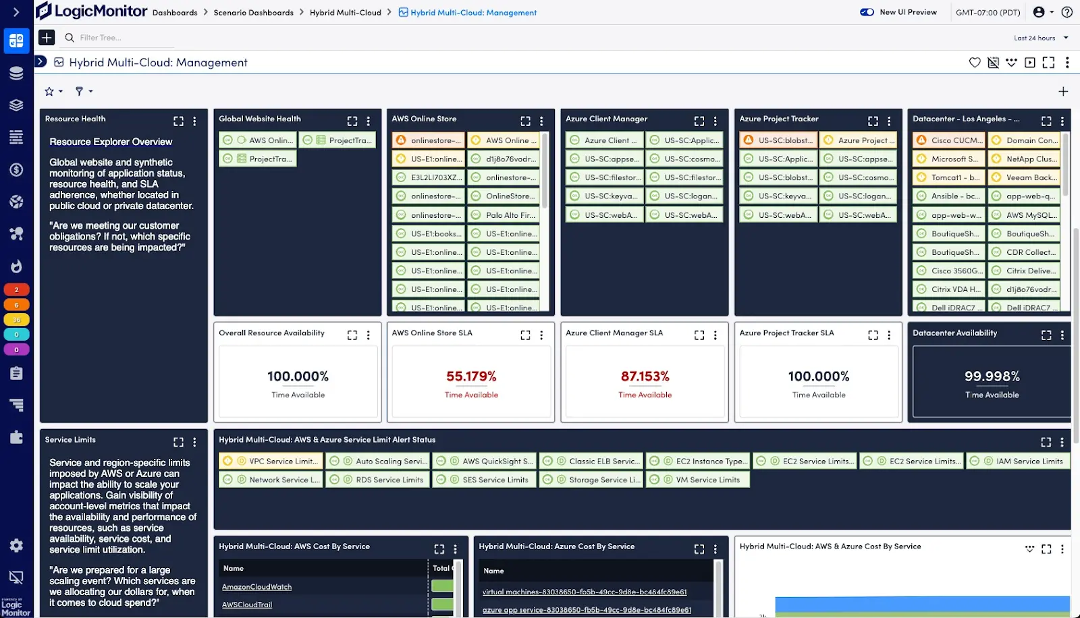
Think of these dashboards as your control tower. In a large airport, planes constantly land, take off, or taxi, and the control tower ensures everything runs smoothly. With LM Envision’s dashboards, you can monitor the health of your entire infrastructure in real time, from AWS EC2 instances to on-prem database health.
I’ve seen first-hand how these dashboards can transform operations. In one case, application latency spiked across multiple regions, but a customer’s traditional monitoring tools were siloed. They couldn’t easily tell if it was a network issue, a load balancer problem, or an AWS region failure. Once they implemented LM Envision, they built custom dashboards that provided insights into each layer of their stack, from the application down to the server and network level. When this issue happened again, within minutes, they isolated the root cause to an AWS load balancer misconfiguration in one region, drastically cutting troubleshooting time.
Cost optimization: The fuel gauge for efficient cloud spending
Managing costs in multi-cloud environments is like monitoring fuel consumption on long-haul flights—small inefficiencies can lead to massive overruns. AWS and Azure bills can quickly spiral out of control without proper visibility. LM Envision’s Cost Optimization tools, powered by Amazon QuickSight Embedded, provide a real-time view of your cloud spending. These dashboards enable you to identify idle EC2 instances, unattached EBS volumes, and other underutilized resources, ensuring you’re not wasting capacity.
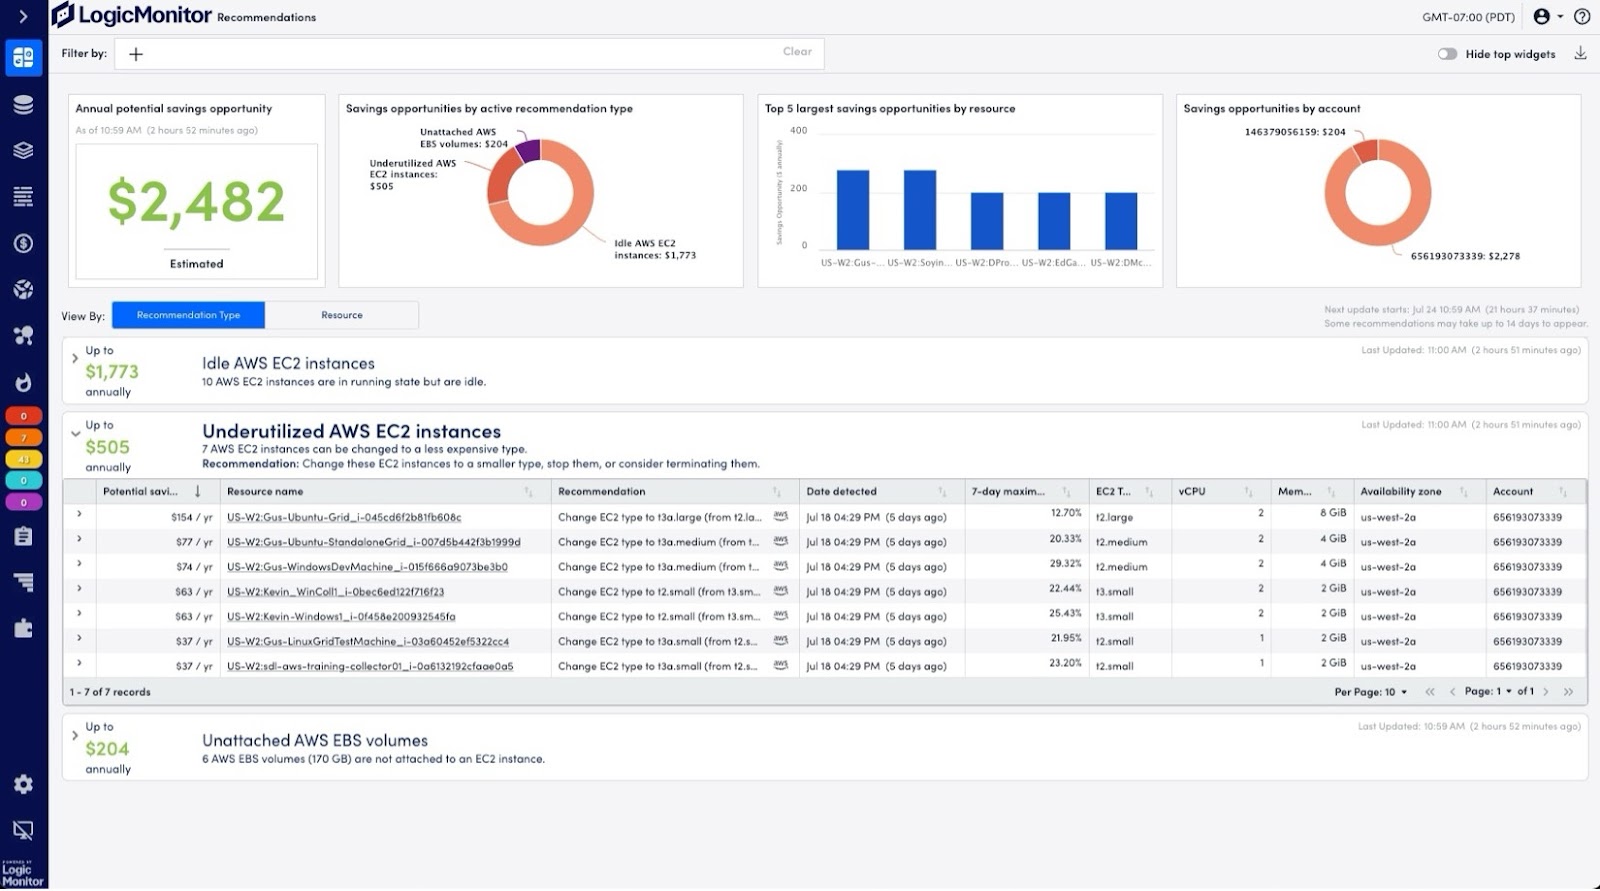
LogicModules—with over 3,000 pre-configured integrations for technologies such as HPE, Cisco, NetApp, and AWS services—help monitor your infrastructure for the latest efficiencies. This allows you to right-size your cloud infrastructure based on real-time usage data.
In fact, a customer identified thousands of dollars in savings by using LM Envision’s cost forecasting tools, which provided actionable insights into resource usage. It’s like ensuring your planes fly with just the right amount of fuel and optimizing their routes to avoid costly detours.
Monitoring cloud migrations: Navigating turbulence with real-time insights
Cloud migrations can feel like flying through turbulence—downtime, cost overruns, and performance degradation are some common challenges. With LM Envision, you can monitor each step of the migration process, whether you’re rehosting or replatforming workloads to AWS.
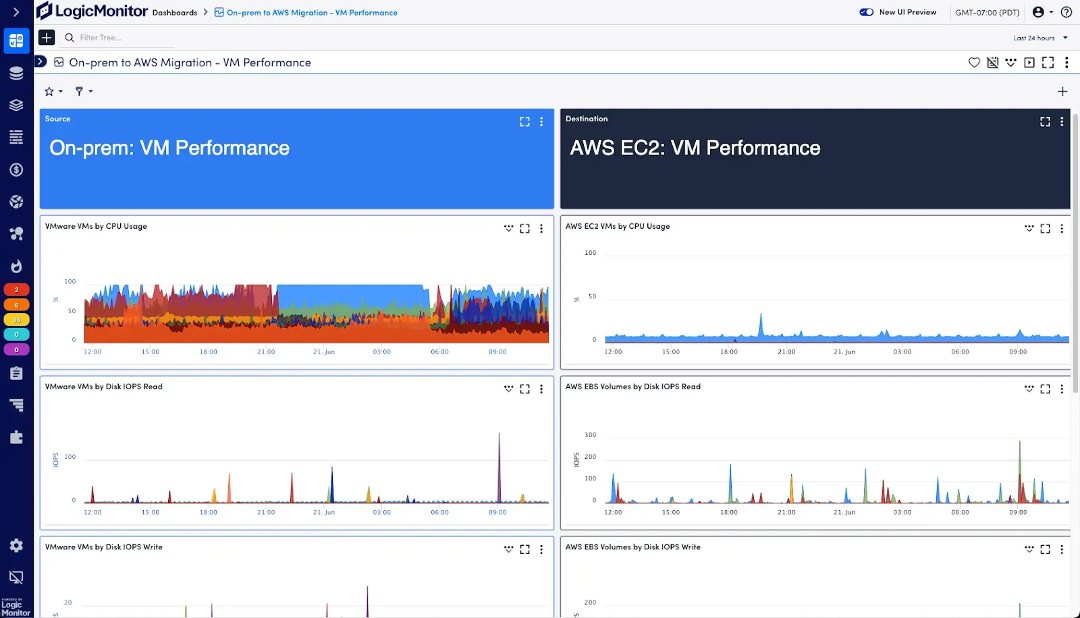
I’ve seen multiple cloud migrations where resource usage spiked unpredictably. In one migration to AWS, a customer saw sudden increases in EC2 CPU usage due to unexpected workloads. LM Envision allowed them to monitor the migration in real-time and adjust instance types accordingly, avoiding major downtime. The system’s real-time alerts during migration help you navigate smoothly, much like flight instruments helping pilots adjust their routes during turbulence.
Wrapping up
Managing hybrid and multi-cloud environments is now the standard, and effective management requires an observability platform that scales with your infrastructure. LM Envision not only provides real-time visibility and cost optimization but also reduces complexity, making it easier for IT teams to manage distributed workloads proactively.
With LM Envision, you transition from being a reactive firefighter to a skilled pilot managing your fleet from the control tower. It ensures you keep your operations running smoothly, whether monitoring performance, scaling your infrastructure, or optimizing costs.
In today’s complex IT environments, logs are the unsung heroes of infrastructure management. They hold a wealth of information that can mean the difference between reactive firefighting and proactive performance tuning.
What is log analysis?
Log analysis is a process in modern IT and security environments that involves collecting, processing, and interpreting log information generated by computer systems. These systems include the various applications and devices on a business network.
From security breaches to system performance optimization, log analysis is indispensable for IT operations and security teams alike. However, understanding how to efficiently leverage this wealth of data is no small feat.
Based on my decades of experience managing IT environments, I’ve seen firsthand the critical role of effective log analysis in maintaining system health, security, and compliance. Over the years, this discipline has evolved—from manual log parsing in the early days to today’s AI-powered insights that help teams manage vast amounts of data in real-time.
In this guide, I’ll walk you through core log analysis concepts, share advanced techniques, and provide real-world insights to help you understand how to extract actionable information from your logs.
Core concepts of log analysis
At its essence, log analysis is a step-by-step process that involves collecting data from various devices and ingesting it into monitoring applications for review.
You can break it down into several steps:
Data collection
Effective log analysis begins with collecting data from various sources like servers, applications, and network devices. This process is often underestimated, but it’s the foundation for everything that follows. One common pitfall I’ve seen is missing log sources, leading to incomplete analyses and delayed troubleshooting.
I once missed a critical log source in a third-party vendor’s server, which delayed our root cause analysis by hours. After adding that missing source, we finally pinpointed the issue—a simple configuration error that could have been caught earlier with proper log collection.
By ensuring complete coverage of all devices and systems, you can prevent major issues from going undetected, simplifying later steps in the process.
PRO TIP
Configure all data sources properly to avoid gaps in your log data.
Data processing
Once logs are collected, the next challenge is processing them effectively. Raw logs contain a lot of noise—irrelevant data that can cloud your analysis. In my experience, indexing and normalizing logs is crucial for reducing this noise and ensuring you can focus on the actionable data.
Many teams make the mistake of assuming they can get away with analyzing raw logs. Unstructured logs often lead to information overload, making it hard to extract meaningful insights. Structuring your data through normalization makes things far easier, allowing you to search, analyze, and correlate events across your systems more easily.
Data analysis
Now comes the part that used to be the most time-consuming—analyzing the logs. In the past, IT teams would spend hours manually combing through logs, looking for patterns. However, this approach is neither practical nor scalable in today’s complex hybrid environments. Tools that leverage AI and machine learning have become essential in detecting patterns and anomalies in real-time, significantly improving troubleshooting and incident detection efficiency.
I remember an incident where AI flagged a series of login attempts across multiple devices. It appeared normal on the surface, but on closer inspection, these were part of a coordinated brute force attack. Without AI’s pattern recognition abilities, this might have slipped through the cracks. The takeaway here is that manual log analysis is outdated. AI-powered tools are essential to keep up with the volume and complexity of modern IT environments.
Data visualization
Log data is only valuable if you can quickly interpret it, which is why visualization is crucial. Dashboards and reports help surface trends and anomalies, helping your team make quicker decisions with a real-time system health and performance overview.
I’ve seen poorly designed dashboards cost teams hours—if not days—of productivity. One time, I was dealing with performance issues, but our dashboard wasn’t set up to visualize the right metrics. It took hours to isolate the problem. After redesigning the dashboard to prioritize key performance indicators (KPIs), we identified issues in minutes. The right visualization tools make the difference between proactive monitoring and reactive firefighting.
PRO TIP
Executives appreciate dashboards that help them understand what they care about most in one quick-to-digest view.
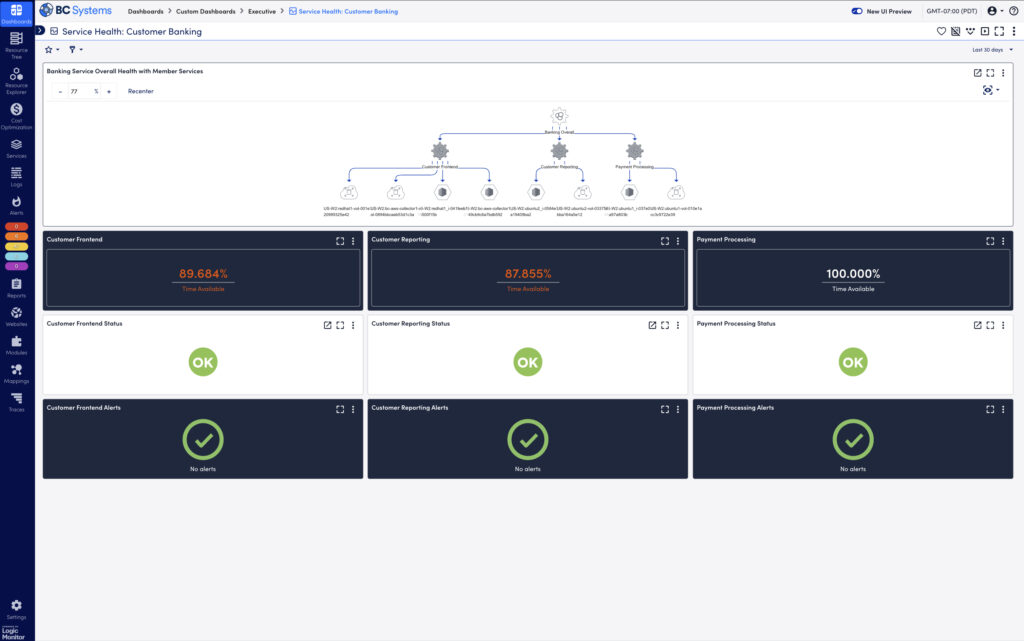
What is log file analysis?
Log file analysis involves examining logs generated by IT systems to understand events, detect issues, and monitor performance. This step is critical in maintaining a healthy IT infrastructure. Proper log parsing can reveal invaluable insights about what’s happening under the hood, whether you’re troubleshooting or investigating security incidents.
In my experience, the biggest challenge is often dealing with unstructured log files. We already discussed how overwhelming raw logs can be, and finding a single root cause can feel like searching for a needle in a haystack. Here’s where techniques like parsing, filtering, and time-based analysis come into play:
- Parsing: This breaks down log files into structured data fields, making categorizing and understanding events easier. For example, during a major outage, we used log parsing to quickly identify misconfigurations in a load balancer, which helped resolve the issue in minutes rather than hours.
- Filtering: Effective log filtering isolates relevant log entries, helping you narrow your focus. I recall a scenario where we filtered out hundreds of benign logs to zero in on suspicious activity linked to unauthorized access attempts.
- Pattern matching: Recognizing recurring patterns in log files is crucial for detecting repeated failures or malicious activity. For example, we once identified a repeated log entry pattern that pointed to intermittent system crashes caused by a faulty update.
- Time-based analysis: This technique examines log entries within specific time frames to understand event sequences and dependencies. In one incident, we used time-based analysis to trace a system outage back to scheduled network maintenance that conflicted with other critical processes. By analyzing logs in the hours leading up to the issue, we discovered that overlapping changes caused a cascade of failures. This approach is especially useful for troubleshooting complex incidents where timing plays a key role.
These techniques allow you to break complex, individual files into manageable components to structure data, quickly sort it, and surface relevant information. They also structure data to allow it to be imported into a central server, helping you gain a bird’s-eye view of a computer network and its individual components from a central location.
PRO TIP
A centralized monitoring solution streamlines log analysis by aggregating logs from multiple sources, applying filters and analysis techniques to surface relevant information faster. This reduces team overhead and response times, while enabling advanced features like cross-system correlation, simplifying the resolution of complex issues.
What is security log analysis?
Security log analysis is a specialized form of log analysis that your security team can use to examine logs to mitigate security threats. With cybersecurity now a top priority for organizations, effective log analysis has become a critical component of a robust security posture. From my experience, analyzing security logs effectively requires more than just looking for unusual activity—it’s about correlating events across different log sources. Here’s how security log analysis can help:
- Detect unauthorized access: Monitoring logs for failed login attempts, suspicious IP addresses, and privilege escalations can help identify malicious activities. I’ve seen how correlating these seemingly isolated events can reveal larger coordinated attacks.
- Investigate security breaches: When a breach occurs, log analysis plays a pivotal role in understanding what went wrong. In one case, analyzing logs helped us trace back a data exfiltration event to a compromised user account, allowing us to mitigate the damage.
- Real-time threat detection: Advanced security log analysis tools leverage AI and machine learning to detect anomalous behavior automatically. For instance, we once identified malware attempting lateral movement in our network thanks to real-time anomaly detection. Without this, the malware could have spread unnoticed.
- Compliance monitoring: In regulated industries (e.g., healthcare, finance), security log analysis helps ensure compliance with frameworks like GDPR, HIPAA, and PCI DSS by maintaining thorough audit logs and generating compliance reports. In my experience, failing to configure security logging properly is a common mistake that can lead to compliance violations.
Integrating log analysis with Security Information and Event Management (SIEM) tools, which automate threat detection and correlate events across the network, is essential to reduce response times and improve overall security posture.
What is event and network log analysis?
Both event and network logs are critical for understanding system health, application behavior, and network traffic flow. Event logs come from individual devices and detail what happens on the systems and any errors. Network logs look at network devices (such as switches, modems, and hardware firewalls) and help network engineers understand traffic flow.
Analyzing these logs can help IT teams ensure system reliability and network performance while preempting potential issues.
Event log analysis
Event logs provide detailed information about system events and application behavior. These logs are invaluable when it comes to:
- Troubleshooting application errors: Event logs are the first place I look when diagnosing application failures. For instance, when an internal CRM system crashed intermittently, the event log helped us pinpoint a memory leak causing the issue.
- Monitoring system health: By regularly analyzing event logs, IT teams can identify issues before they lead to system outages. I’ve used this to detect disk failures in advance, allowing us to replace faulty hardware without downtime.
- Tracking user activity: Event logs can track user activity, including authorization events. This helps ensure that only authorized personnel access critical systems, adding an extra layer of security.
Network log analysis
On the other hand, network log analysis focuses on network devices like routers, switches, and firewalls, helping you understand traffic flow and network health:
- Network performance: In my experience, analyzing network logs is essential for spotting bandwidth issues or network bottlenecks. For example, network logs helped us detect and troubleshoot a bandwidth hog disrupting our video conferencing services.
- Detecting network anomalies: Network logs can reveal unusual traffic patterns or suspicious connections. A few years ago, a spike in network traffic during off-hours prompted us to investigate. Network logs confirmed data exfiltration attempts, allowing us to take immediate action.
- Connectivity issues: Network logs provide crucial insights when diagnosing connectivity problems. They can help you verify whether issues are caused by misconfigured devices, ISP problems, or internal hardware failures.
CONSIDER THIS SCENARIO
You’ve just implemented a routine firmware update on your firewall, and suddenly, your network connectivity starts behaving erratically. It’s a situation that can quickly escalate from a minor inconvenience to a major problem affecting your entire organization.
In these moments, network logs become an invaluable troubleshooting resource. They act as a detailed record of your network’s behavior, offering crucial insights into the root cause of the problem. Here’s what to look for:
TIMING CORRELATION:
Your logs will pinpoint exactly when the issues began, often aligning perfectly with the update’s timestamp.
ERROR MESSAGES:
Keep an eye out for specific error codes related to the new firmware. These can indicate compatibility issues or problems with the update itself.
TRAFFIC ANOMALIES:
Unusual patterns in packet handling or connection resets can signal that your firewall isn’t processing traffic correctly post-update.
CONFIGURATION CHANGES:
Sometimes, updates can inadvertently alter firewall rules. Your logs might reveal these unexpected changes.
PERFORMANCE METRICS:
Sudden spikes in CPU usage or memory consumption on the firewall can indicate that the new firmware is causing resource issues.
By carefully analyzing these log entries, you can quickly identify whether the firmware update is the culprit and take appropriate action. This might involve rolling back to a previous version or applying additional patches to resolve the issue.
Combining network and event log analysis gives a comprehensive overview of your IT environment, helping you maintain end-to-end visibility across both systems and networks. This integrated approach is particularly useful when investigating complex issues, as it lets you see how events in one system may affect network performance and vice versa.
Advanced techniques in log analysis
While basic log analysis can provide immediate insights, the real value comes from using advanced techniques to uncover patterns, correlations, and trends.
Pattern recognition and anomaly detection
Pattern recognition goes beyond manual analysis by using tools to analyze log files—whether individual log files or network logs—to find patterns. It uses machine learning (ML) and statistical algorithms to establish a baseline for “normal” behavior across your systems. Comparing new log entries against this baseline through tools like ML can detect anomalies that might indicate a security breach, performance issue, or other critical event. I’ve found that implementing these tools has significantly reduced false positives, allowing teams to focus on real threats rather than sifting through noise.
For instance, pattern recognition once helped my team identify a recurring issue in a distributed application. We could predict system crashes hours before they occurred, enabling us to implement preventative measures and avoid costly downtime.
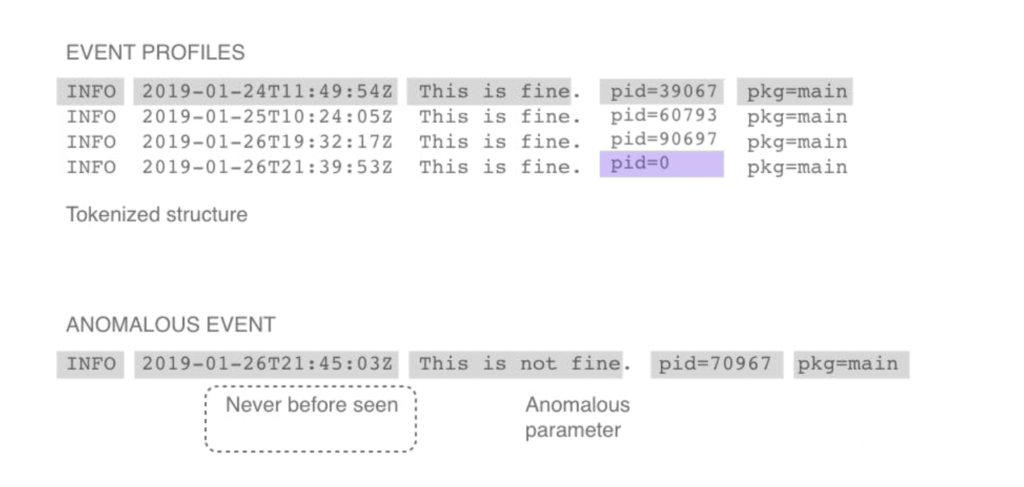
Correlation and event linking
Correlation and event linking work by connecting log events across different sources, helping you to piece together the full scope of incidents. For example, a single failed login might not raise alarms, but it could indicate an attempted breach when it’s correlated with similar events across multiple devices. This technique helps teams track the path of attacks and identify the root cause of complex issues.
In one memorable case, event correlation allowed us to stop a malware infection before it spread to critical systems. Multiple unrelated log events pointed to what seemed like minor issues, but once correlated, they revealed the early stages of a significant security incident.
Visualization and dashboards
When dealing with tens of thousands of log events, it’s easy to miss the bigger picture. Data visualization tools can help you spot trends, anomalies, and potential issues in real-time. For example, using a historical performance graph, I’ve been able to visually track performance metrics over time, which was critical in pinpointing an issue. We noticed that performance would degrade noticeably every day at a specific time. This led us to investigate correlated events in the logs, revealing a recurring resource contention issue with a background task that coincided with peak user activity. Without these visualizations, that pattern might have gone unnoticed.
Well-configured dashboards allow for faster incident response and allow both technical teams and executives to make informed decisions based on real-time insights. This empowers informed decision-making for proactive system maintenance or strategic infrastructure planning.
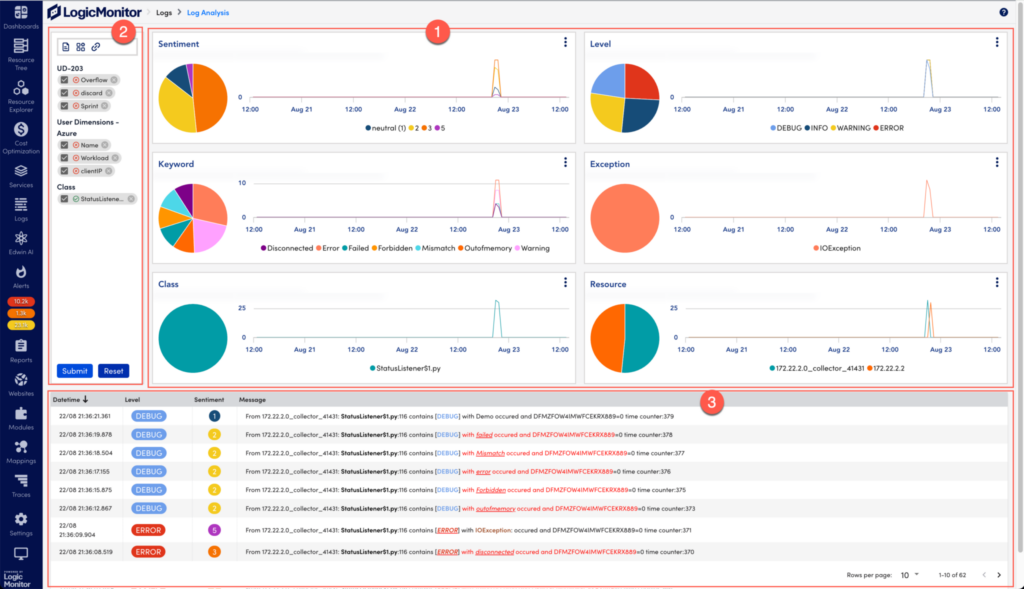
Common challenges in log analysis
While the benefits of log analysis are clear, there are also significant challenges to overcome.
Data volume and complexity
The sheer volume and variety of data collected with logs—especially in large enterprises—can be overwhelming.
A few things I recommend are:
- Implement efficient log aggregation and storage solutions to ensure only actionable information surfaces
- Use scalable platforms to avoid storage problems, lost data, and proper log retention
- Use intelligent filtering and prioritization techniques to help you find the necessary information
Focus on what’s critical first so you’re not drowning in unnecessary data.
PRO TIP
Ensure redundancy in log management by implementing backup strategies with both on-premises and cloud systems. This protects against data loss, supports compliance, and guarantees audit trails and log accessibility during storage failures.
False positives and real-time analytics
Another challenge is false positives. I’ve seen teams waste time chasing down harmless events because of poorly tuned alerting systems. Your team can address this challenge in a few ways:
- Fine-tune alerting thresholds and rules to surface the most relevant information. In one instance, after tuning our alert thresholds and adjusting the conditions under which alerts were triggered, we reduced false positives by over 50%. By narrowing down the scope of what triggered alerts, we were able to filter out events that were normal system behaviors and focus on genuinely anomalous activity.
- Use machine learning algorithms with monitoring software to help isolate the most relevant alerts. These algorithms help isolate the most relevant alerts by learning what normal operational patterns look like over time. In one case, after implementing machine learning-based monitoring, we saw a 60-70% reduction in false positives, as the system became better at recognizing typical behavior and flagging only outlier events.
- Use context-aware analysis to improve alert accuracy. For example, a CPU spike might trigger an alert, but context-aware analysis could recognize that the spike coincided with a scheduled batch job, preventing an unnecessary alert. With this method, we managed to trim down our false positive rate even further, leading to a more streamlined and effective incident response process.
Alerting mechanisms
Getting alerting mechanisms to produce the most relevant alerts can be challenging in complex logging environments. The process involves thinking about the most critical information, isolating it, and surfacing it above irrelevant data.
Some solutions are to:
- Prioritize alerts based on severity and impact to ensure that your team is responding to the most critical issues first
- Implement automated response workflows based on the severity of events, allowing for quicker resolution of common, low-severity incidents while reserving human intervention for more complex issues
- Ensure alerts are actionable and provide clear next steps so that responders can immediately know what to do when an alert is triggered, reducing the time spent diagnosing the problem
In one of our environments, we were dealing with a flood of alerts, many of which were of low priority or false positives. By refining our alerting mechanisms to focus on severity and impact, and implementing automated response workflows, we saw a dramatic improvement in our incident response times. For example, we automated responses for low-severity issues like disk space nearing capacity by scripting automatic clean-up tasks. This reduced human intervention by about 30% in these cases.
Additionally, we ensured that higher-priority alerts, such as potential security breaches or application downtime, were accompanied by detailed action steps, reducing ambiguity and the time it took to resolve incidents. As a result, our team’s mean time to resolution (MTTR) for critical incidents improved by 40%, and we responded to significant issues faster without being bogged down by less relevant alerts. This approach enhanced response times, minimized alert fatigue, and allowed our team to focus on the most pressing matters.
Use cases and real-world applications
Log analysis has proven invaluable across many different industries and applications. Let’s explore some real-world log analysis applications and stories we’ve seen that highlight its potential.
CMA Technologies
CMA Technologies switched anti-virus solutions and encountered problems with virtual machines that caused them to go offline. Their previous infrastructure didn’t offer enough information to perform root cause analysis to find the cause of the problem, putting customers in jeopardy and introducing security issues.
Implementing LM Logs allowed CMA Technologies to receive actionable alerts when a potential issue could bring a virtual machine offline, allowing them to reduce their Mean Time to Recovery (MTTR). It also provided dashboards that offered more visibility into the entire organization.
Bachem Holding AG
Bachem’s IT team suffered from major alert fatigue. Although they were able to collect information about what was happening in the IT infrastructure, the sheer number of alerts made it hard to hone in on the important alerts to deal with critical issues.
LogicMonitor offered a solution to help get the most out of log analysis. Proper log analysis reduced the number of alerts and saved the team 10 hours. This allowed them to focus on the important issues and refocus on projects that help the business.
Future of log analysis
Log analysis is evolving rapidly, and the future looks promising for what’s to come on the horizon. Some things I’ve gathered from industry leaders and reports are that:
- AI and machine learning will continue to grow within log analysis to improve predictive analytics, automated root cause analysis, and anomaly detection
- There will be faster, real-time processing at the network edge, which will allow organizations to handle exponential data growth
- Interactive dashboards and augmented analytics will make data interpretation even more intuitive
- There will be better logging capabilities through new technology like IoT devices and 5G connections
- With more businesses moving to cloud-native and microservices architectures, advanced logging will be essential to maintain visibility across distributed systems
LogicMonitor Envision’s log analysis features
LogicMonitor Envision’s log analysis feature helps your organization surface errors in log data—helping teams of all levels and industries find problems with just a few clicks.
Instead of indexing, looking through data with query language, or training, you can use AI to analyze thousands of logs. Your data is categorized by severity, class, and keywords, making manual searches obsolete.
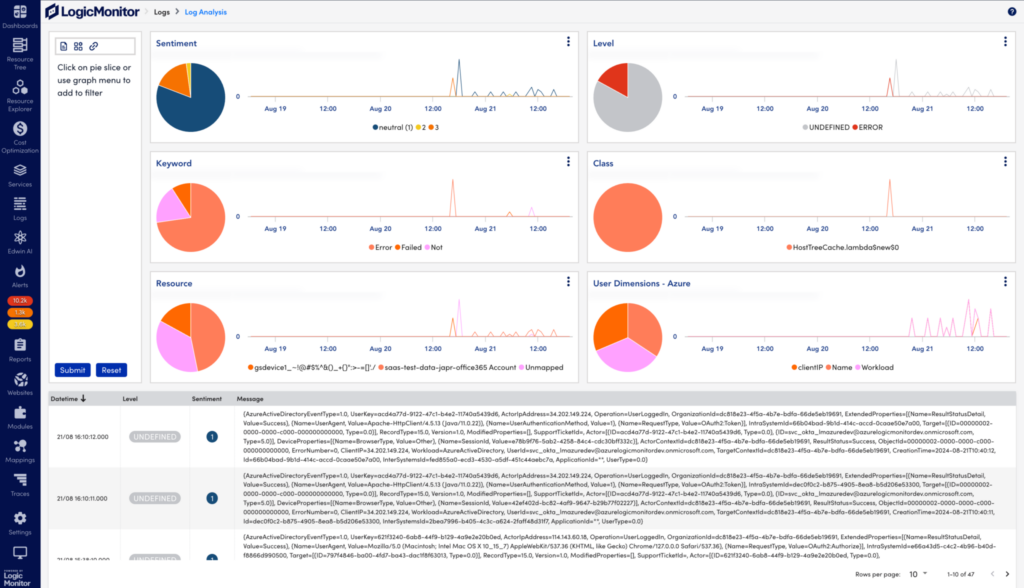
LM Envision can do this with a few key features:
- AI-powered analysis: Automatically categorizes logs to surface information without manual searches and detect anomalies to save you the manual work of categorizing and monitoring information
- Intuitive visualizations: Correlates IT and business metrics to understand the true impact of IT performance and perform root cause analysis, helping you troubleshoot faster to reduce MTTR
- Sentiment scoring: Prioritizes issues based on severity levels—allowing you to focus on the most critical problems
- Negative phrases: Tags logs with negative keywords to surface only important information. For example, add less critical keywords to negative phrases and look at errors that can pinpoint problems
- Customizable insights: Tailors log analysis based on your organization’s needs and goals, such as alerting by keyword, sentiment scores, and other filters
- Central log management: Centralizes log management to make it easier to monitor system performance, avoid the need to monitor individual devices, and save time
- Edwin AI: LogicMonitor’s GenAI-powered assistant allows organizations to use natural language to query log data built using unstructured and structured data from your organization
Wrapping up
Log analysis isn’t just a troubleshooting tool—it’s a strategic asset that can enhance your IT environment’s security posture, performance, and compliance. By leveraging advanced techniques like AI-powered pattern recognition, event correlation, and real-time visualization, your team can proactively address issues before they become critical.
OpenTelemetry (OTEL) provides vendor-neutral ways of application instrumentation so that customers can switch between Telemetry backends without re-instrumentation. It enhances observability by adding valuable data alongside other monitoring systems. OpenTelemetry consists of the OpenTelemetry SDK, the OpenTelemetry API, and the OpenTelemetry Collector. This approach ensures flexibility and standardization for monitoring systems.
This article will cover OTel and its architecture (receivers, processors, exporters, extensions, and service config). You’ll also learn key practices to help you deploy and maintain your OTel Collector so you can meet your organization’s needs.
Understanding the OpenTelemetry Collector
As a core component of OpenTelemetry, OTel collectors are deployed as pipeline components between instrumented applications and telemetry backends. With an OTel Collector, telemetry signals are ingested in multiple formats, translated to OTel-native data formats, and exported to backend-native formats. They are part of the three pillars of observability (metrics, logs, and traces), with traces for API being the most mature and metrics and logs in different stages of development.
Key components of the OTel Collector architecture
The OpenTelemetry collector consists of three main components: Receivers, processors, and exporters. These collector components are used to construct telemetry pipelines.

Receivers: Collecting telemetry data
Receivers are responsible for transferring data to the collector. They can be push-based or pull-based. Receivers accept data in specified formats, translate it into an internal format, and then pass it to batch processors and exporters defined in applicable pipelines. The format of any trace data or metrics supported is receiver-specific.
Processors: Transforming and enriching data
Processors transform metrics and modify the names of spans before sending data to exporters. They also batch data before sending it out, retry when exporting fails, and add metadata and tail-based sampling. The order in which processors are configured dictates the sequence of data processing.
Exporters: Sending data to backends
Exporters are tasked with exporting processed telemetry data to various observability backends, both open-source and commercial. They ensure that observability data reaches its intended destination in a compatible format, supporting seamless integration with different observability platforms.
Extensions: Enhancing collector functionality
Extensions add optional capabilities to the OTel Collector without directly accessing telemetry data. They are used primarily for managing and monitoring OTel collectors and offer optional enhancements for the collector’s core functionality.
Service configuration: Enabling components
The service section of the OTel Collector enables configured components within defined receivers, processors, exporters, and extensions sections. The section contains a list of extensions and pipelines of traces, metrics, and logs consisting of sets of receivers, processors, and exporters. Further information is available in Configurations for OpenTelemetry Collector Processors and LM OTEL Collector Logging.
Example configuration
receivers:
  otlp:
    protocols:
      grpc:
      http:

processors:
  batch:

exporters:
  otlp:
    endpoint: otelcol:4317

extensions:
  health_check:
  pprof:
  zpages:

service:
  extensions: [health_check,pprof,zpages]
  pipelines:
    traces:
      receivers: [otlp]
      processors: [batch]
      exporters: [otlp]
    metrics:
      receivers: [otlp]
      processors: [batch]
      exporters: [otlp]
    logs:
      receivers: [otlp]
      processors: [batch]
exporters: [otlp]Best practices for implementing the OTel Collector
- Ensure proper configuration: Each component—receivers, processors, and exporters—must be correctly configured and included in the pipeline for the collector to function effectively. Use validators to help ensure proper configuration.
- Utilize extensions wisely: Extensions are optional but can significantly enhance the collector’s capabilities, providing valuable monitoring and management functions.
- Leverage multiple pipelines: Define multiple pipelines with unique configurations to handle different types of telemetry data. While processors are represented per pipeline, receivers and exporters share collector instances across pipelines.
- Optimize data processing: It is crucial to optimize the order of processors, batch processing, sampling strategies, caching, and a configuration that optimizes data transformation and enrichment processes.
- Scalability and flexibility: Configuration of the OTel Collector to handle increased data loads as the system scales will help maintain efficiency and performance.
LogicMonitor’s OpenTelemetry Collector
LogicMonitor offers a customized version of the OTel Collector, which is pre-configured to forward traces from instrumented applications to the LogicMonitor platform. With LogicMonitor’s central management offering, users and providers can streamline observability strategies with little troubleshooting.
For more information on integrating with LogicMonitor, visit OpenTelemetry Collector for LogicMonitor Overview.
FAQs
What is the primary advantage of using the OTel Collector?
The primary advantage is its vendor-neutral approach, allowing organizations to switch between telemetry backends without re-instrumenting their applications.
Can I use multiple receivers in a single pipeline?
Yes, you can configure multiple receivers within a single pipeline to ingest data from various sources, optimizing your data collection strategy.
How do I ensure the OTel Collector scales with my system?
Implement best practices for configuration files and continuously monitor performance to adjust resource attributes as needed based on the signal types using the most resources, ensuring the collector deployment scales efficiently with your system.
What are the security considerations for deploying the OTel Collector?
Ensure data is encrypted in transit and at rest, and apply access controls to maintain the security and integrity of your telemetry data.
Simple Network Management Protocol (SNMP) traps are messages sent by SNMP devices that notify network monitoring systems about device events or significant status changes.
At LogicMonitor, our view on SNMP has evolved over the years. While we have often favored other logging methods that offered more insights and were considered easier to analyze in the past, we recognize that SNMP traps remain an essential tool in network management.
For network engineers, SNMP traps deliver real-time alerts faster than other methods, ensuring you’re the first to know when critical network events occur. They also provide specific, actionable data that can only be captured through traps, helping you quickly isolate issues and reduce downtime.
And it’s our mission to ensure our customers have all the necessary—and best—tools to solve their problems, no matter the technology. Mature techology =/= obsolete or ineffective.
So, let’s look at SNMP traps and how your organization can leverage them to monitor your IT infrastructure.
SNMP traps vs. SNMP polling
SNMP polling is similar to SNMP traps in that it allows you to collect information about a device’s status and store it in a monitoring server. The difference between the two is the way information is sent.
SNMP traps work on an event-based model. When a pre-defined event occurs, it immediately sends a trap message to the designated receivers. On the other hand, SNMP polling mechanisms work with the monitoring server actively requesting information from SNMP agents.
Using SNMP traps offers you many advantages over polling:
- Get real-time notifications to learn the moment an event occurs
- Reduced network overhead by only sending messages when events occur
- Quickly catch issues that may get missed by intermittent problems
Depending on your organization’s needs, there are also some drawbacks to using SNMP traps, some of which include:
- Notifications may be lost during transit since they are sent using User Datagram Protocol (UDP—a fast, connectionless communication method that sends data without guaranteeing delivery, often used in real-time applications)
- Setting up individual devices to send traps may be more complex if setting up more than one trap instead of just starting an SNMP agent to accept polling, but this isn’t always the case
- It may miss the broader context regular polling provides (if not using a combination of trapping and polling) because traps only send point-in-time information
Despite those challenges, you can still use SNMP traps to get information about your infrastructure. We offer LM Logs as part of the Envision platform. LM Logs provides many features that help IT teams manage SNMP traps, such as:
- Sending traps to the collector to gather and Map Management Information Base (MIB) data
- Uploading proprietary and/or custom MIB definitions to expand translation capabilities
- Automatically translating object identifier (OID) and Varbind (Variable Bindings) information into human-readable labels to focus on finding issues
- Using advanced anomaly detection features to remove the noise and surface only the most important traps
- Utilize stateful alerting to automatically close alerts that receive an indication that the error status doesn’t exist anymore to reduce the number of alerts
Detailed mechanism of SNMP traps
Several components make up SNMP traps:
- SNMP agent: Software running on monitored devices that generate and send SNMP trap messages
- SNMP manager: Systems that receive and parse SNMP trap information
- Management Information Base (MIB): Database defining the structure and meaning of trap information
- Network Management System (NMS): The overall system responsible for monitoring and managing network devices, including routers, servers, and switches.
The other critical part of SNMP traps is how the data is stored. This happens through OIDs. By default, SNMP agents come with default OIDs from the built-in traps. However, you may also create custom OIDs or download pre-built ones from device vendors to upload to your monitoring solution.
You must also consider how SNMP traps are submitted. They use single UDP packets for transmissions, meaning delivery isn’t guaranteed. You can minimize some of this risk by putting the device and collector as close together as possible on the network.
When using SNMP traps, you’ll need to weigh the benefits of lower overhead against the risk of missed deliveries. Although polling may provide data at a delayed rate, combining it with traps will ensure you don’t miss any critical alerts.
Types of SNMP traps
Several SNMP traps are available, from standard to enterprise-specific and custom traps.
Let’s look at some common traps available:
- coldStart: Indicates system reinitiation itself with potential configuration changes
- warmStart: Indicates system reinitiation without configuration changes
- linkDown: Indicates a communication link failure
- linkUp: Indicates a communication link was restored
- authenticationFailure: Indicates an authentication request failure
- egpNeighborLoss: Indicates an EGP neighbor loss
You can create custom traps if your organization needs more from SNMP traps. To do this, you would download the proprietary MIB files from your vendors (or create a custom one if you have more specific needs). You can then upload your custom MIB file to your monitoring solution so it can translate the data.
Through this, you can define custom traps to look for events such as CPU utilization and memory usage. You can also define custom alerting behavior based on specific conditions using LogSources and Pipelines to get notified about the alerts that matter most—as well as define custom “stateful” behaviors to remove alerts that aren’t relevant anymore. Example: “alert on Link Down, but close the alert if/when you get a Link Up for the same interface.”
The good thing about collecting this information using traps (as opposed to polling) is that it’s less resource-intensive on networks, as businesses only get the alerts they’re looking for instead of constantly polling devices—something especially important in large environments.
It also offers alerts when they matter the most—when a device problem occurs. This helps teams find issues immediately instead of only learning about problems when a device is polled.
Configuring SNMP traps
Configuring SNMP traps involves configuring individual devices to trigger SNMP traps and send them to the Collector. Follow the general steps below to start with the configuration:
- Access the device configuration to enable the SNMP agent
- Configure the trap destination by inputting the IP address or DNS of the trap receivers
- Study vendor documentation for proprietary OIDs to learn the available traps and upload them to your Collector
- Define the trap types by selecting the events that trigger traps and send data to the receivers
- Set community strings for trap configuration (authentication strings, port numbers, and engine ID)
- Test the configuration to ensure traps work properly
This can get your organization set up with a basic configuration. However, a few advanced tips are available that will help optimize your SNMP traps:
- Send all traps available to a monitoring server and filter everything not required
- Collect MIB information from proprietary vendors to get comprehensive insights into enterprise environments
- Use a DNS name instead of an IP address to avoid misconfiguration when IP addresses change
- Avoid sending traps across the NAT or the internet to avoid packet loss with UDP packets
- Use the default LogSource when possible and add customization when you need custom behavior
Monitoring and managing SNMP traps
SNMP traps can gather a lot of information, but as your network environment grows, you may start gathering a lot of information and need a way to filter down to the most important data.
This requires strong SNMP trap monitoring and management.
It comes down to two things: interpreting trap messages to respond effectively and automating alerting.
- Interpreting trap messages: Properly define source devices, event types, and associated data. Filter messages to surface trap information that indicates problems that IT teams should respond to—avoiding time wasted looking through irrelevant data.
- Automation: Automatically filter information based on the above criteria and use reporting tools to send it to the appropriate party for resolution—ensuring engineers only see the information they should act on.
You can use tools such as the ones we offer at LogicMonitor with LM Logs to improve the management of SNMP traps as part of a hybrid observability solution (for legacy on-prem and cloud infrastructure and services). LogicMonitor Envision provides several features to make management easier:
- Automatic ingestion, parsing, and mapping SNMP traps as logs to read OIDs in a human-readable format and streamline their management
- Automatic translation of OIDs and their data to remove the need for you to manually decode them, helping you quickly learn what potential problems the data shows
- Store historical data to get the historical context of SNMP logs—along with other data—to perform historical analysis and find trends
- Automatic anomaly detection using AI-powered features to help automatically surface the SNMP trap data that matters and helps you save time
- Integrate with SNMP polling to get faster notifications and maximum visibility
- Link SNMP trap information with other data within LM Envision to help correlate potential issues with other data
Best practices for SNMP trap management
With so much data available with SMP traps, your organization can employ best practices to help streamline operations. Use the following tips to practice efficient SNMP management:
- Centralize management: Centralize the collection of SNMP traps using monitoring software (like LM Logs) to streamline management
- Filter traps: Use filters using your management software to eliminate traps you aren’t interested in
- Complete visibility: Collect as much information as possible to get complete visibility on a network
- Integrate with other tools: Use SNMP trap data in other tools to get a more comprehensive view of your IT infrastructure instead of only using SNMP trap information
- Automate where possible: Avoid manual work wherever possible by automating alerts and OID translation
Challenges, best practices, and troubleshooting in SNMP trap management
Although several challenges are associated with SNMP traps, there are ways you can mitigate those challenges to ensure you get the information you need.
Let’s look at a few common challenges and the best practices to overcome them.
Missed traps
Since SNMP uses UDP for transmission, traps can be lost in transmission. Consider using SNMP inform messages or app-level acknowledgments to ensure the trap receiver sees all traps. These will help agents determine if a trap message was successfully sent. Also, try to avoid sending traps across network address translations (NATs) and network boundaries to reduce the chance of packet loss.
Misconfigured devices
Some traps have thresholds that trigger an alert. If a device isn’t configured properly, it won’t send an alert to you. When setting up traps, audit devices to ensure proper configuration and test devices where possible to see if traps trigger.
False positives
Traps provide a lot of information—and not all of it is relevant to finding and fixing IT problems. You may miss the important alerts if you look at all this data. Regularly review any false positives triggered and put filters in place to remove them from regular alerts—reducing alert fatigue and allowing you and your team to focus on real problems.
Security concerns
Traps can potentially expose sensitive information if not properly secured. Ensure your organization uses the latest SNMP (SNMPv3) version and implements encryption, complex community strings, Access Control Lists (ACLs), and trusted IP addresses. Implementing a regular audit of SNMP traffic can help identify anomalies.
Troubleshooting SNMP problems
Troubleshooting SNMP issues comes down to ensuring traps are generated when necessary and make their way to the trap receiver. Here’s some steps you can leverage to identify potential SNMP problems:
- Verify trap generation to ensure the target devices are correctly configured
- Check network connectivity to look for network issues that may impact transmission
- Validate trap receiver configuration to ensure traps go to the right place
- Analyze trap content to ensure it contains the correct information
- Review MIB files to ensure they are updated to the latest versions from the vendors
Advanced topics in SNMP traps
Understanding where SNMP came from and other advanced topics will help you learn what it’s about and how it helps.
The evolution of SNMP
SNMP started with SNMPv1 in the 1980s. It started simple with limited features, but it lacked security features, making it a problem for businesses. Over time, the SNMPv2 protocol was released, and it came with manager-manager communication and enhanced security. It greatly expanded the amount of data available to be received on a single request, giving organizations more flexibility in how they use the protocol.
However, one of the biggest challenges with SNMPv2 was that the security amounted to nothing more than a password, which is where SNMPv3 comes in. SNMPv3 is the latest and most secure version. It includes authentication and encryption, ensuring that you and your team are the only people able to view trap data.
SNMP trap storms
SNMP trap storms occur when the number of traps received from a specific device reaches a specific threshold. Trap storms can indicate network outages, device misconfiguration, or cascading failures.
Trap storms can lead to network problems because of the overwhelming amount of bandwidth used on a network. They are also a sign that a more serious problem may need to be addressed immediately.
Your organization can address trap storms in several ways:
- Implement rate limiting to stop irrelevant traps
- Filter data to avoid unwanted traps
- Aggregate data to group similar traps in single alerts
Using SNMP traps with other protocols
SNMP traps provide a lot of data, but they’re only a piece of the puzzle when looking at a network in its entirety. Integrating them with other protocols like syslog and Netflow can offer more comprehensive visibility into IT infrastructure.
For example, Netflow tells businesses a lot about how data flows on a network—something SNMP doesn’t. Your organization can use the two protocols together to learn about what happens on devices and how devices interact with each other.
The same is true with syslogs. SNMP may tell you when something goes wrong on a device—but it may not give any details about more specific application errors. Looking at syslogs can give more details that SNMP doesn’t to help troubleshoot and fix problems.
SNMP informs vs. SNMP traps
SNMP traps are a mechanism a device uses to send information about device events. It’s a data collection mechanism that helps you and your team learn if anything important happens to their infrastructure.
SNMP informs require a response from other SNMP agents they communicate with. They expect a response from the other agent upon receipt of a message, which helps agents determine if a trap was successfully sent. These are good to use in cases when reliability is critical, and the information sent is vital to operations.
Wrapping up
As we’ve outlined, SNMP traps can be a useful tool, especially when combined with Logs. LogicMonitor has evolved our perspective, thanks to customers’ input to provide the best tool for the job. SNMP traps and LM logs offer the best of both worlds, giving IT teams actionable insights and helping them troubleshoot critical infrastructure problems. Using traps and polls together provides a comprehensive solution for network monitoring and helps teams ensure their infrastructure stays online.
For Managed Service Providers (MSPs), handling multiple clients’ IT environments means handling vast amounts of sensitive data, critical systems, and privileged access. Role-based access control (RBAC) is essential for data security and customer confidence to ensure that only the right people can gain access to sensitive information. As part of Cost Optimization, LogicMonitor has introduced RBAC into our Cloud Billing capability for access guardrails around displaying multi-cloud billing information and summaries.
Billing account level RBAC
With RBAC in Cloud Billing, an administrator can control the billing account permissions and access for roles, users or end customers. MSPs can provide customers access to view and interpret specific cloud billing information pertinent to their environments while safeguarding cloud billing data from other customer accounts.
Getting started with RBAC in Cloud Billing
Setting up RBAC in Cloud Billing is easy and will only take a few minutes to secure your data.
- Log in, select permissions, and navigate to the Cost Optimization tab.
(Note: Recommended best practice is to grant all account access only to the administrator role.)
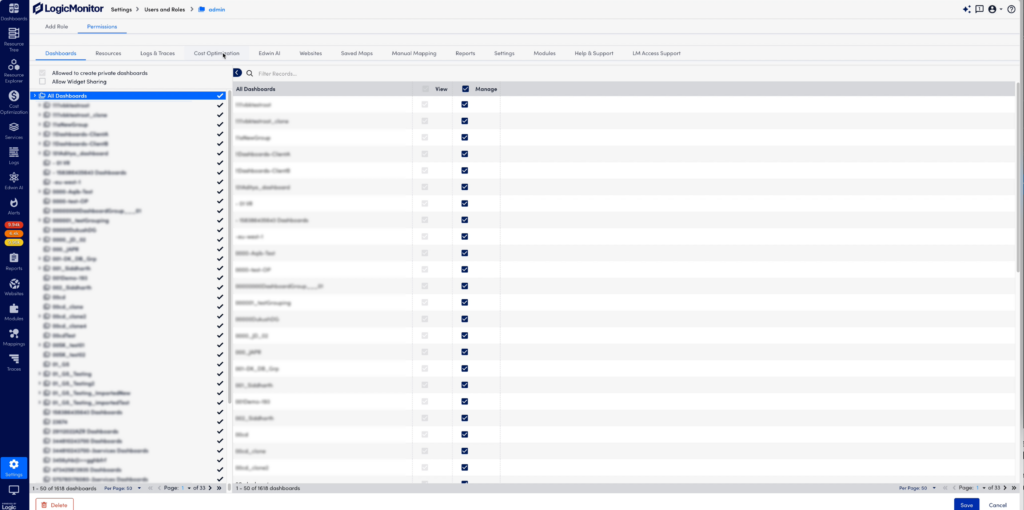
- In the Billing section under Cost Optimization, select the individual accounts to grant the user access. Filter on accounts you want to have access to and save the permission.
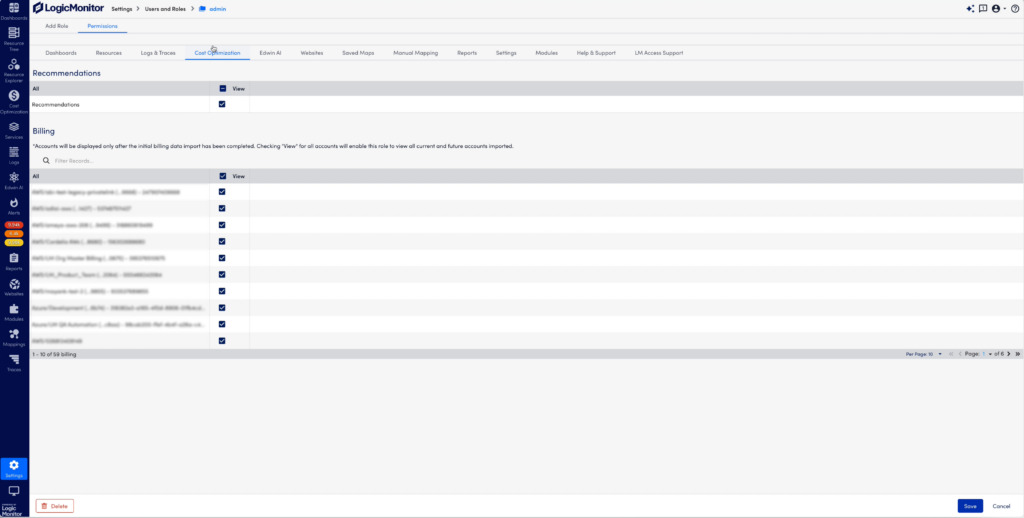
- Filter on account names or numbers to select specific accounts for billing data access. Save the selection to update role access.
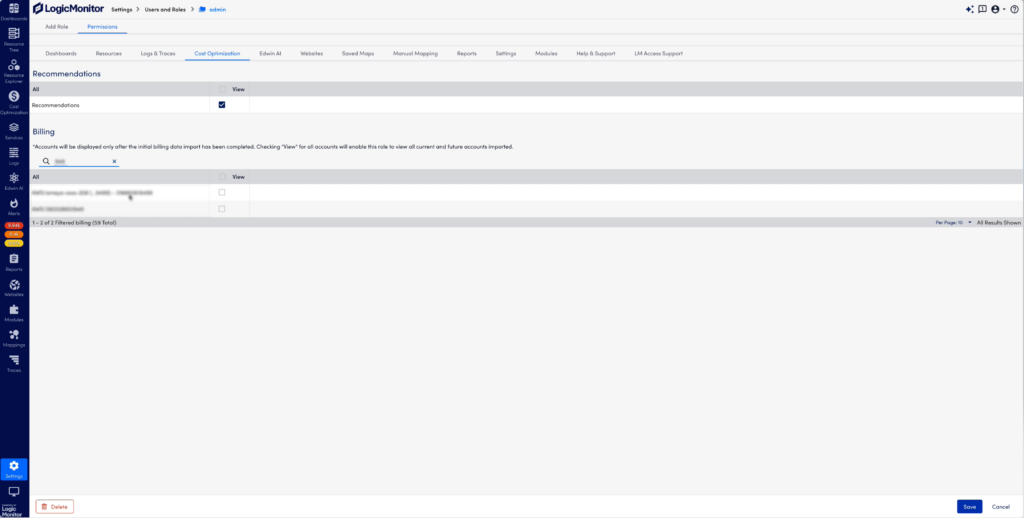
- Navigate to the Billing page under Cost Optimization to see the selected accounts that the user has permission to view.
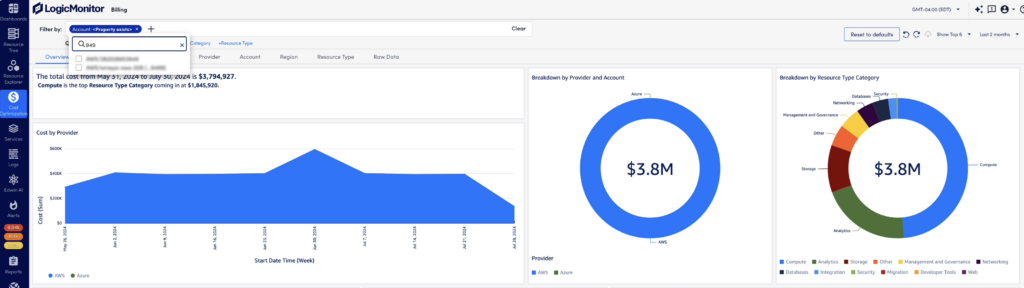
- While all dashboard views will be scoped to the individual accounts that have been enabled for access, the Accounts tab is one example that illustrates this clearly. Here, the user can only see the accounts in the data set according to their access.
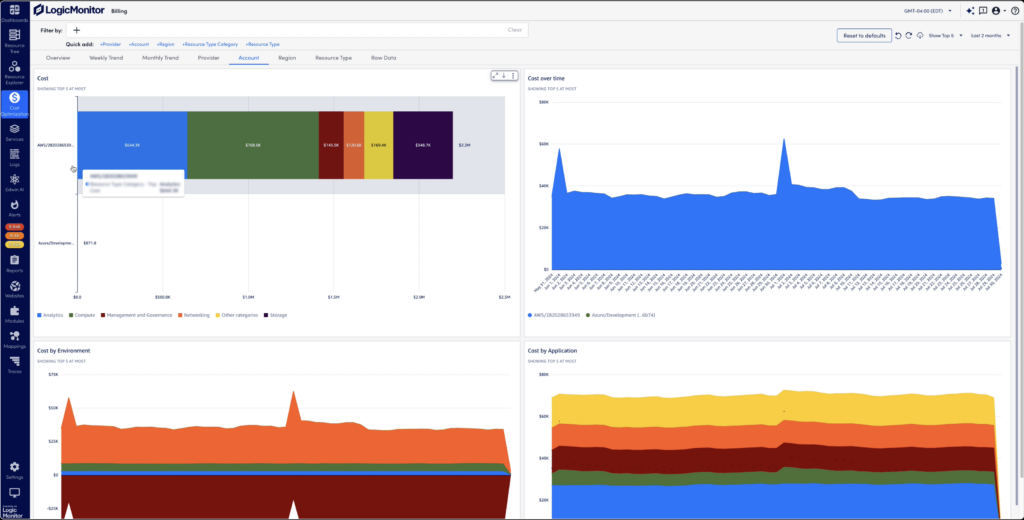
With Cloud Billing, users can see complete, detailed views of costs from Azure and AWS cloud services in a single view. They can analyze spend allocation with filtered tags including account, region, resource type, and more. With this detailed level of billing information, users can easily interpret cost trends to uncover where, when, and why cloud billing changes occurred.
Wrapping up
Incorporating RBAC into LogicMonitor’s Cost Optimization Cloud Billing ensures MSPs can offer their clients secure, granular access to billing account information, safeguarding sensitive data while promoting transparency. By enabling MSPs to control account-specific access and streamline billing visibility, RBAC empowers users to make informed decisions about their cloud spend across cloud services. This feature drives efficiency, improves security, and strengthens customer trust.
Contact us to learn more about how RBAC in Cloud Billing can enhance your cost management strategy and see a demo in action.