Dashboard


Alert List
View a detailed list of highly-filterable LogicMonitor Alerts in a dashboard, perfect for a NOC TV.

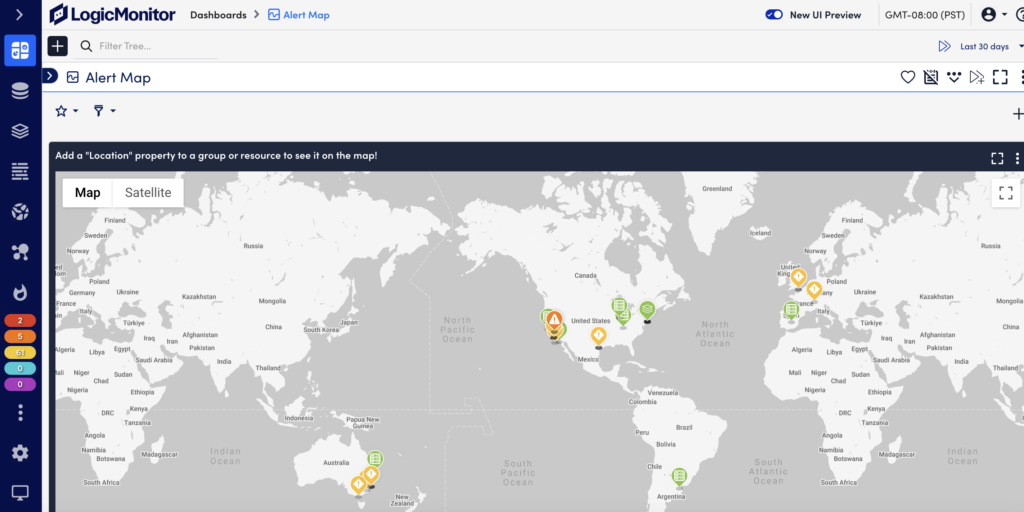
Alert Map
As alerts are triggered by monitored resources within your LogicMonitor environment, this dashboard will auto-populate and display the alerts by group and/ or location.
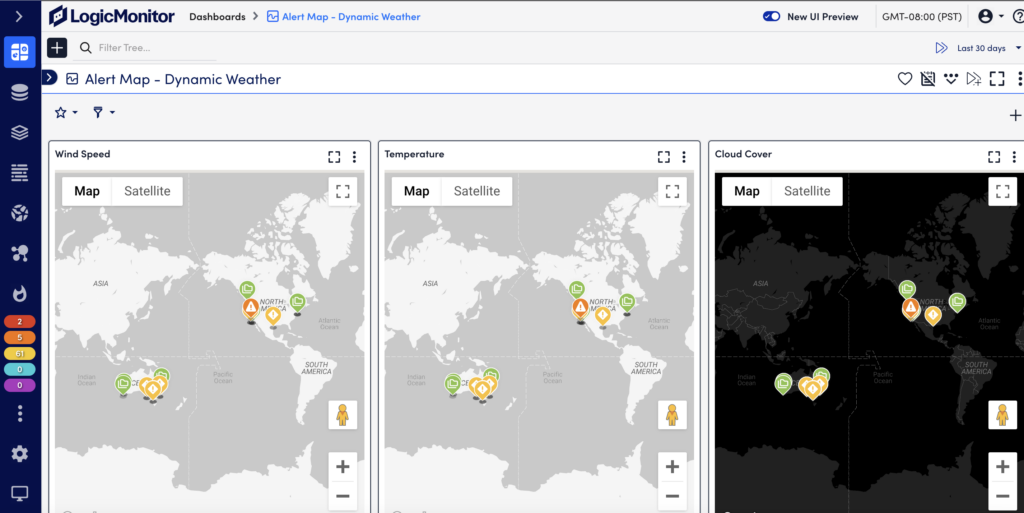
Alert Map – Dynamic Weather
If you liked the LogicMonitor dashboard hit ‘Alert Map,’ you’re going to love ‘Alert Map – Dynamic Weather’, remastered and enhanced with a multitude of configurable weather overlays.
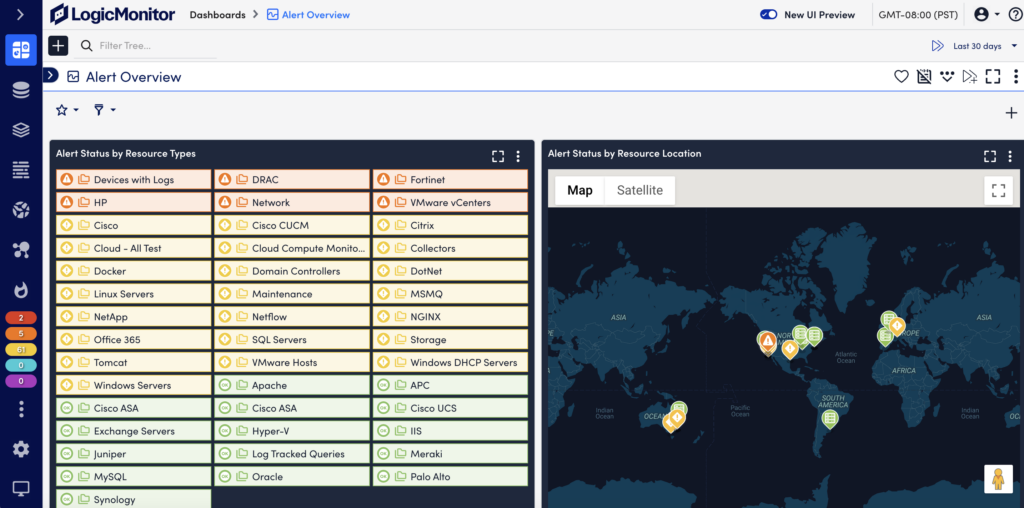
Alert Overview
We hope you like alerts, because we put resource group alerts next to an alerts map next to a detailed alert list, all in a single screen for easy and thoroughly exhaustive alerting awareness and review.
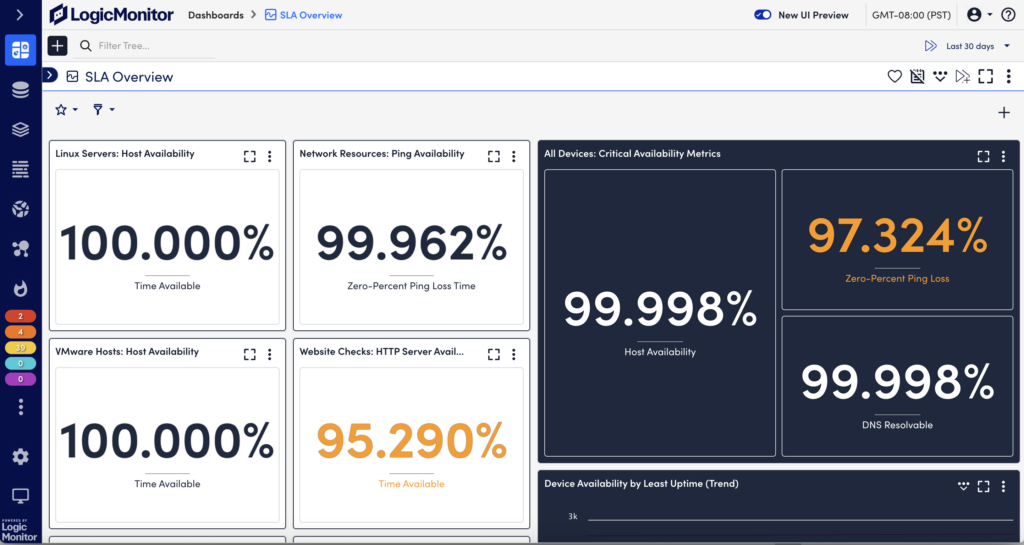
SLA Overview
LogicMonitor’s highly configurable SLA widgets allow you to define the metrics that matter to you, regardless of metric, resource type, or time range.