Dashboard

Applications

SUBSCRIBE

Subscribe to our newsletter

Get the latest blogs, whitepapers, eGuides, and more straight into your inbox.

SHARE TO SOCIAL
In this article

Apache

LogicMonitor provides agentless and proactive monitoring of your Apache instances so that your business can maintain performance and scale with confidence.
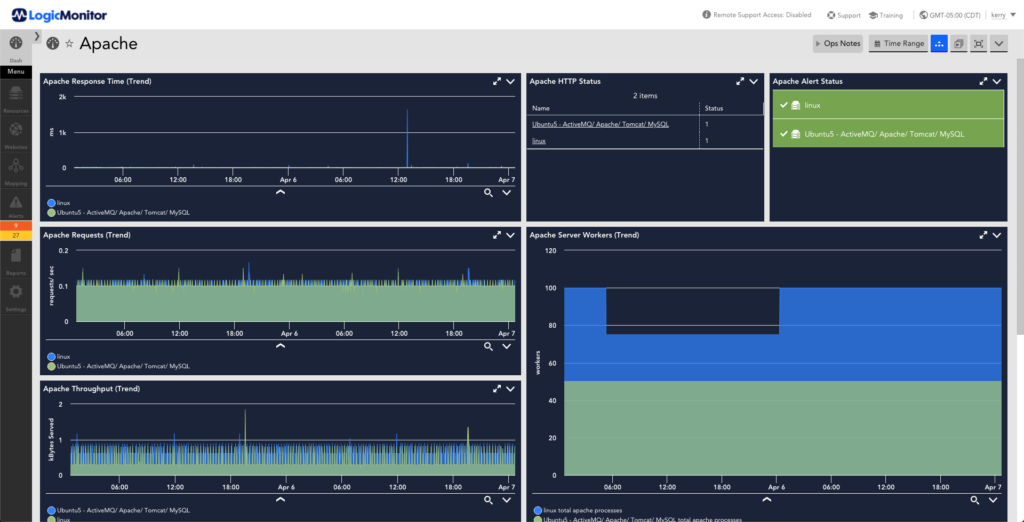
This dashboard provides status of Apache servers. The metrics displayed are response time, HTTP status, alert status, requests over time, server workers over time, throughput over time

Citrix

Citrix Virtual App and Virtual Desktop (the technology formerly known as XenApp/ XenDesktop) metrics as retrieved from the Citrix OData API.
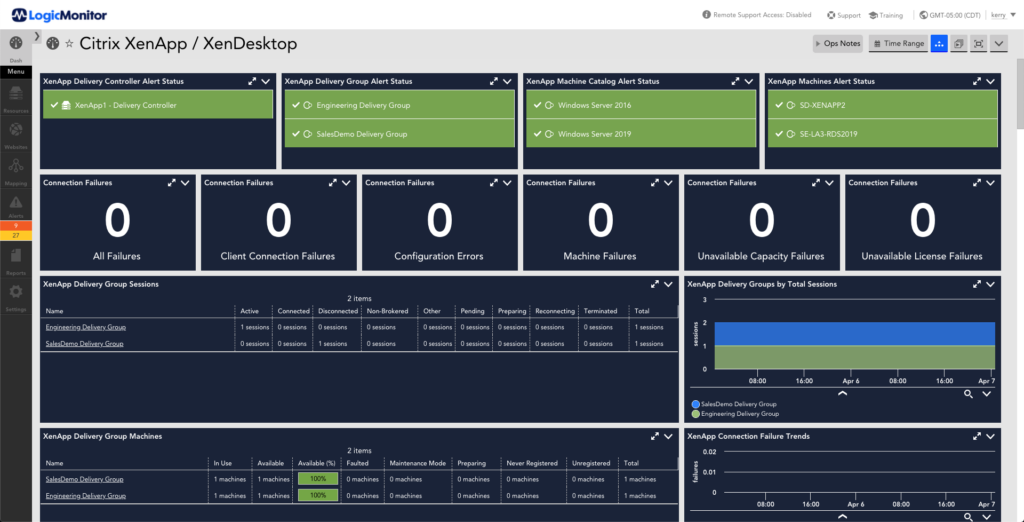
This dashboard provides status of Citrix XenApp / Xendesk applications. The metrics displayed are alert status, connection failure, delivery group sessions, delivery group sessions over time, delivery group machines, connection failure over time.

Docker

Docker container monitoring utilizing Google’s cAdvisor.
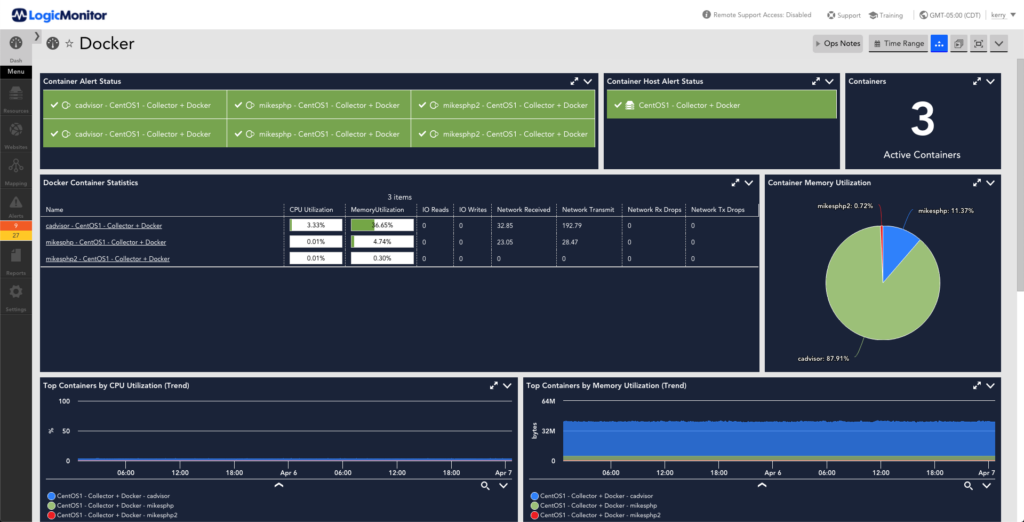
This dashboard provides status of Docker objects. The metrics displayed are alert status, number of containers, container statistics, container memory utilization, CPU utilization over time, Memory utilization over time

Office 365

Visibility into your Exchange Online, Outlook, OneDrive, SharePoint, Skype for Business, Teams, and Yammer environment to ensure that your users and customers remain productive.
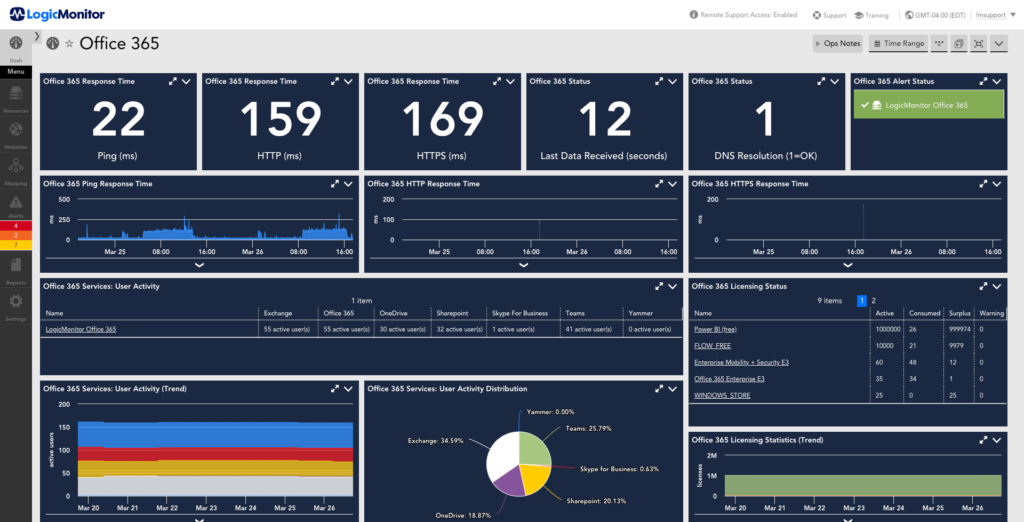
This dashboard provides status of Office 365 environment. The metrics displayed are alert status, response time over time, http response time, over time, user activity, licensing status, user activity over time, user activity distribution, licensing status over time

Slack

Get statistics on Slack response time and service status from the API.
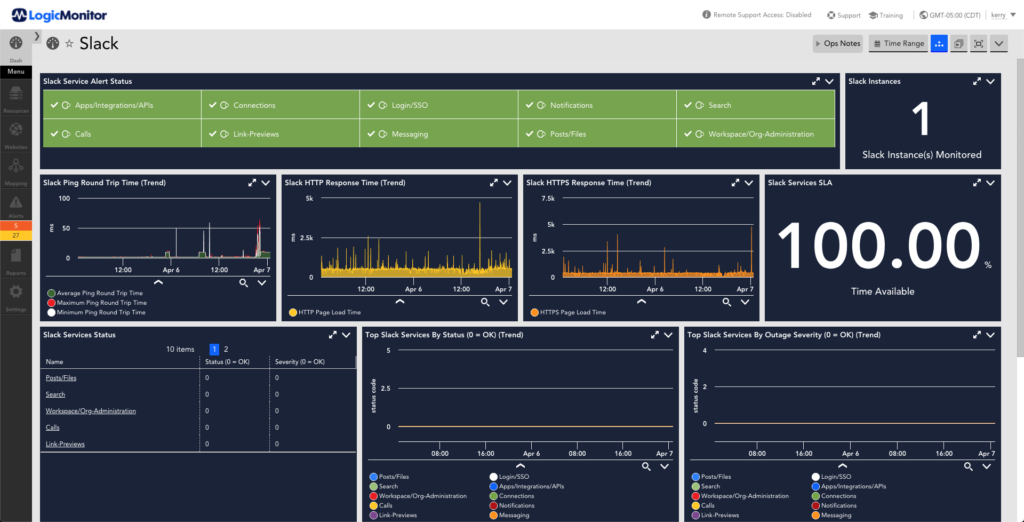
This dashboard provides status of the Slack environment. The metrics displayed are alert status, slack instances, ping rtt over time, http response over time, service SLA, slack services status, slack services status over time, service status outages over time

Tomcat

LogicMonitor monitors Tomcat with two approaches:

  • HTTP to check the server availability and responsiveness
  • JMX to collect comprehensive internal server statistics
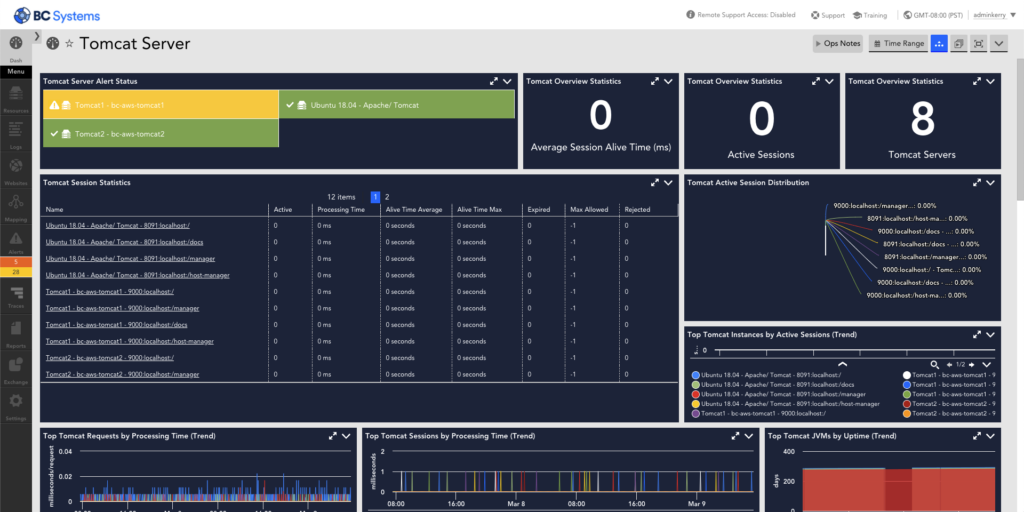
Tomcat server LogicMonitor dashboard

Veeam Backup & Replication

Using LogicMonitor’s Veeam Backup & Replication package, you can monitor the health of this application’s backup, synchronization, and replication operations, as well as the operational state, availability, and maximum task counts of the VMware and Hyper-V proxy hosts.
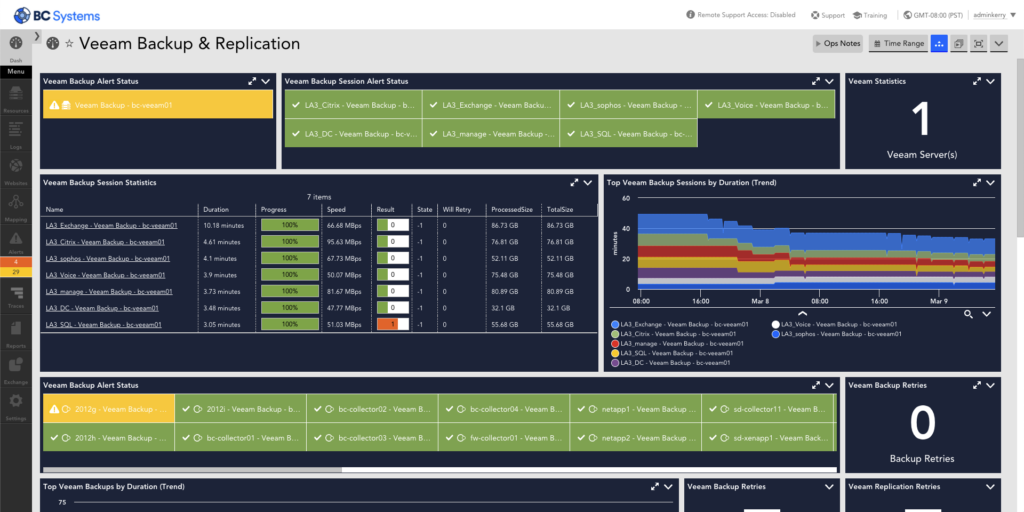
Using LogicMonitor’s Veeam Backup & Replication package, you can monitor the health of this application’s backup, synchronization, and replication operations, as well as the operational state, availability, and maximum task counts of the VMware and Hyper-V proxy hosts.

Zoom

Monitoring that covers Zoom component status, account licensing information, and overall Zoom status.
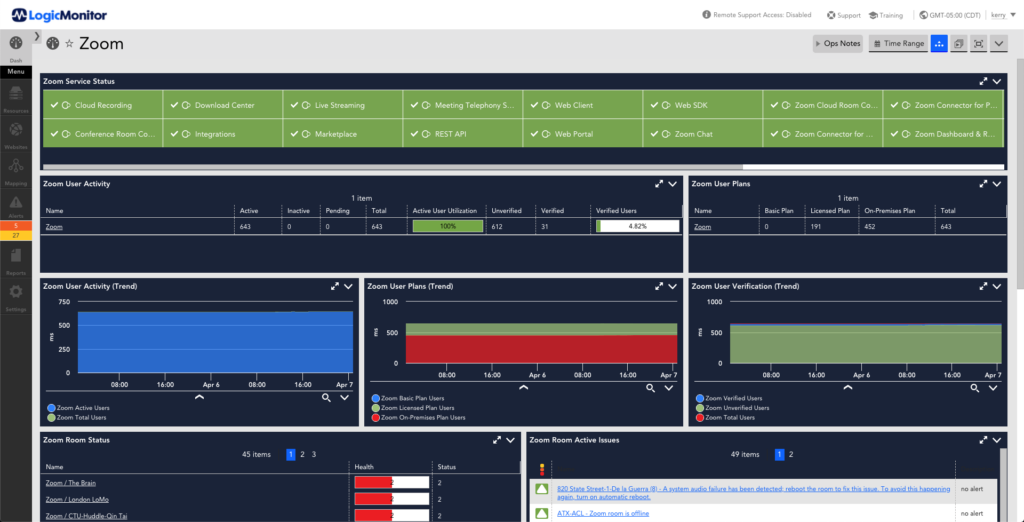
This dashboard provides status of the Zoom environment. The metrics displayed are alert status, user activity, user plans, user activity over time, user plans over time, user verification over time, room status, room activity issues