Dashboard


Amazon Web Services
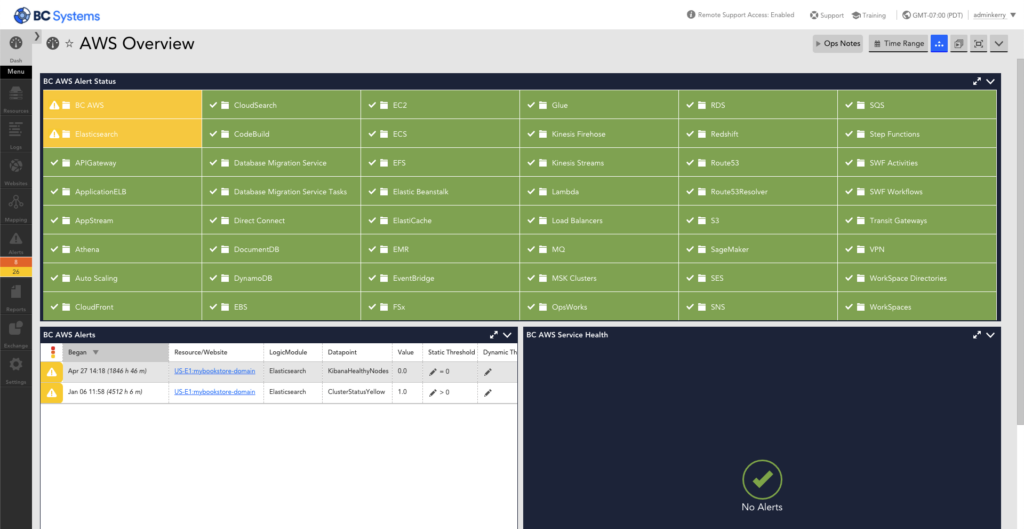
Account Overview
LM Cloud goes beyond traditional resource level performance and availability data, providing visibility into all of the components that have the potential to impact the health of your AWS-backed infrastructure and services.
Application ELB
Application Elastic Load Balancer data as reported by CloudWatch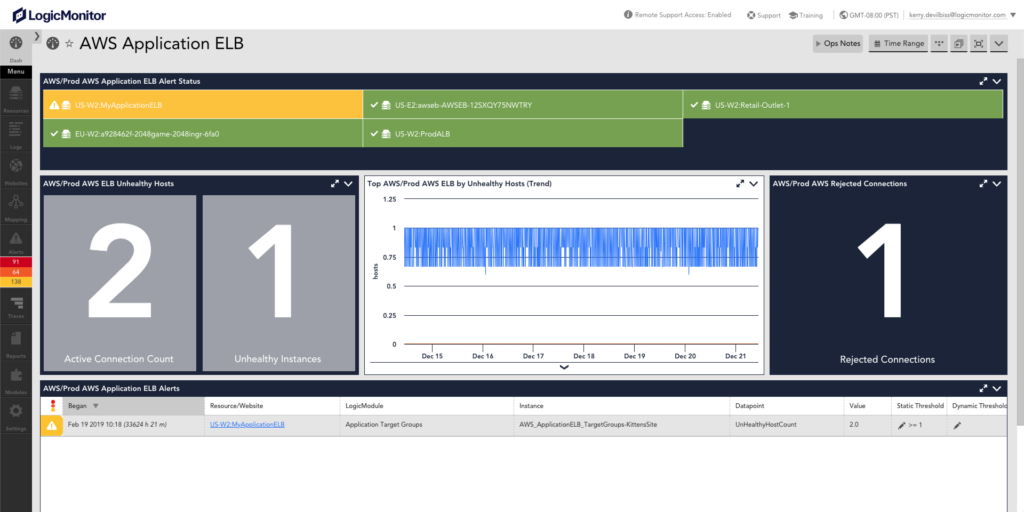
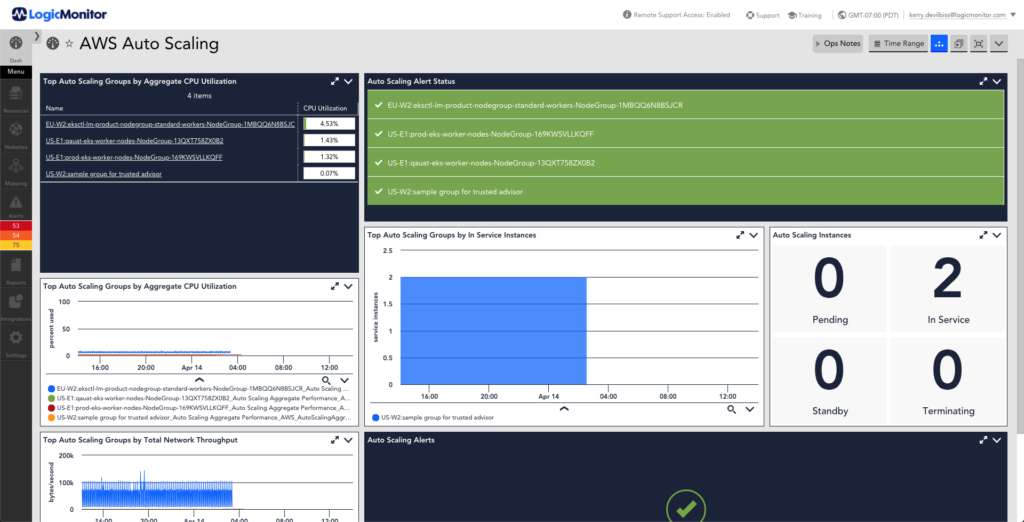
Auto Scaling
Auto Scaling Group scaling data as reported by CloudWatch
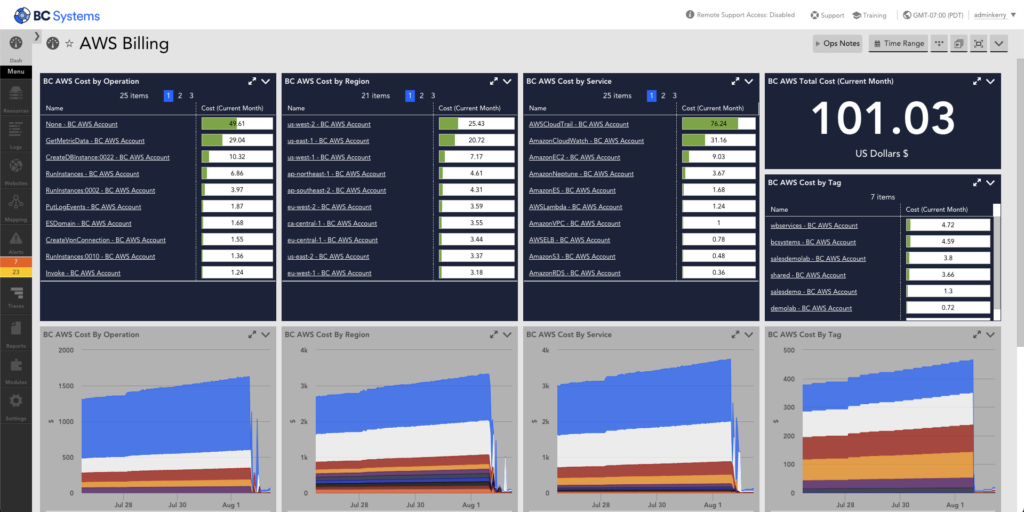
Billing
AWS Billing retrieved from Cost and Usage reporting.
Cloudfront
Utilize LogicMonitor to provide visibility into AWS Cloudfront, a content delivery network (CDN) service built for high performance, security, and developer convenience.

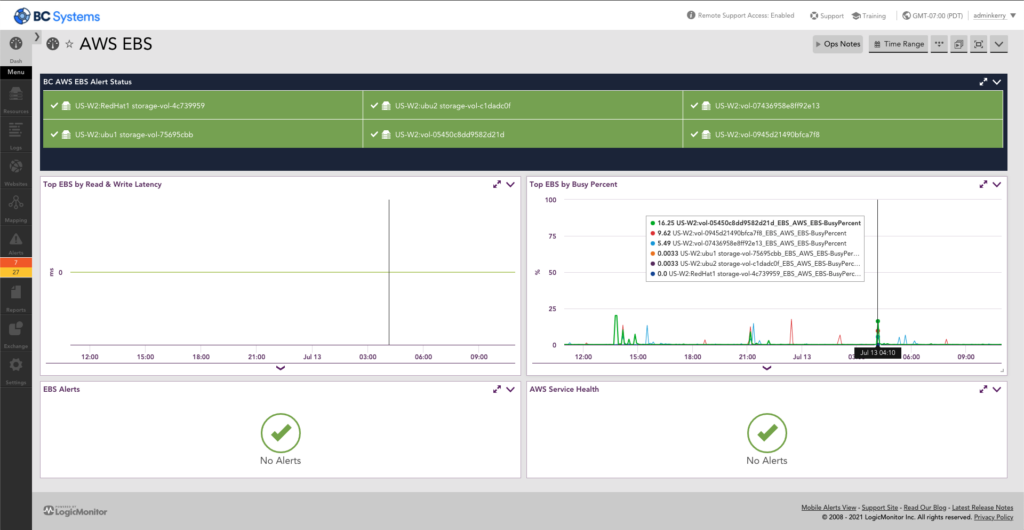
EBS
Elastic Block Store performance data as reported by CloudWatch.
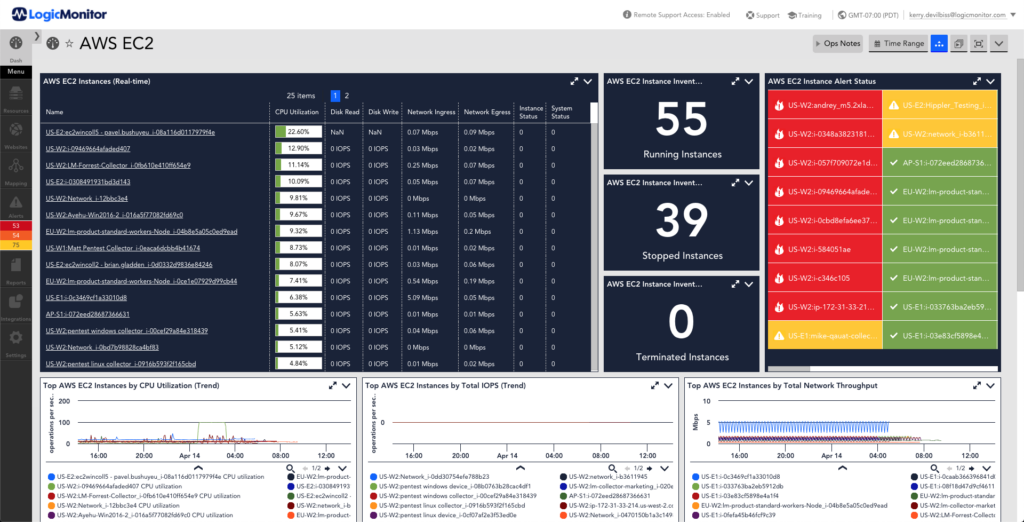
EC2
Elastic Compute Cloud (EC2) performance data as reported by CloudWatch.
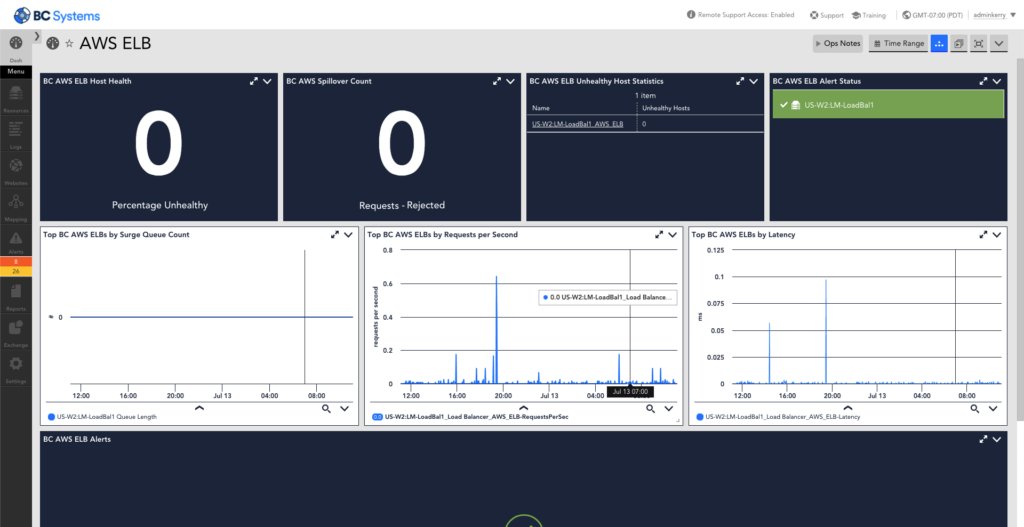
ELB
Elastic Load Balancer performance from Cloudwatch.
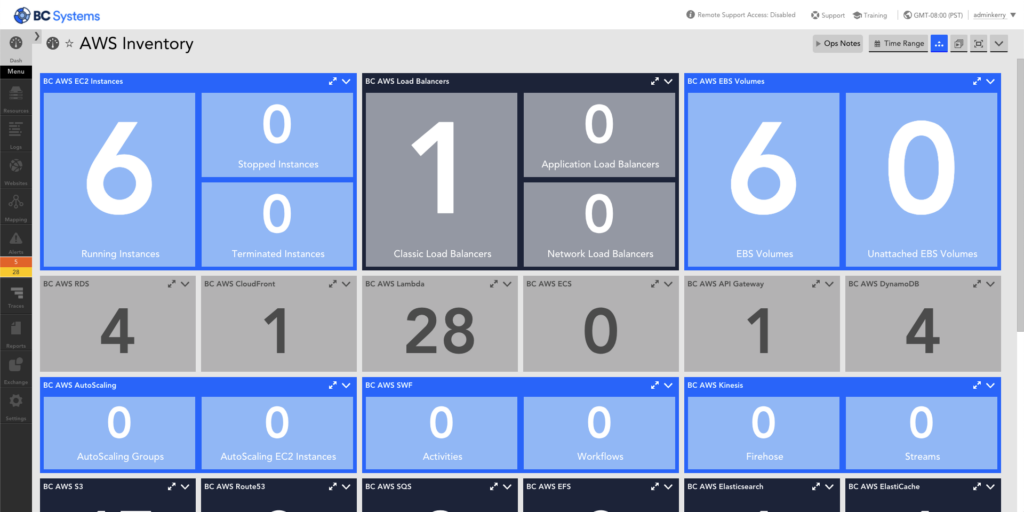
Inventory
LM Cloud simplifies cloud monitoring, and delivers comprehensive visibility into AWS infrastructure health and performance that is otherwise challenging to obtain.
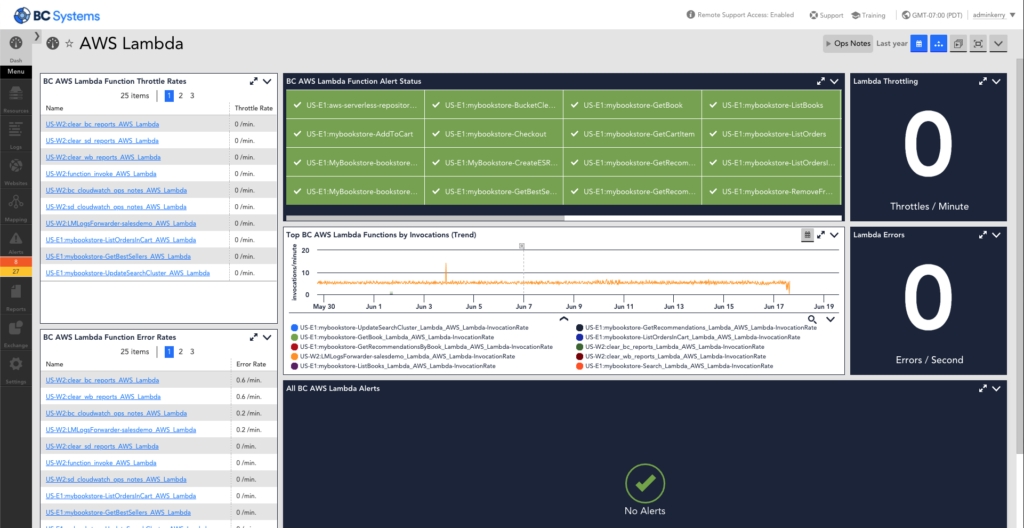
Lambda
Cloudwatch information about Lambda functions.
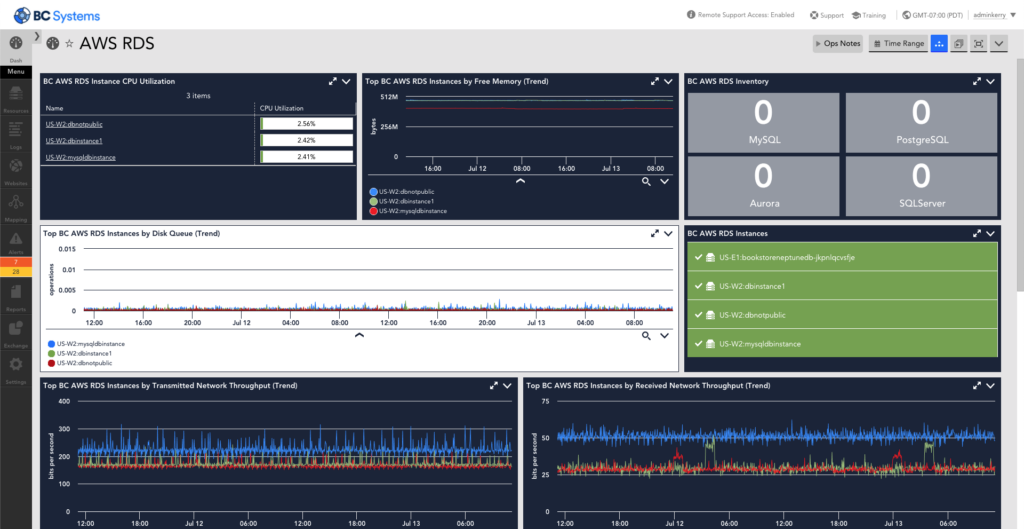
RDS
Relational Database Service performance data as reported by CloudWatch.
Redshift
Redshift performance data as reported by CloudWatch.
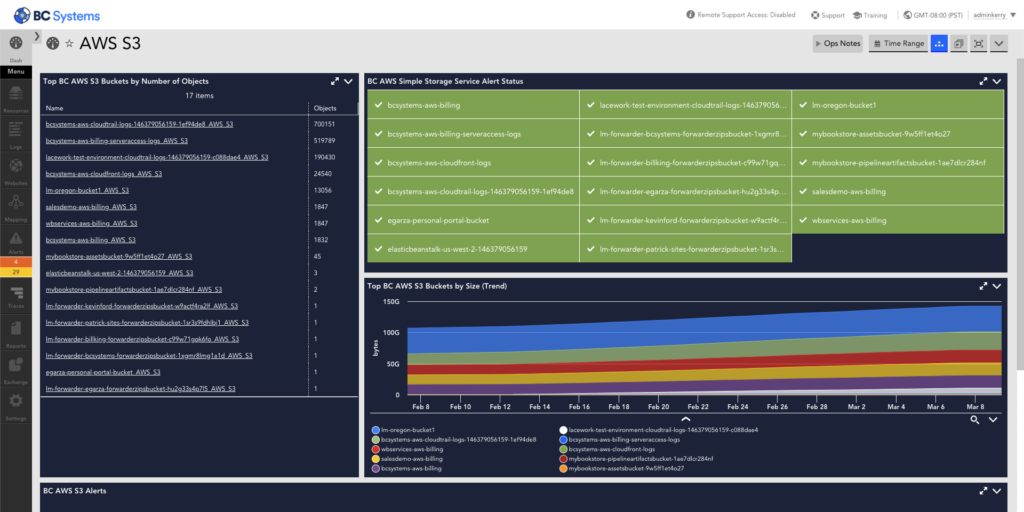
S3
LogicMonitor includes support for monitoring AWS metrics from Amazon.
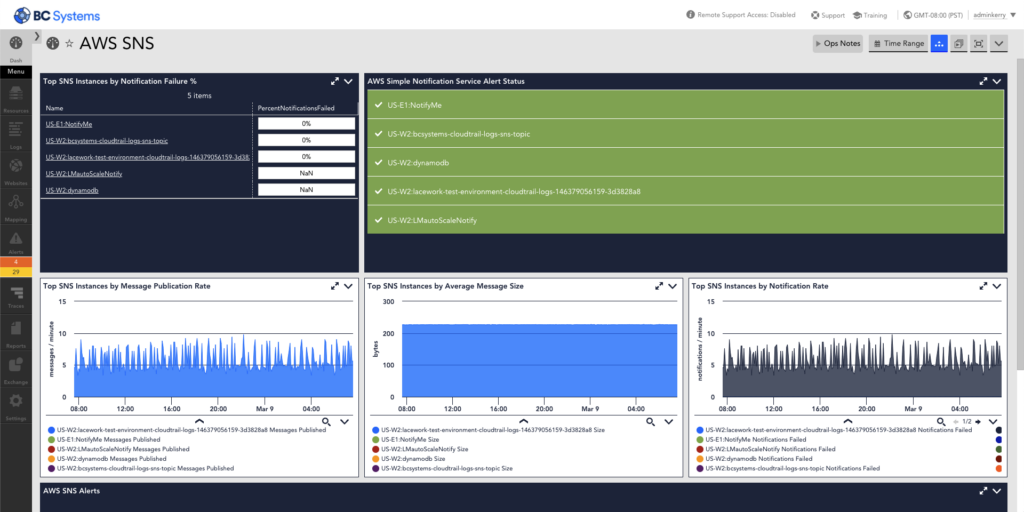
SNS
LogicMonitor has out of box datasource(s) for monitoring SNS performance metrics.
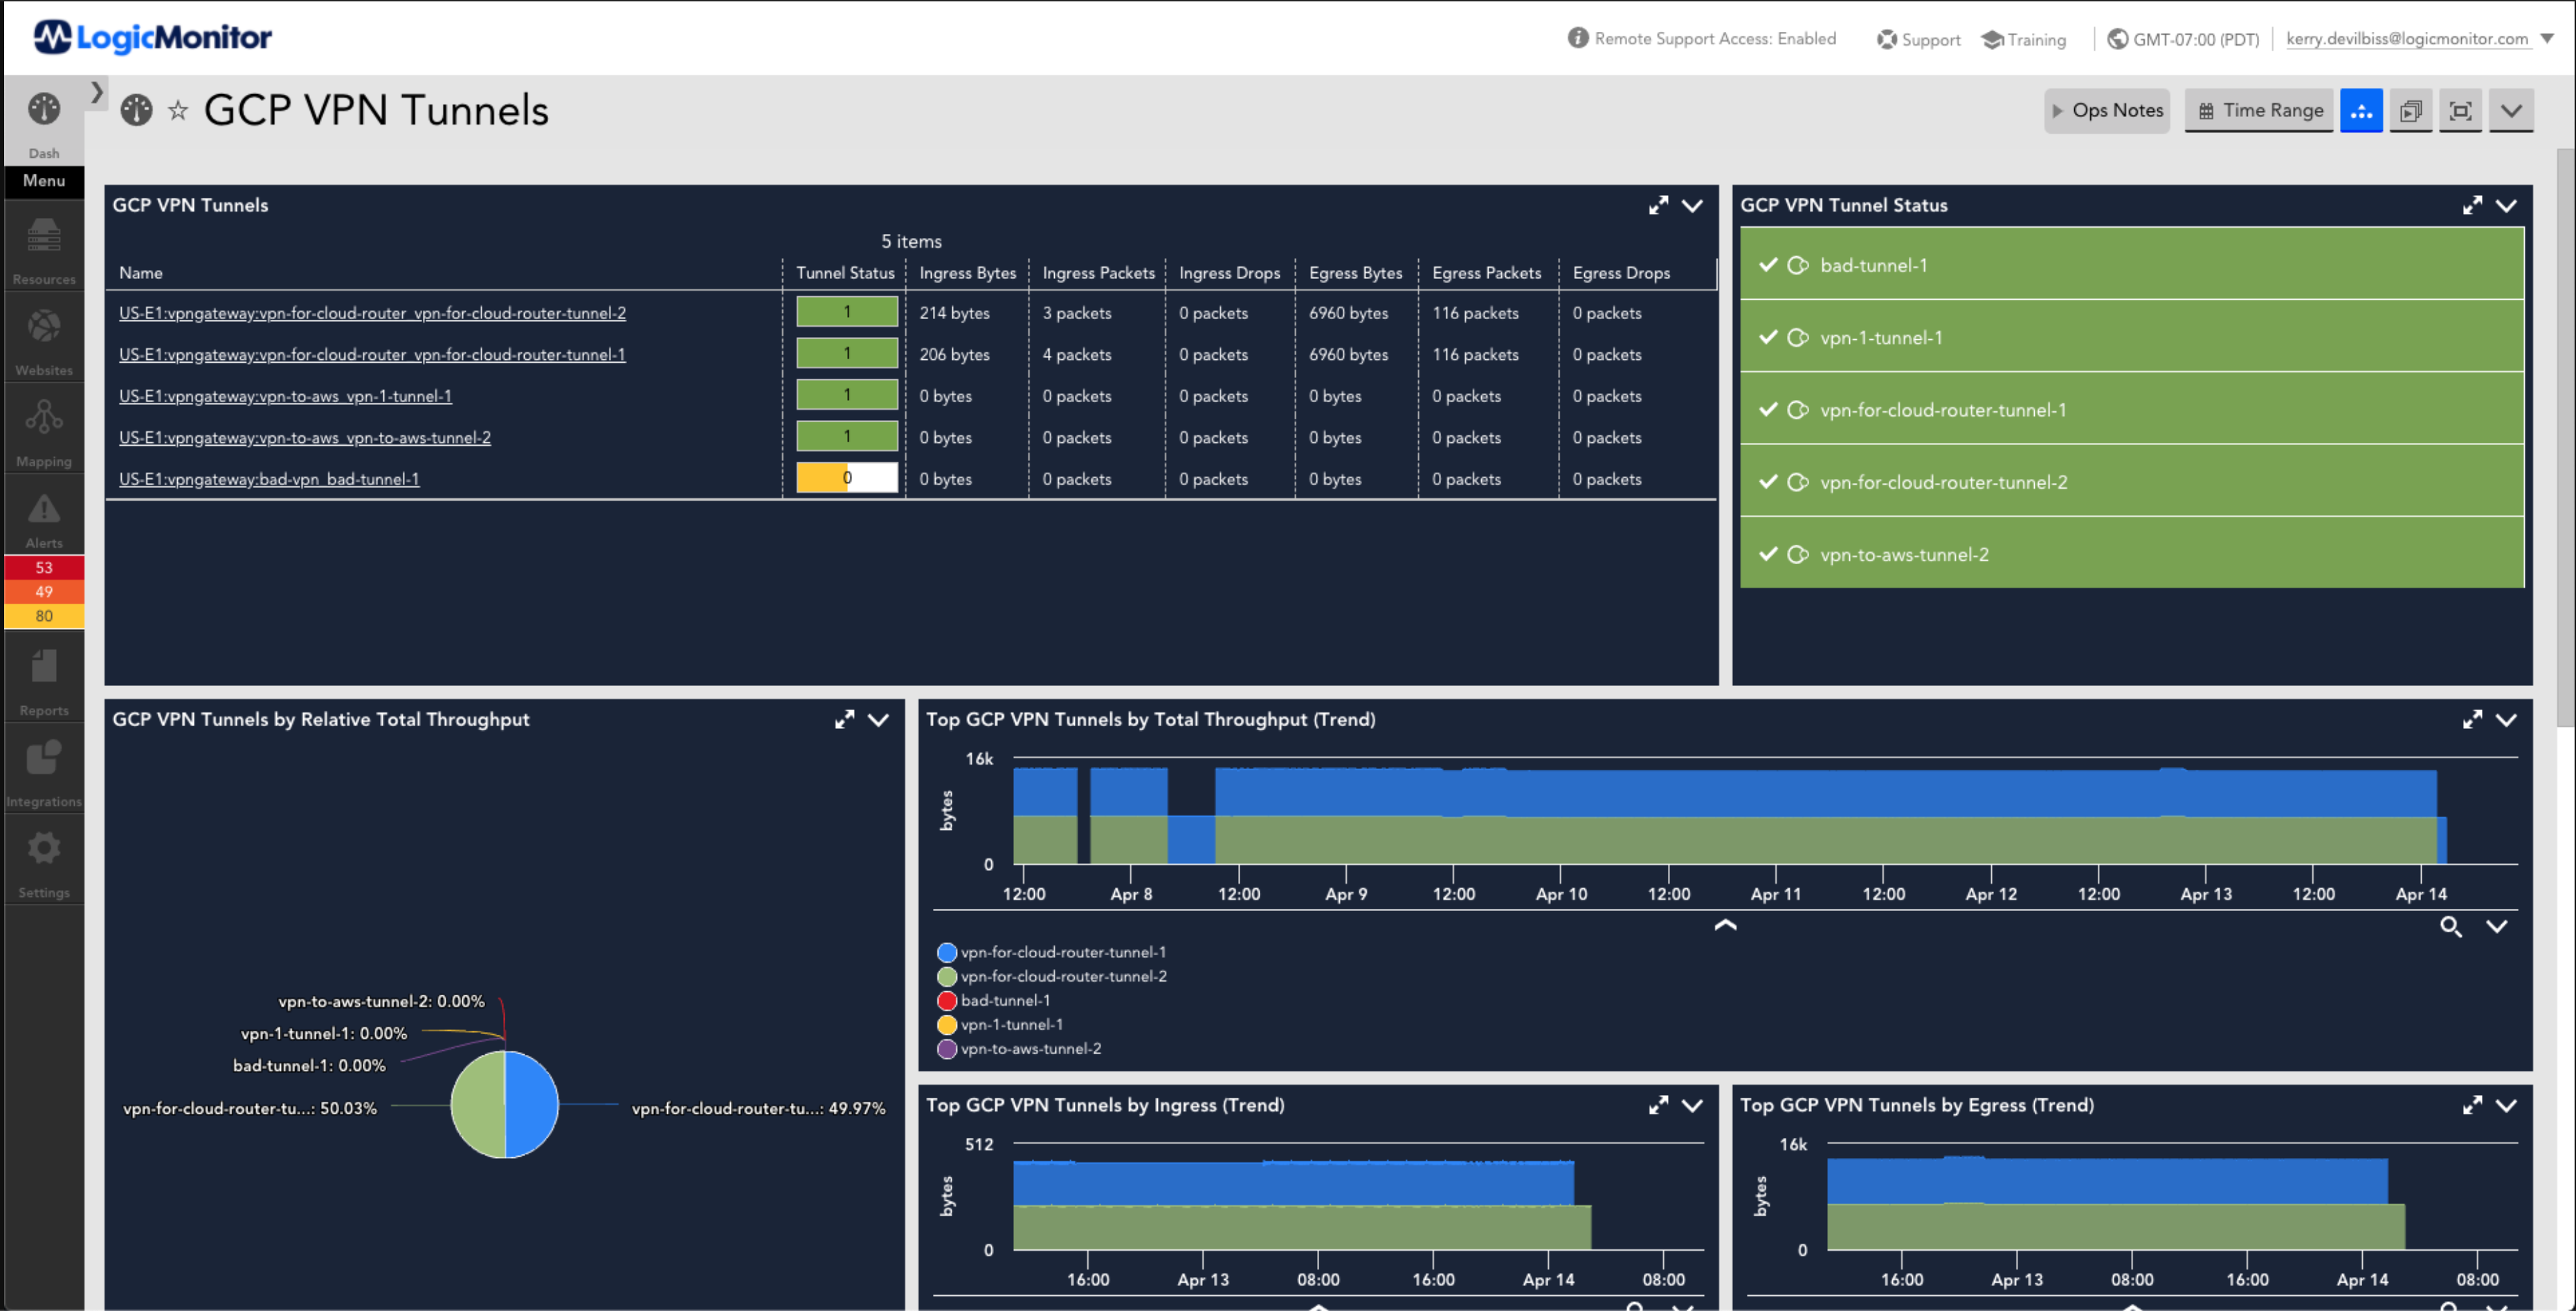
VPN Tunnel
Monitor AWS VPN connections to a VPC per VPN tunnel.
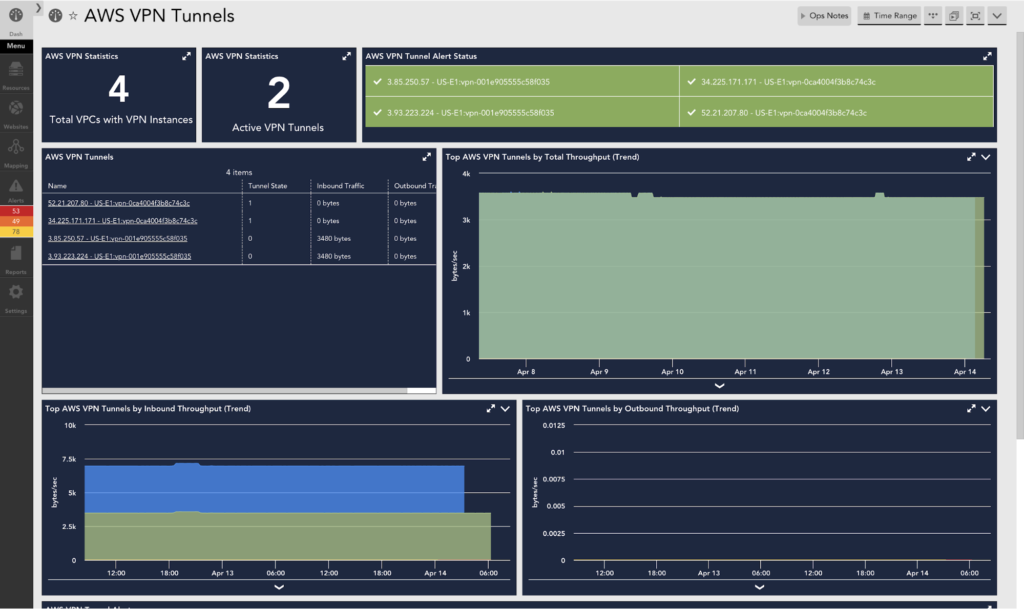
This dashboard provides an a listing of various metrics that are monitored for AWS VPN Tunnel Service. The metrics displayed are total VPC count with VPNs, active VPNs, alert status, VPN tunnels statistics, tunnel throughput over time, inbound throughput over time, outbound throughput over time
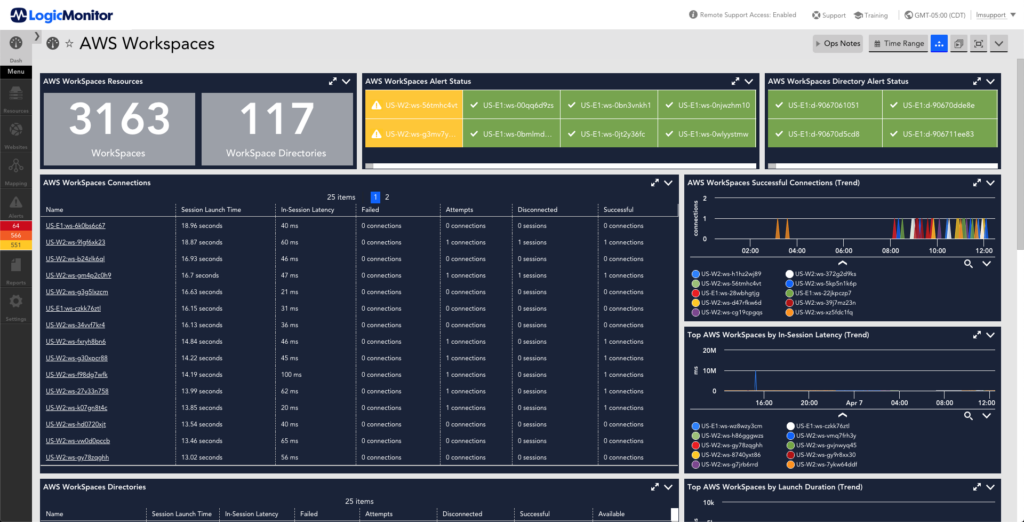
Workspaces
Monitoring for Amazon’s managed, secure, Desktop-as-a-Service (DaaS) solution.
Microsoft Azure
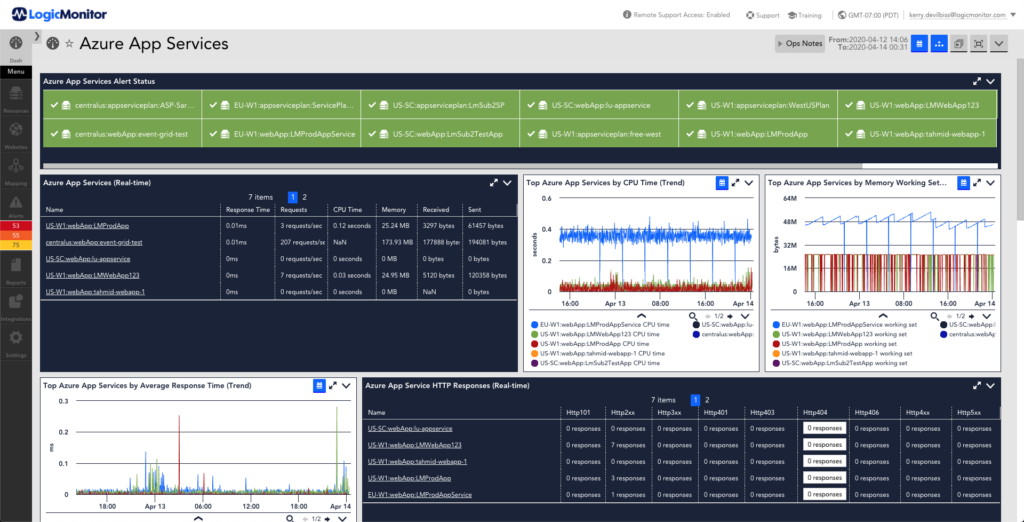
App Services
Azure App Service Plan throughput data, CPU and memory usage as well as disk and HTTP queue depth.
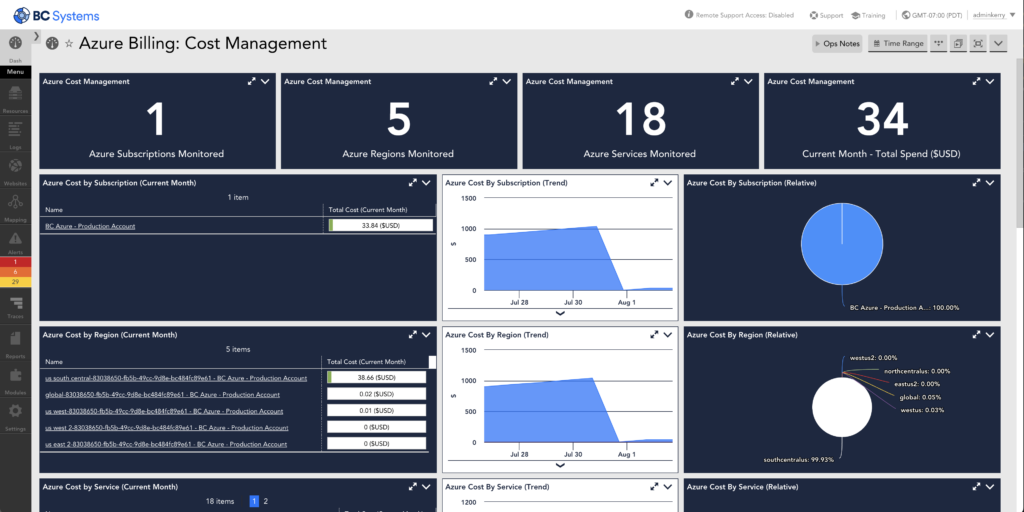
Billing: Cost Management
Visibility into your monthly Azure billing statistics.
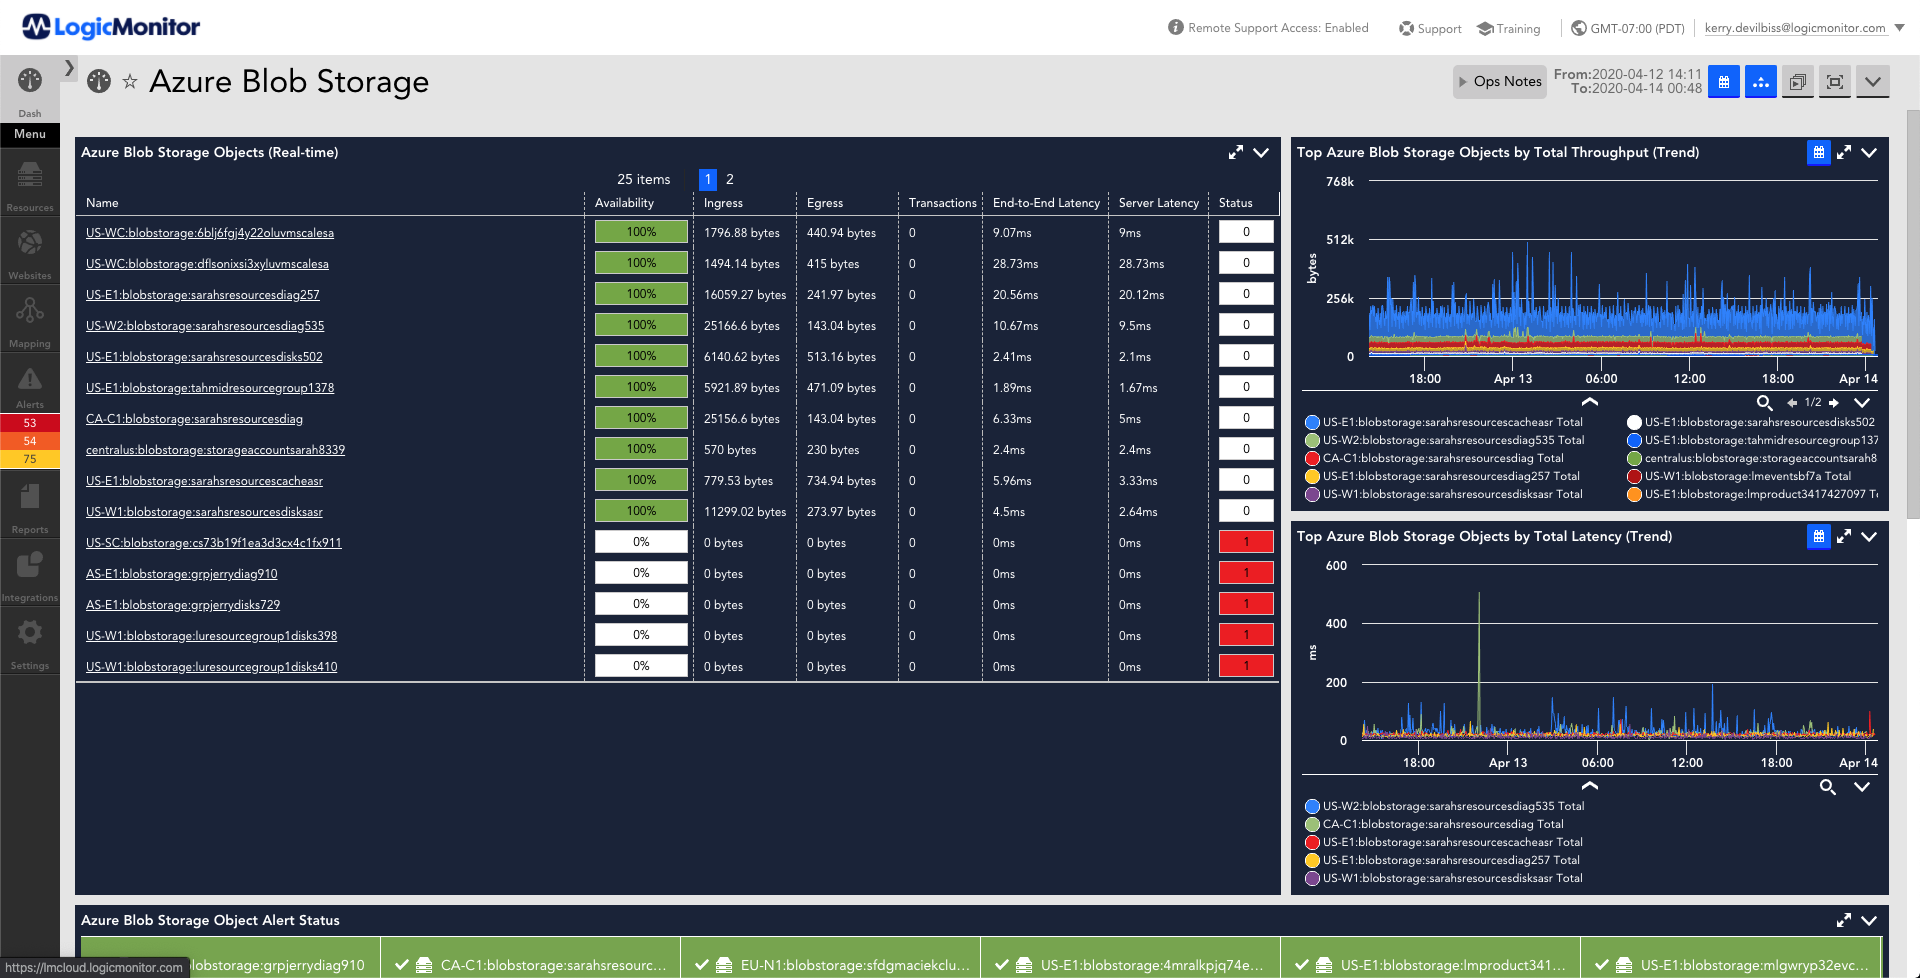
Blob Storage
Monitor metrics for Azure Storage Account Blob Services.
Express Route Circuits
Monitors Azure Express Route Circuit data bandwidth.
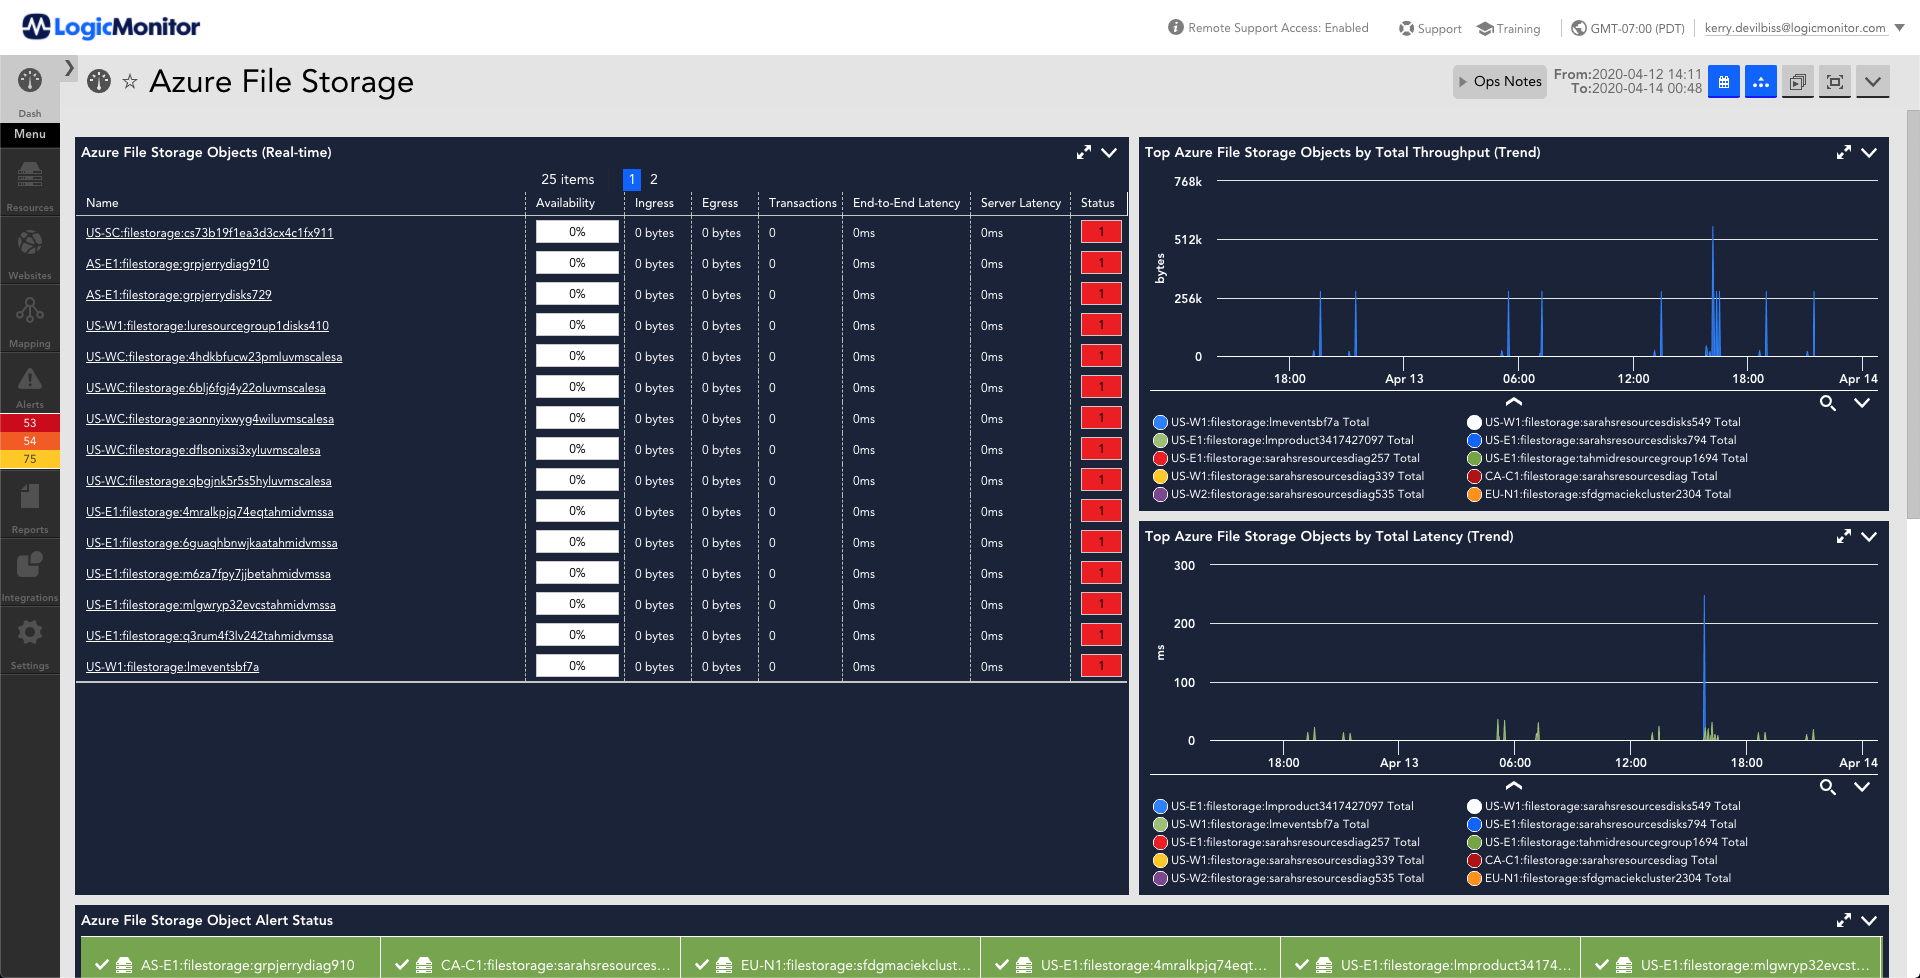
File Storage
Monitor metrics for Azure Storage Account File Services.
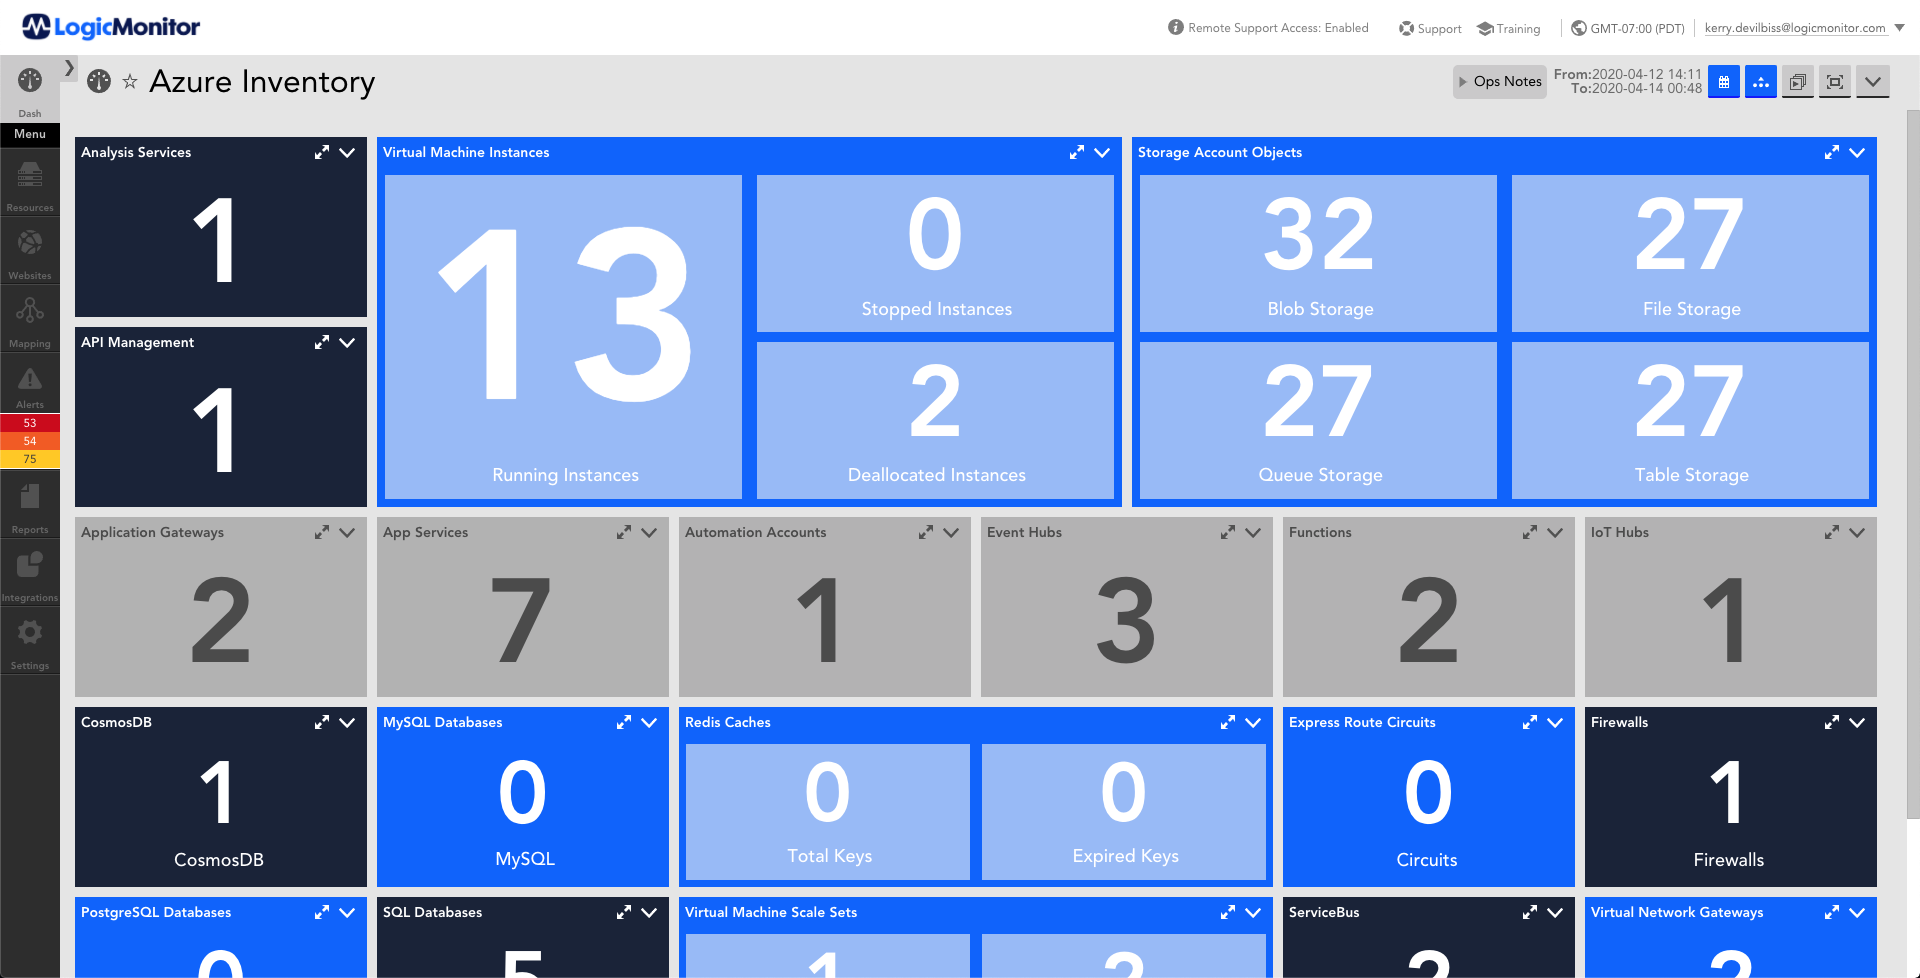
Inventory
Visibility into resource counts of your Azure environment.
MariaDB
Monitors the Azure Maria database connections, Database Transaction Unit (DTU) utilization, deadlocks, CPU and Storage utilization.
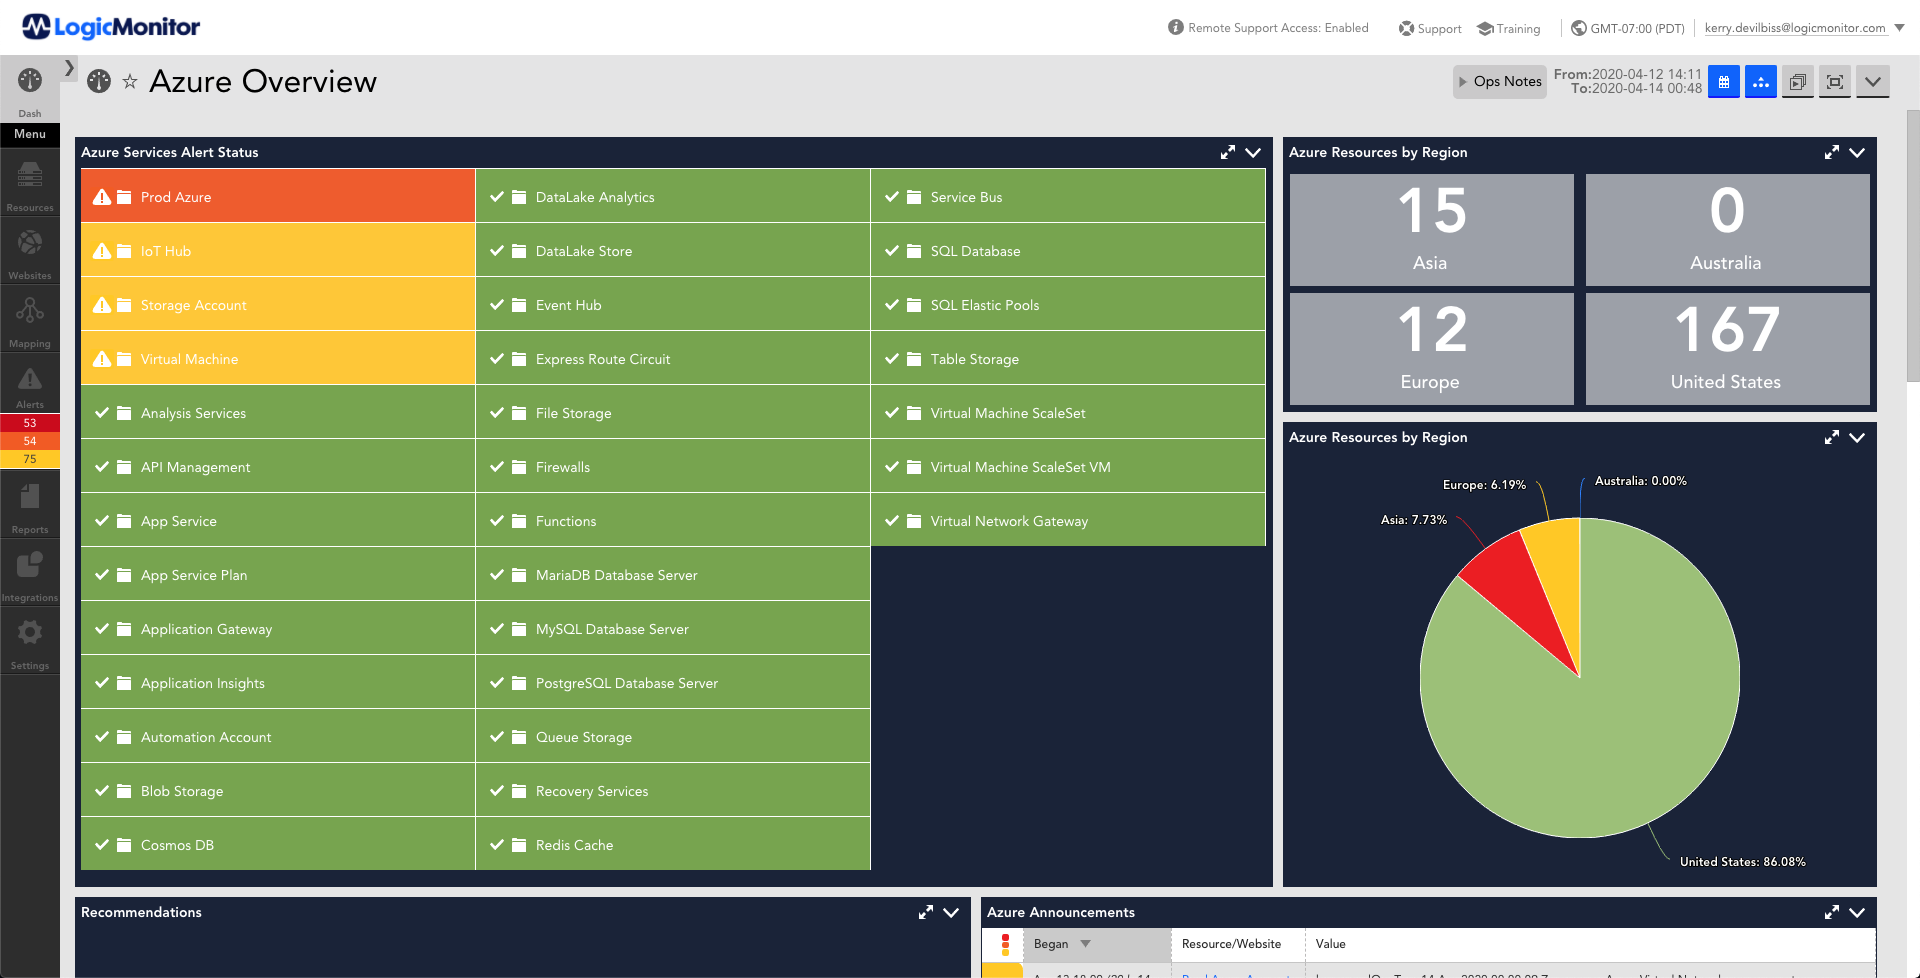
Subscription Overview
Visibility into your overall Azure environment.
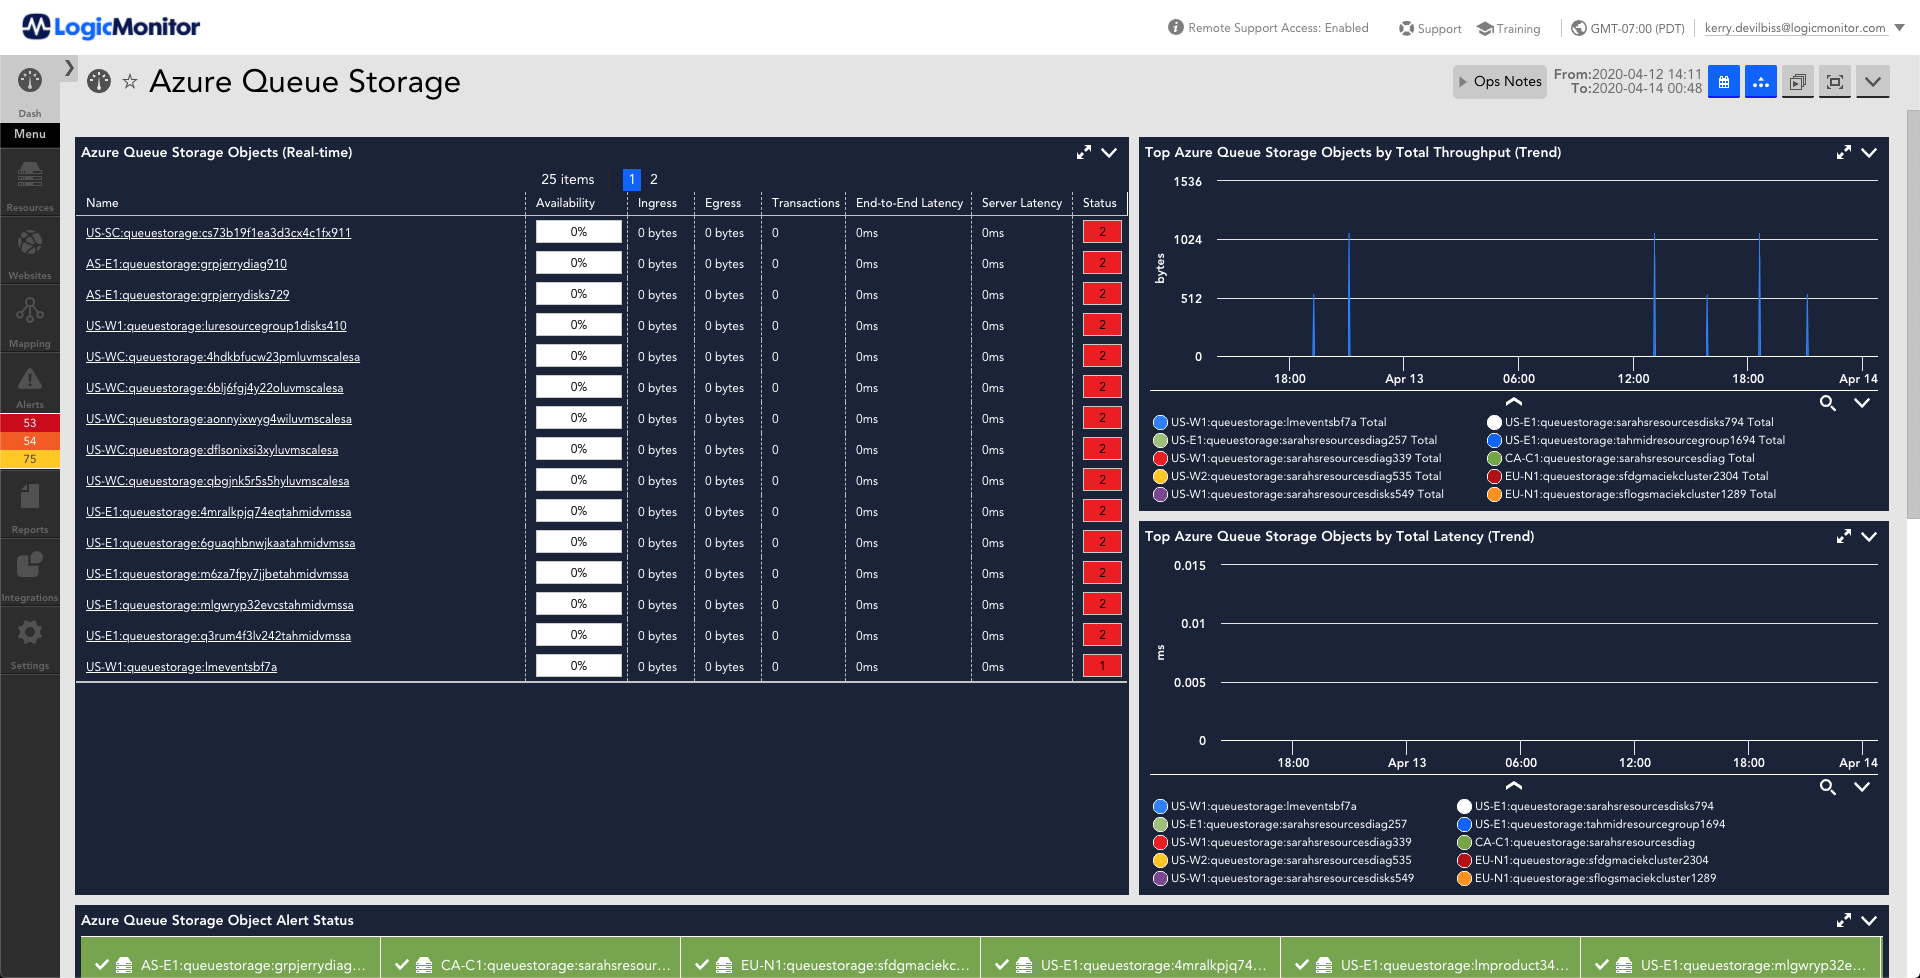
Queue Storage
Monitor metrics for Azure Storage Account Queue Services.
SQL Databases
Monitors the Azure SQL database connections, Database Transaction Unit (DTU) utilization, deadlocks, CPU and Storage utilization.
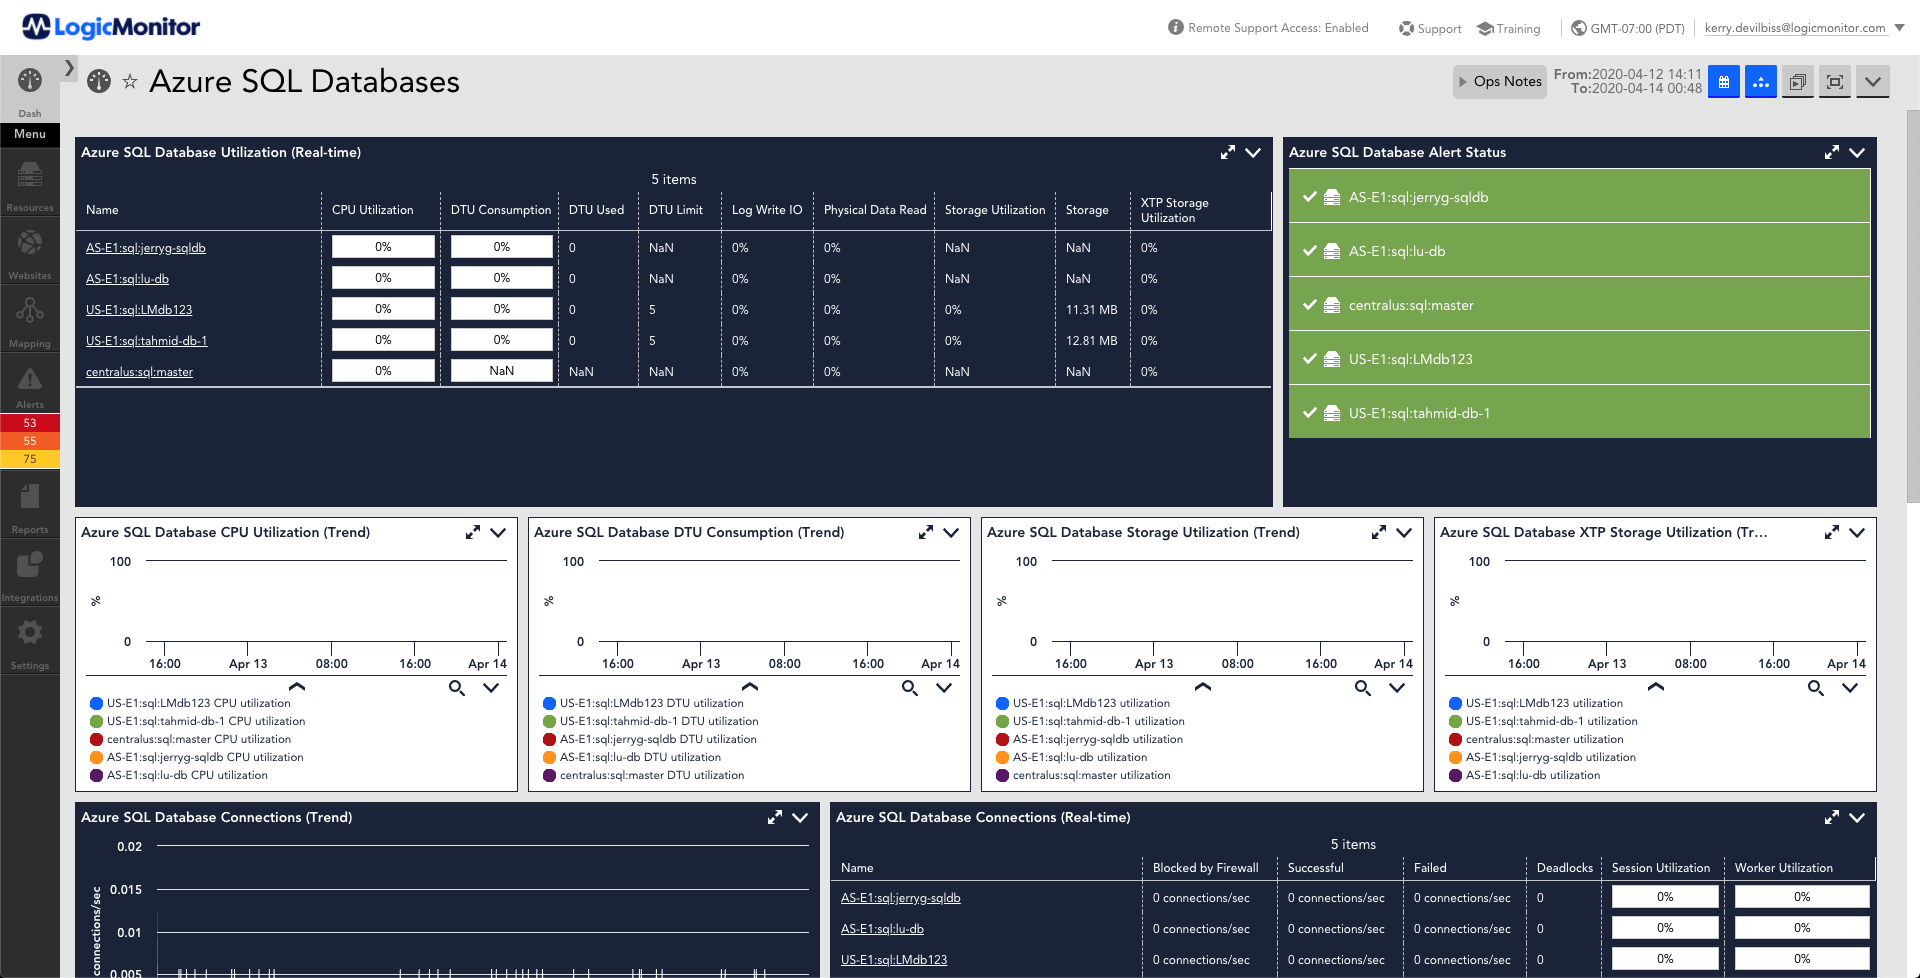
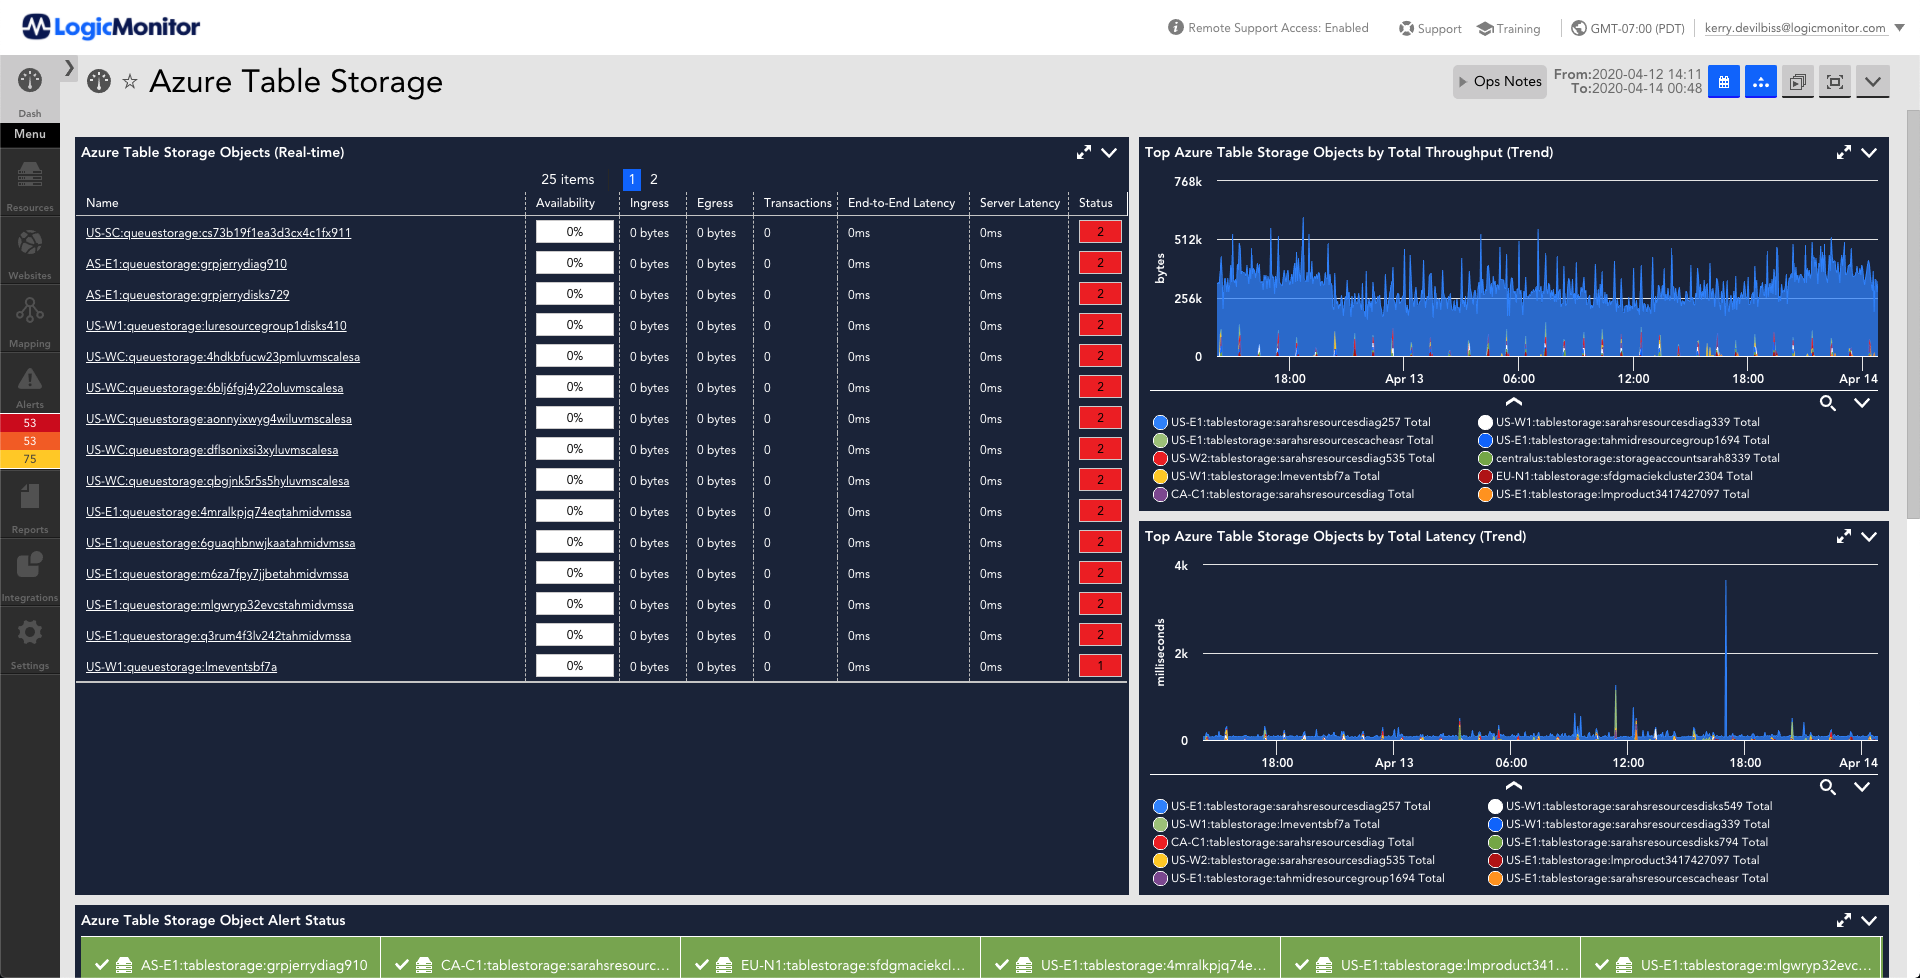
Table Storage
Monitor the Azure Table Storage performance metrics.
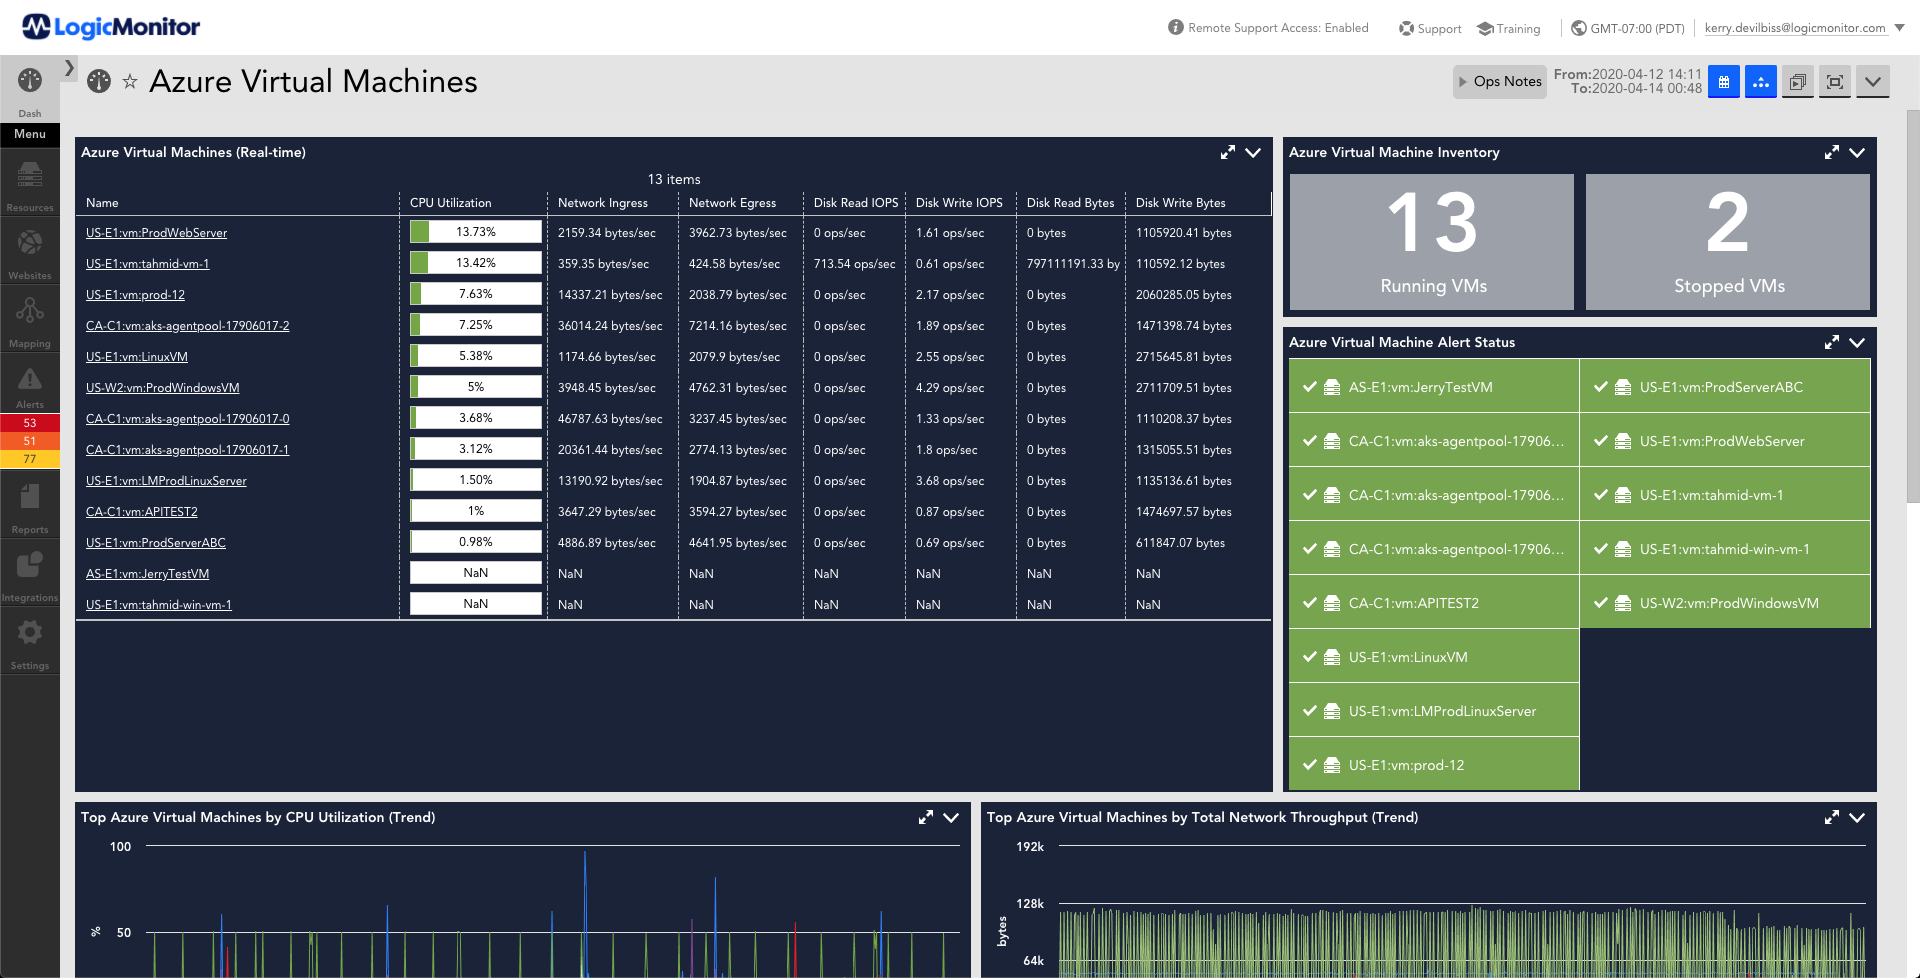
Virtual Machines
Monitors Azure Virtual Machine performance, health state, and availability.
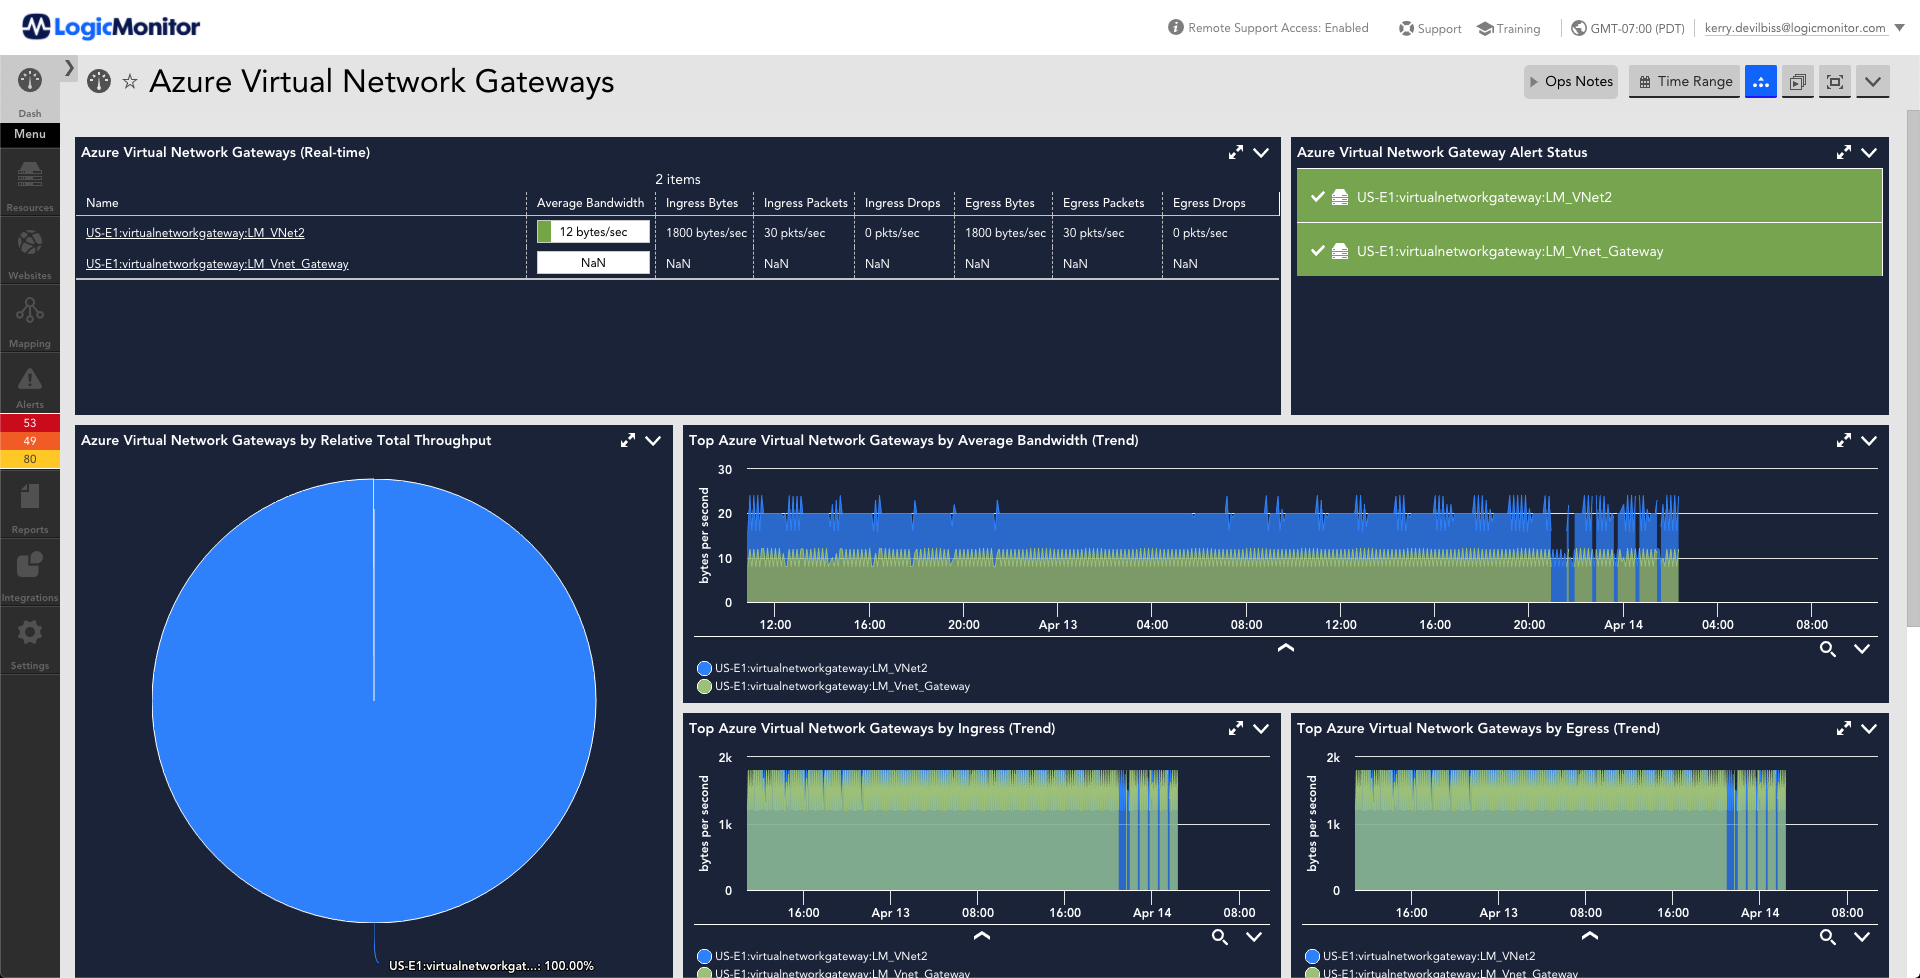
Virtual Network Gateways
Monitors Azure Virtual Network Gateway tunnel metrics.
Google Cloud Platform
App Engine
Monitors Stackdriver metrics for GCP App Engine instances.
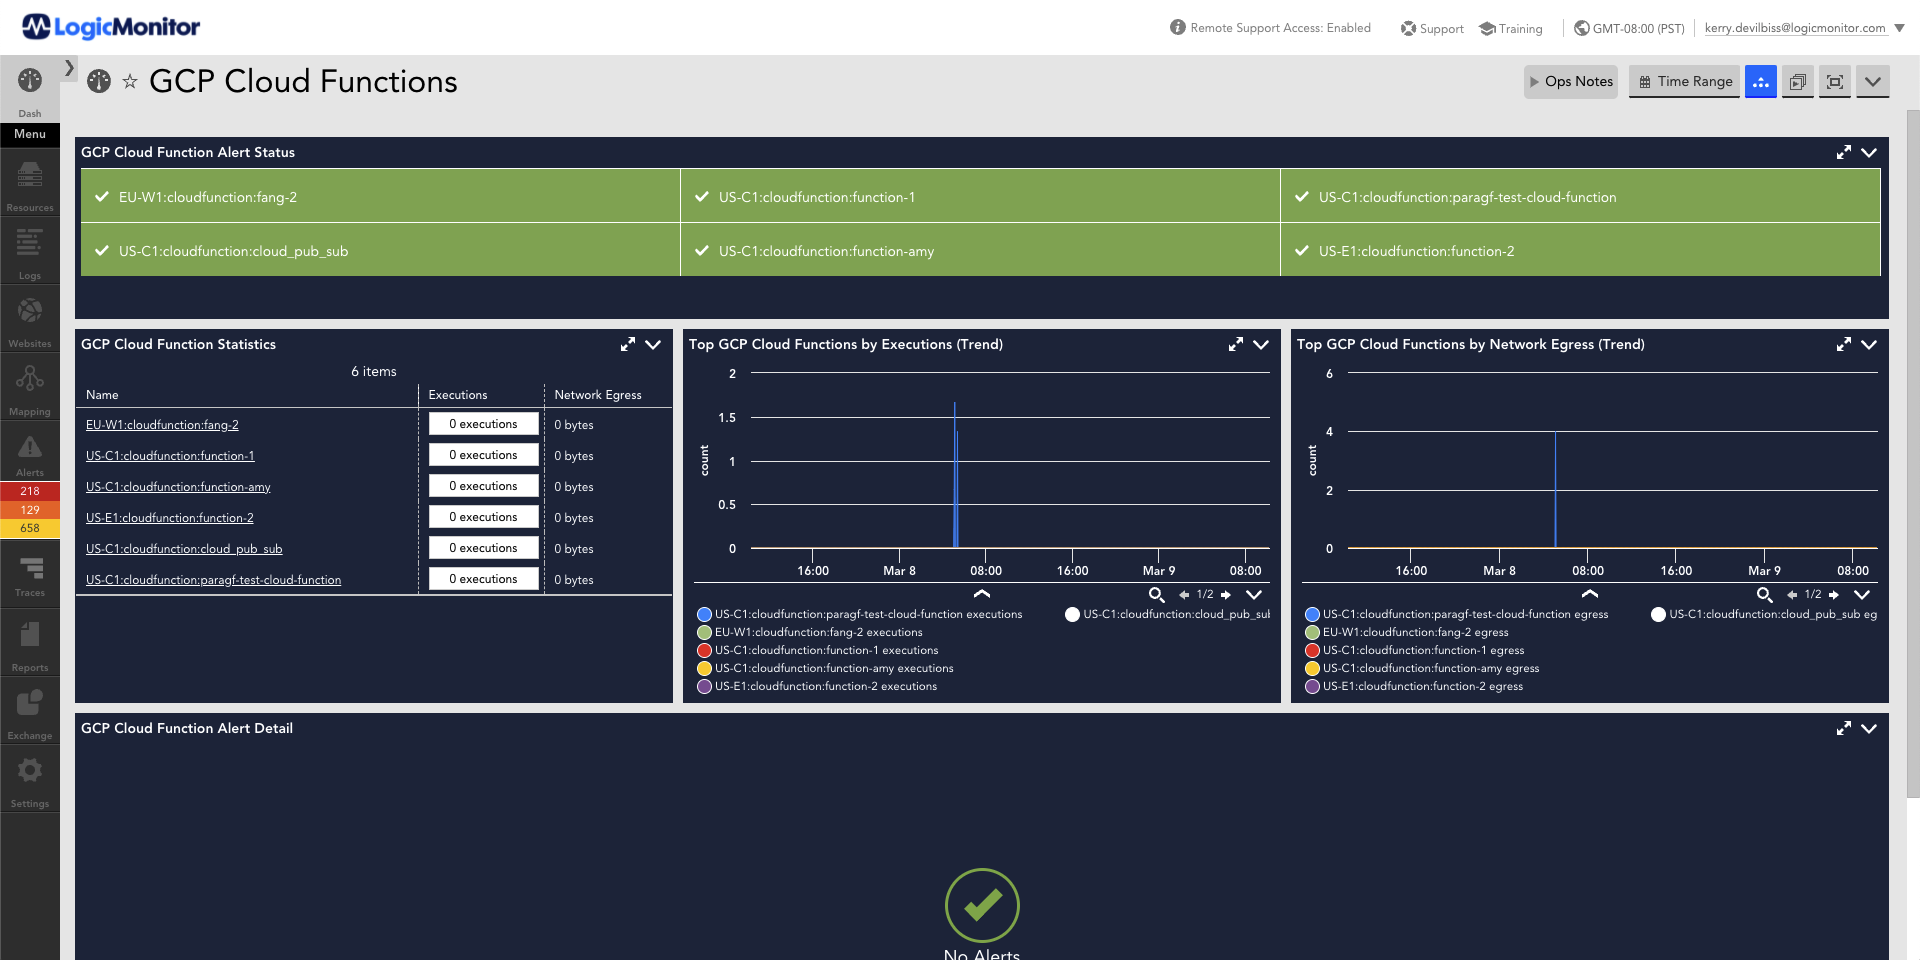
Cloud Functions
LogicMonitor’s GCP support automatically discovers and monitors Cloud Functions alongside the rest of your hybrid infrastructure.
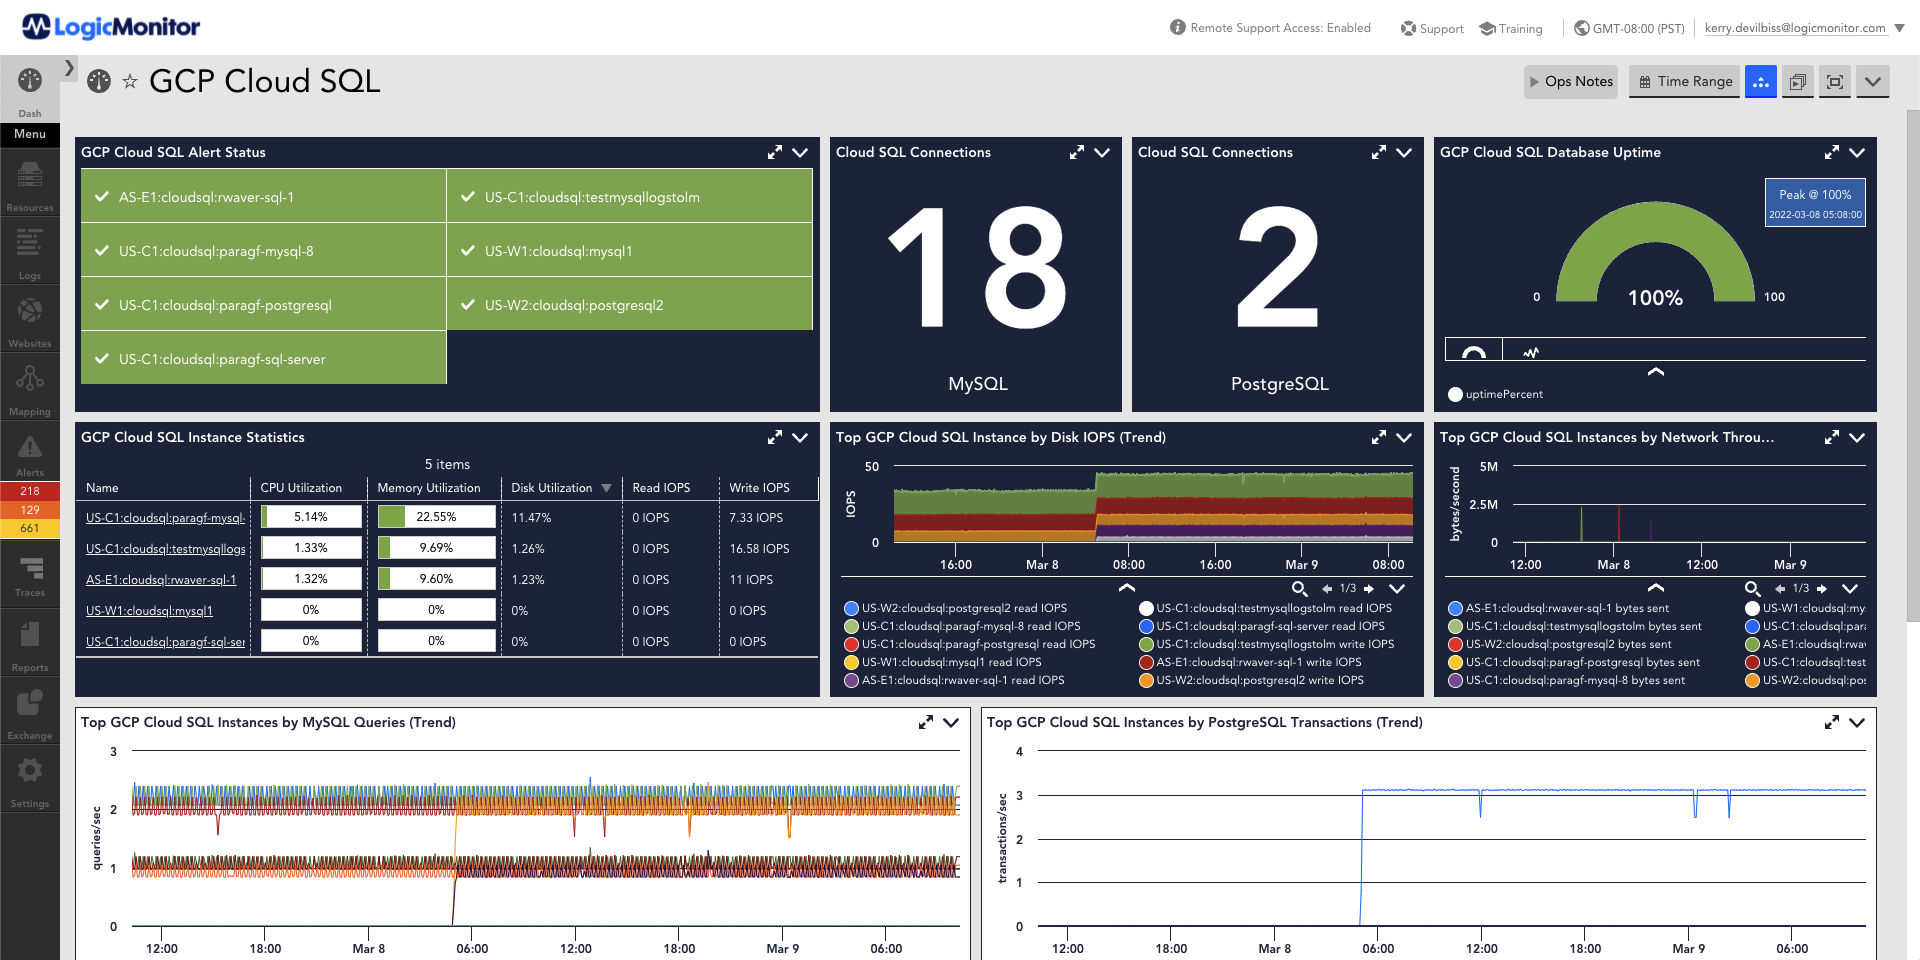
Cloud SQL
With LogicMonitor GCP support, Cloud SQL database instances are automatically discovered and monitored alongside the rest of your hybrid infrastructure.
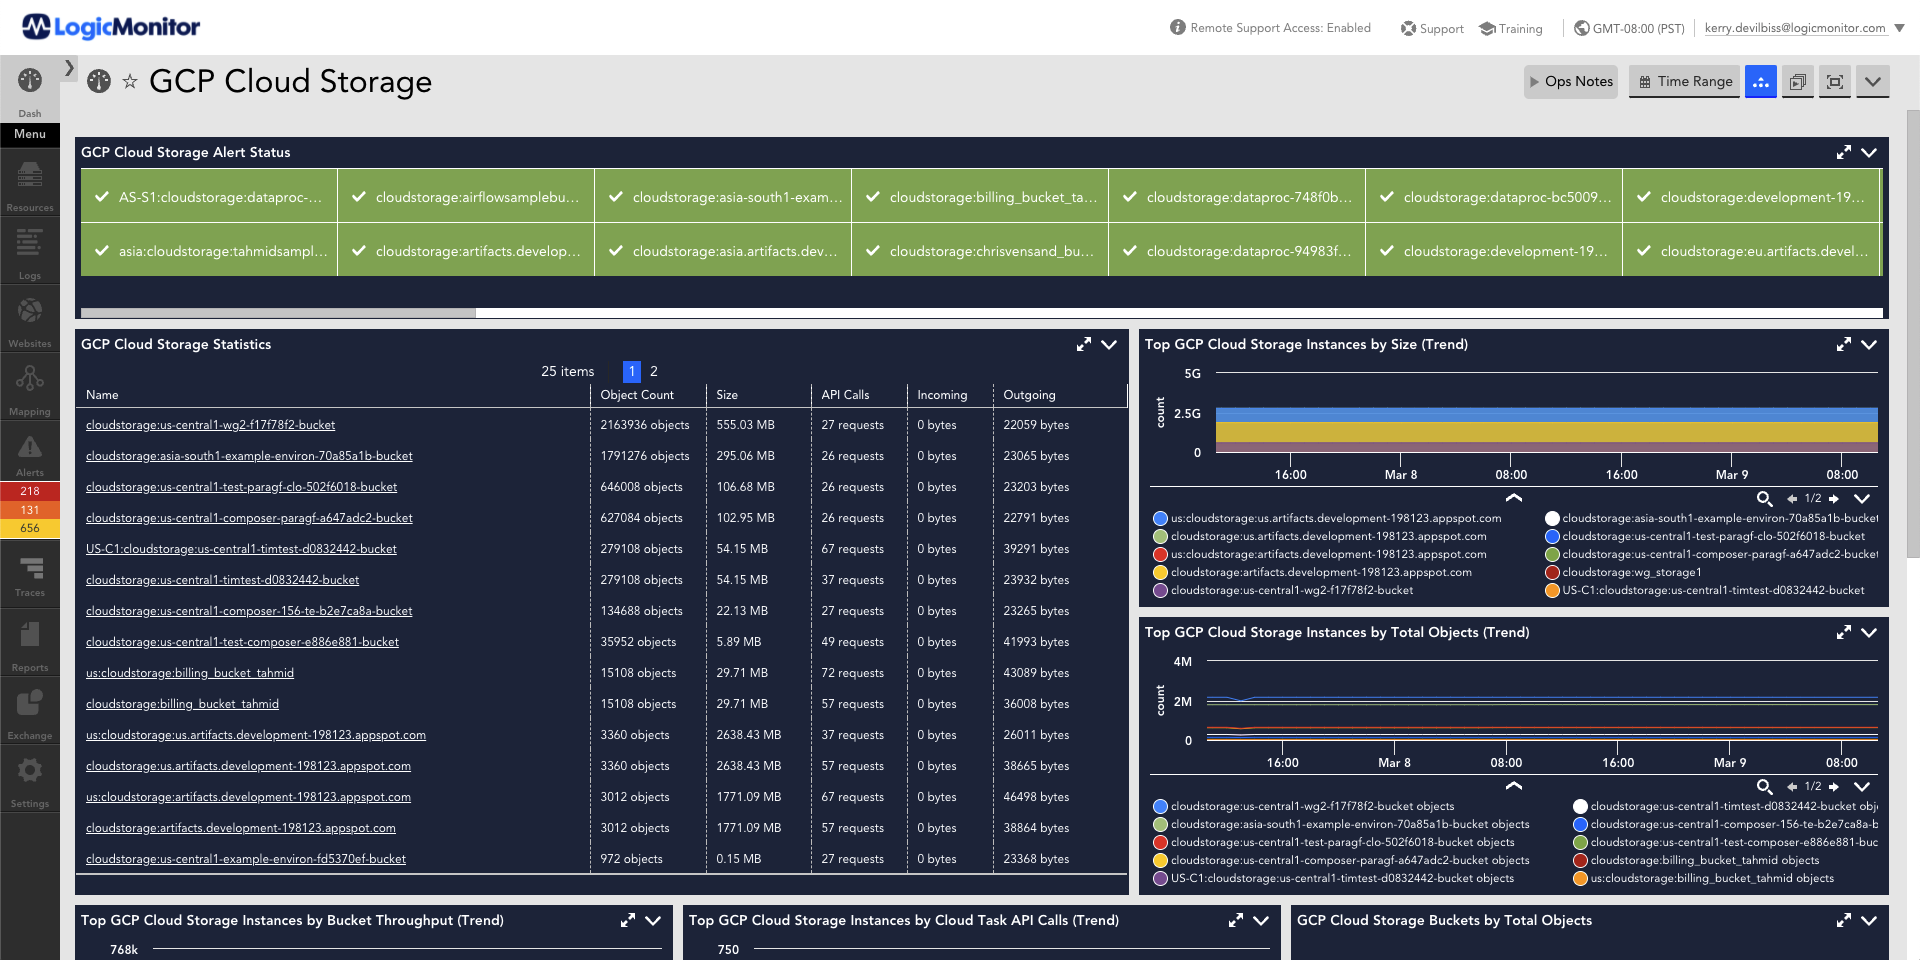
Cloud Storage
Let LogicMonitor help you understand and optimize your GCP cloud services so that you can focus on the important aspects of running your business.
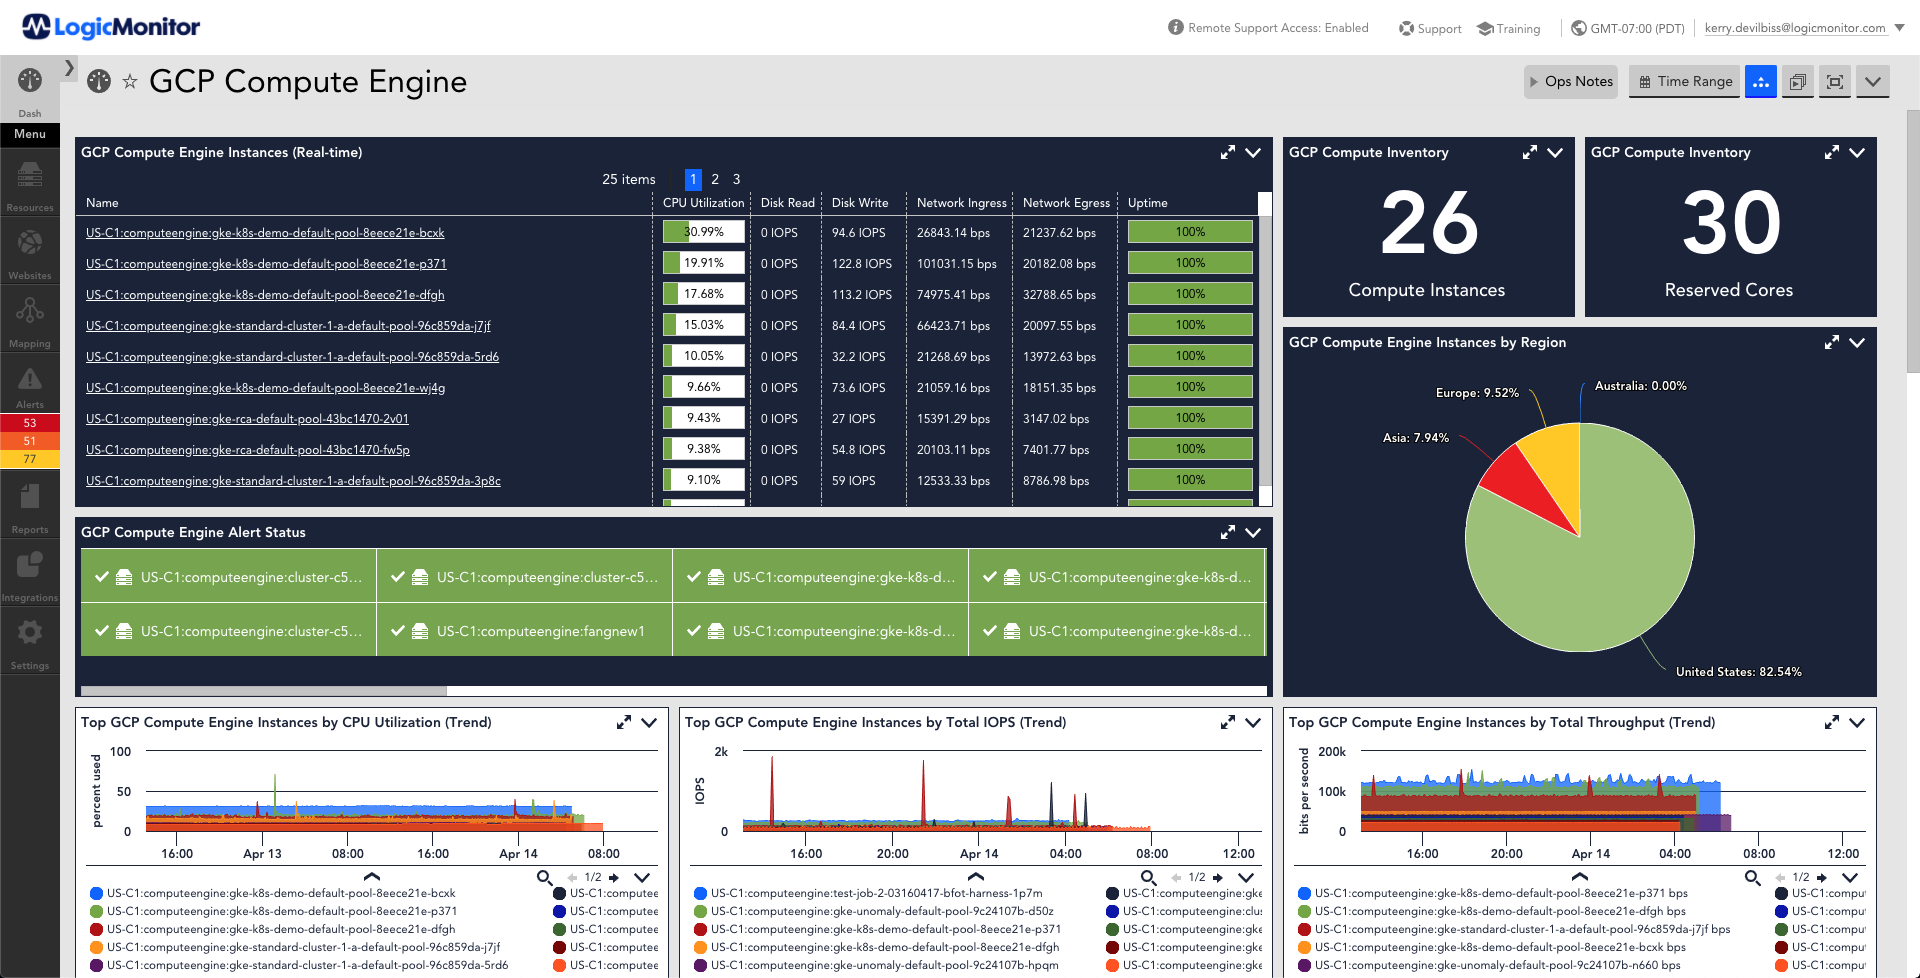
Compute Engine
Monitors Stackdriver metrics for GCP Compute Engine instances.
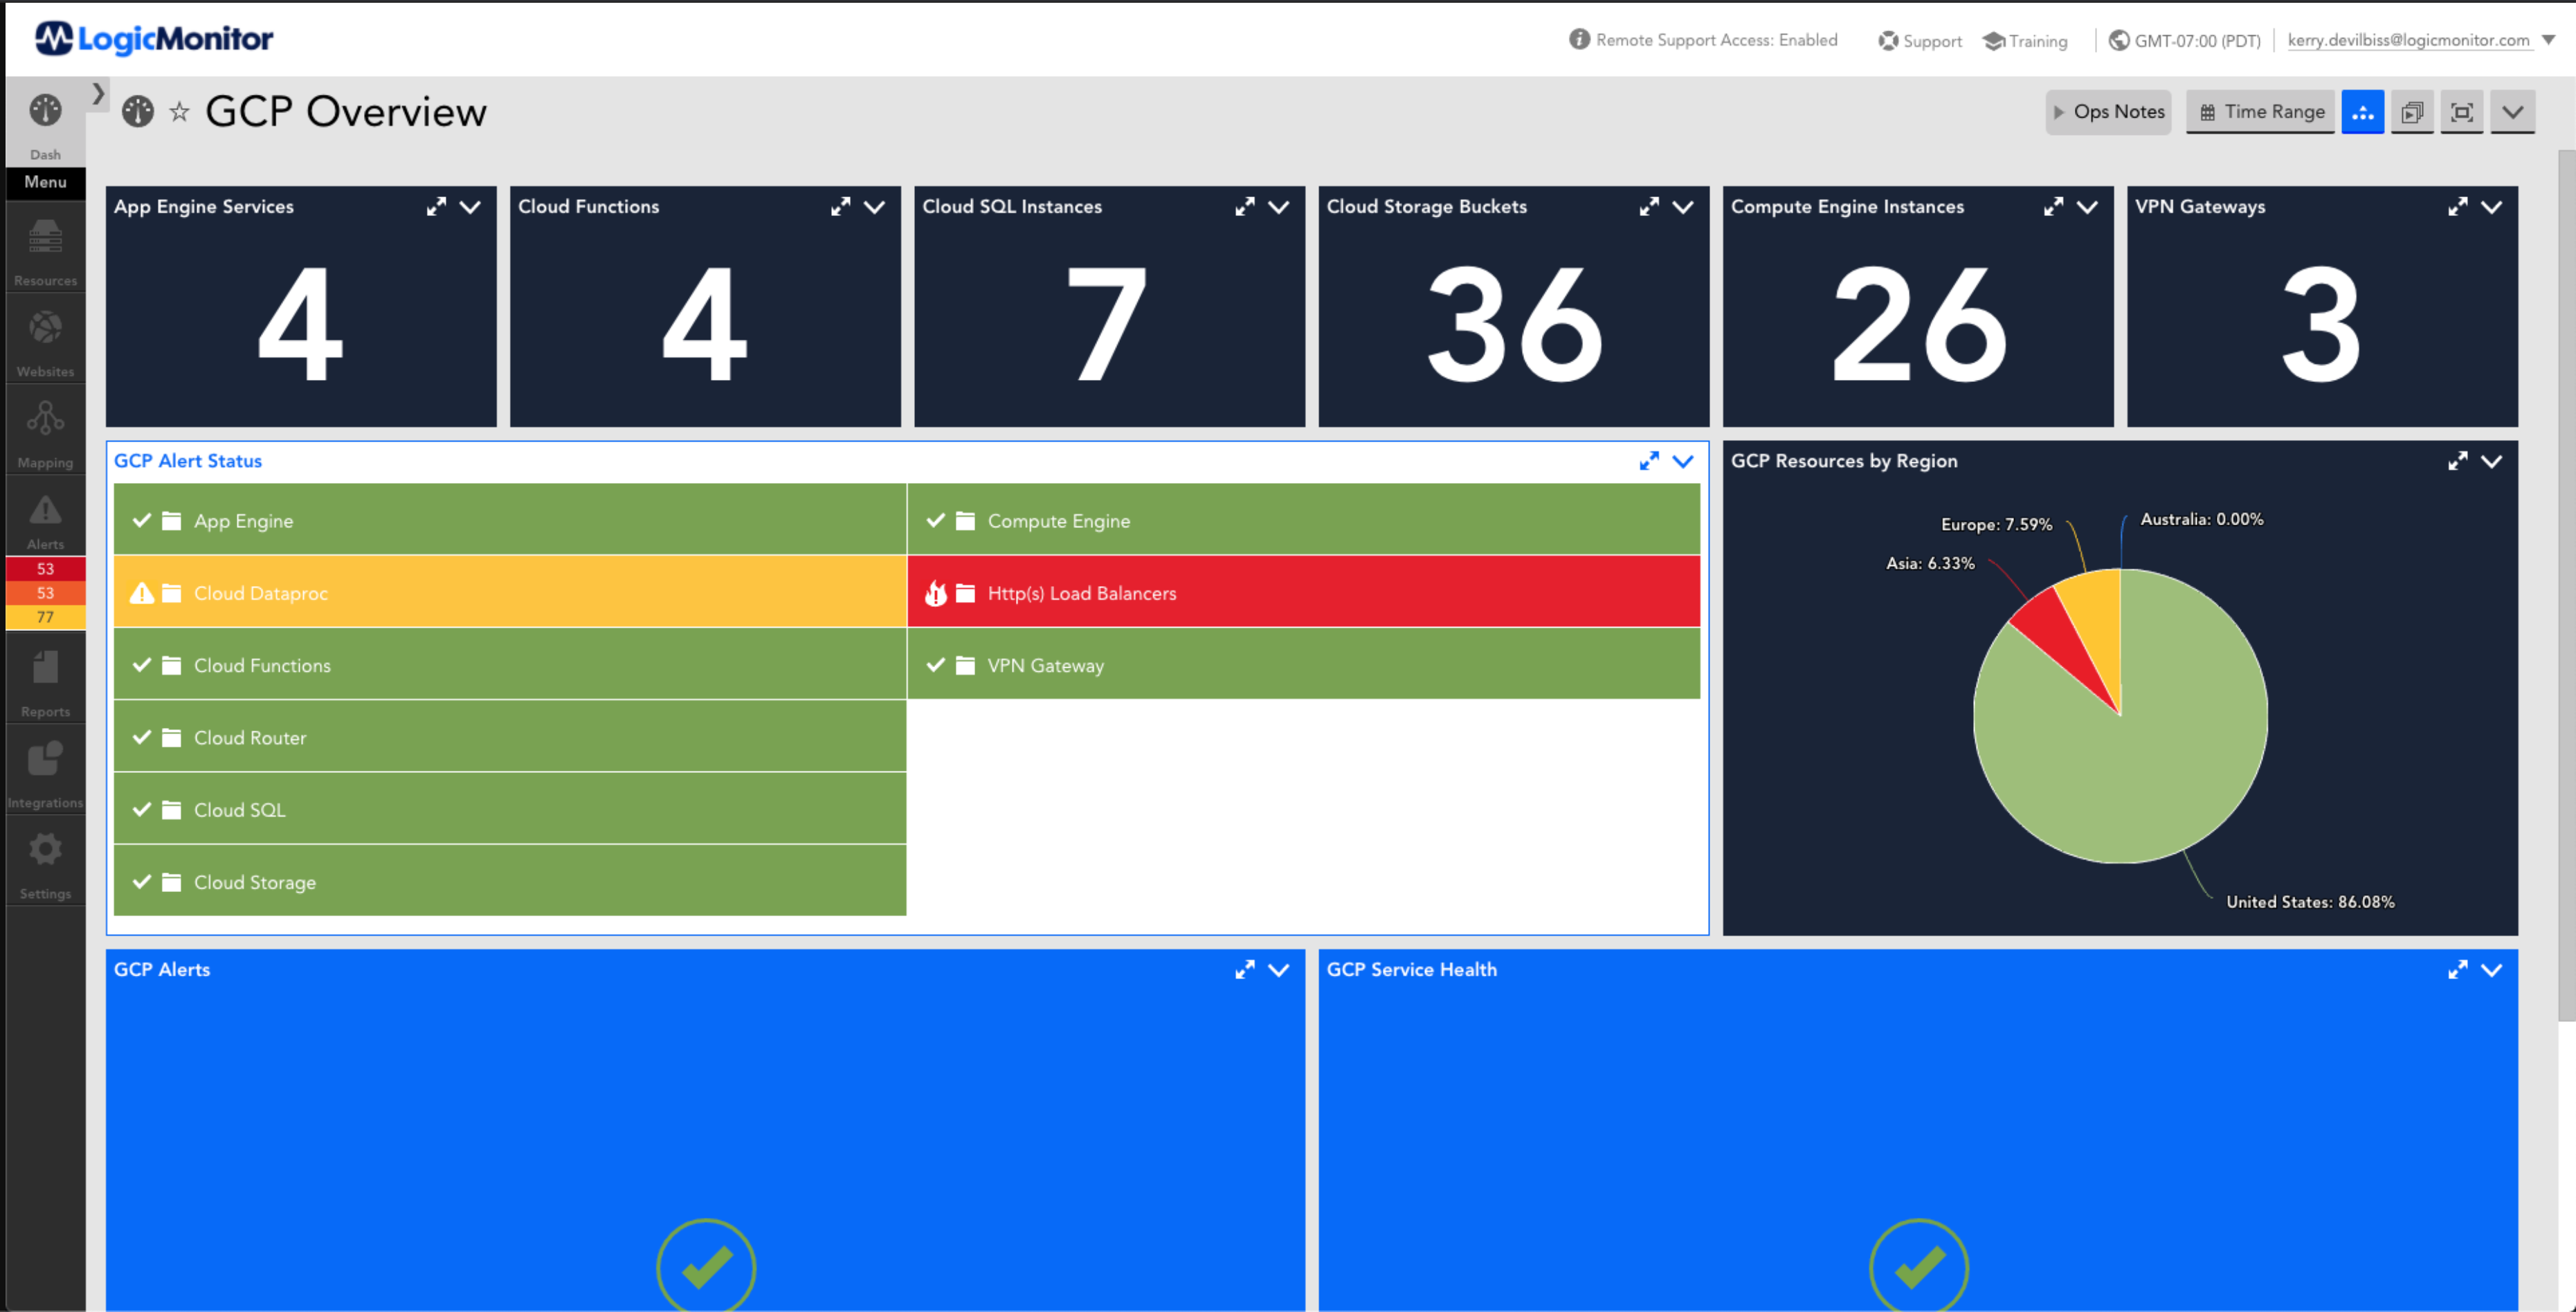
Project Overview
Get statistics on critical GCP Projects.
VPN Tunnel
Monitors Stackdriver metrics for GCP VPN Gateways per VPN tunnel.