“Hey, everybody. My name is Adam, and I’m one of the customer technical architects here at LogicMonitor. And thank you for joining us in this breakout session and at Elevate in general. Today, I’m gonna be talking to you about sustainability and how you can track your overall carbon footprint using logic monitors observability tools.
Now, as you probably heard in Christina’s Elevate keynote, there has been a twenty two percent increase in demand for capacity in data centers, which also means that there has been a huge increase in demand for power. Now if you haven’t seen one of these articles, I’d be willing to bet you’ll start seeing them soon where companies like Microsoft, Google, even Amazon are trying to find ways to basically power their own data centers. Because at this point, they either don’t feel like their current grids are reliable, or they wanna be able to use a specific type of energy that their grid maybe doesn’t even provide at all.
Now with the new wave of data centers that are coming along, like things along the AI automations or even potentially all of the cryptocurrency that’s being mined, there’s been a huge increase for demand in power. And not only is there an increase in demand for power, but there’s an increase for the elements that generate the power, such as, like, copper. For instance, it is being said that maybe even at the end of this year, we’re going to start seeing shortages in copper, and this is by some of the world’s largest metal traders that are warning, hey. At the end of the year, it’s possible we’ll start seeing these shortfalls.
But we know for sure that coming into the next decade, we’re actually going to be at a pretty large deficit. Numbers currently show that roughly our usage is around twenty five million tons. However, the supply is roughly around thirty million tons, and we’re expecting to be using thirty six million tons. That’s a pretty large deficit to be going into the next decade already at.
So definitely something that we need to be considering and be aware of.
Now you may be asking yourself as far as demand goes, how can we do something about this? Well, ultimately, we all have a part to play in how we design our automations, how we ultimately place our automations on our workloads, and whether or not we’re able to choose the type of power that is being utilized to fuel our workloads.
Now recently, an annual electricity report from the International Energy Agency showed that roughly four hundred and sixty terawatt hours were consumed by data centers in twenty twenty two alone. That figure is actually expected to rise closer to a thousand terawatt hours by twenty twenty six. To give you some context, this would be like adding the entirety of Sweden to a power grid on the low end and maybe Germany on the high end. That’s an amazing amount of power that is going to be in demand that really currently isn’t available.
Now you may be asking yourself, like, what are the numbers that we’re basing this data on? And if you’re anything like me, you probably haven’t looked too much into it, and you’re shocked kind of by what’s being reported. Because as you can see from a recent article from Guardian, the emissions being reported by companies isn’t necessarily the same amount of their actual used emissions or their consumed emissions, what they’re actually putting out in the world. And you can see at the top there, I have buying green energy does not mean consuming green energy. So you’re probably sitting there asking yourself, Adam, how can somebody buy green energy but maybe not necessarily consume it? Well, that’s something that they call REX or renewable energy credits. And, effectively, what this allows companies to do is say that they are buying green energy, and it allows them to lower artificially their reported numbers because it gives them basically a kickback.
Now it’s pretty wild if you start to break down these numbers and see something like Google is actually using two point seven times higher electricity than they’re reporting. If you look at something like Amazon at five point six times higher, Microsoft, twenty one, even Meta, the worse at thirty one hundred times higher emissions than what they’re actually reporting, which is kinda crazy that they’re even allowed to do that. Right?
Now these things really truly do matter. And if you’re in a situation where you feel like maybe it doesn’t matter to your company, one thing that you can start surfacing is the fact that the companies that actually have ESG related claims do better overall from a growth perspective than companies that don’t. We recently saw an article where basically any company that had ESG related claims and were attempting to meet those had a one point seven percent growth over companies that didn’t. That alone is easy money that could be in your pockets. All you have to do is start thinking about how you can optimize your workloads to use renewable energies.
Now let’s talk about something else that even if your company is not interested in looking at renewable energies or trying to, you know, track their carbon footprint and their emissions overall for their own perspective, it’s possible that soon they’ll be legally required to report these numbers. The corporate sustainability reporting directive is effectively a legal is effectively a legal obligation that forces companies to provide a reporting mechanism showing them how much power was consumed and where it was consumed from. Now we’re not here to necessarily talk about whether or not your company is actually part of the CSRD. We would recommend that you look into the CSRD omnibus, which will give you kind of clarifications. But generally speaking, it’s gonna be affecting around fifty thousand companies, and they’re predominantly larger companies that operate out of the European Union.
Now you may be asking yourself from a logic monitor perspective, what are we going to do to help you with this? Well, we have two main key objectives here. Reporting is the number one thing. The moment that you’re affected by the CSRD, you’re gonna need to provide accurate reporting in order to show your overall power consumption and numbers. With our metadata model, we already have the reporting capabilities and the numbers needed by pairing up with a company named ElectricityMaps.
With ElectricityMaps integrated data source, we’re able to reach out to them as long as we have your location’s data on your resources. We kind of know where that particular power is being pulled from using the electricity using the electricity maps API. Once we have that information, we’re then able to compute your overall carbon footprint and your carbon intensity score and track how that is particularly performing over time. Now we also wanna allow you to optimize your workloads by using our resource explorer and our dashboards to basically visualize this information and use our filters to go in and see maybe where a particular application, region, or team is using more or less particular energy than they need and how you might be able to move that particular workload to a location that has more efficient renewable energies.
Now let’s go into a demo where we can actually see the solution running.
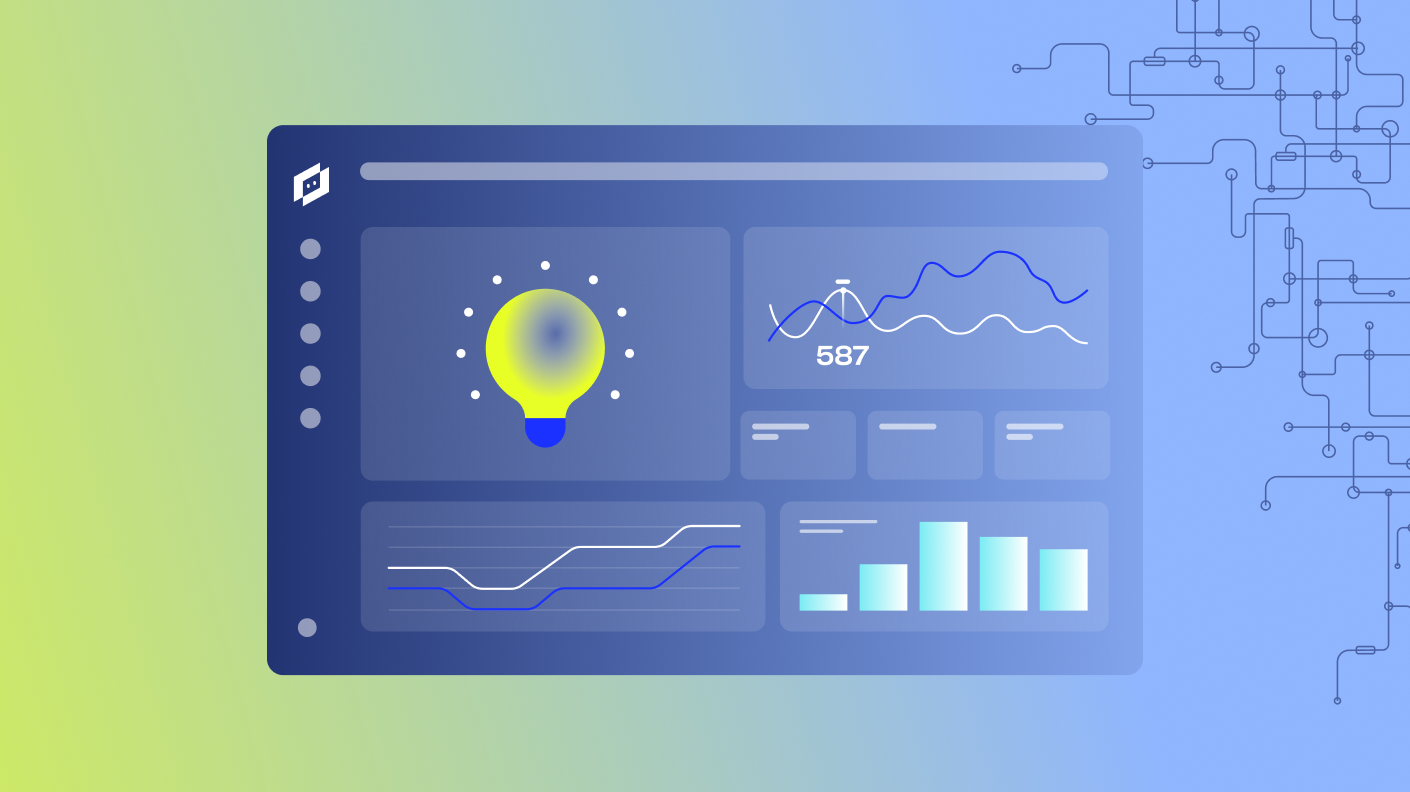
Here we are in LogicMonitor and I’ve got a resource where I’m already using our automatically discovered data sources to find power information. Now here you can see on a dashboard, I have this filtered down to the UK region. And in the top left hand corner, I’m able to show what types of energy are currently being utilized to the resources that this is filtered down to. In the middle graph here, you’re able to see overall energy consumption and renewable versus nonrenewable.
On the right hand side, you’re able to see the predicted and forecasted consumption versus actual consumption. And down below here, you’re actually going to see where we are basically coming up with your overall carbon footprint. Now on the left hand side, this is the overall power consumption of these resources, and I want to call your attention to something. For the most part, this is like an average graph.
You can see our power consumption is not really actually going up or down, but for the most part, it’s a steady line. However, on the bottom right hand side where our carbon intensity is, you can actually see that we are increasing our overall carbon footprint. Now this is likely because of some workload that is enacted that is using nonrenewable energies.
Knowing this type of information would allow you to go in and potentially move that work load to another location where you are using renewable energies, lowering your overall carbon footprint, helping you reach your goals. Now that is overall sustainability and how we are able to kind of monitor your carbon footprint, your carbon intensity, and help you make powerful decisions around those workloads and what type of energy that you’re utilizing. If it’s something that you’re interested in signing up for, please let your account manager know, and we hope that you enjoyed this year’s Elevate. And if you weren’t able to make it, please try to attend next time, and we’d love to see you.”


