The Test and Step tab displays each scripted browser check recorded in the form of Steps. This tab is available for Synthetic resources on the Resources page. Each Test is treated as an individual device, and each Test consists of multiple Steps that represent the different operations of your website. This helps you to navigate through all of your website’s operations easily.
The Test and Steps tab displays the test data using the following visual components:
- Test and Step Graph— Displays the step data allowing you to visualize the performance of your website.
- Test and Step Table— Lists all the runtime test data in a tabular format.
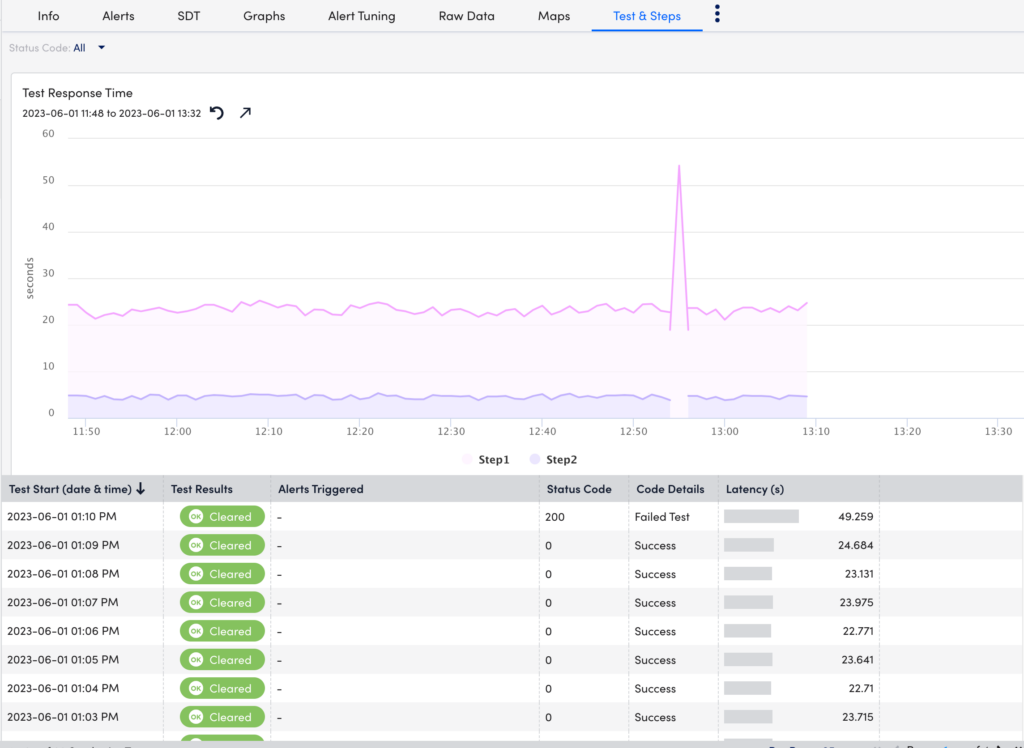
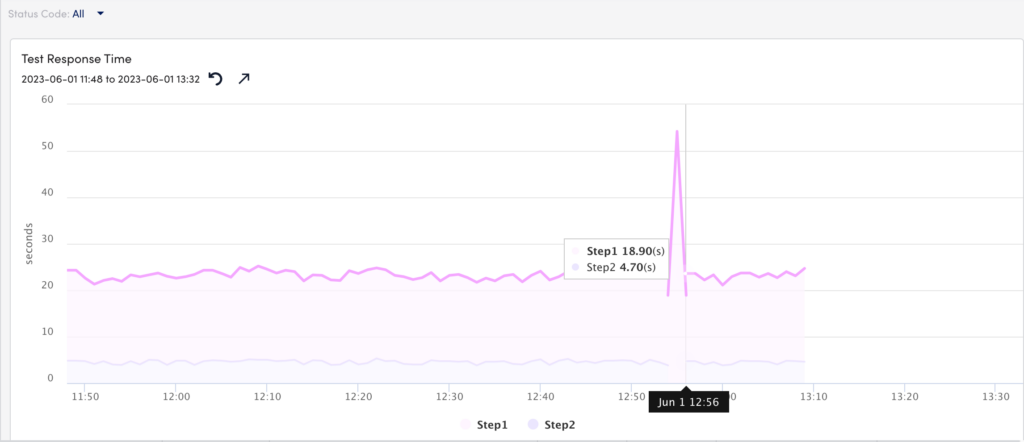
Test and Step Graph
A unique colored graph represents each Step. This allows you to compare the different operations for your website.
Test and Step Table
The runtime data is elaborated for each Step. Additionally, you can filter the table based on Status Code. For example, when you select 23(Command timeout), the table displays only the information with that status code. The fields in the table are detailed below:
| Field | Description |
| Test Start (date and time) | Displays the starting time and date of the Test. |
| Test Results | Displays the Test results for the different Test Start times. The different results are as follows:
|
| Alerts Triggered | Displays the total number of alerts triggered for that Test. |
| Status Code | Displays the status code of the test. For example, the status code “0” indicates “Success”. |
| Code Details | Displays the status code details. For example, the status code “10” indicates code details “Test Skipped”. |
| Latency (s) | Displays the time period from initiating a request to getting a response. |
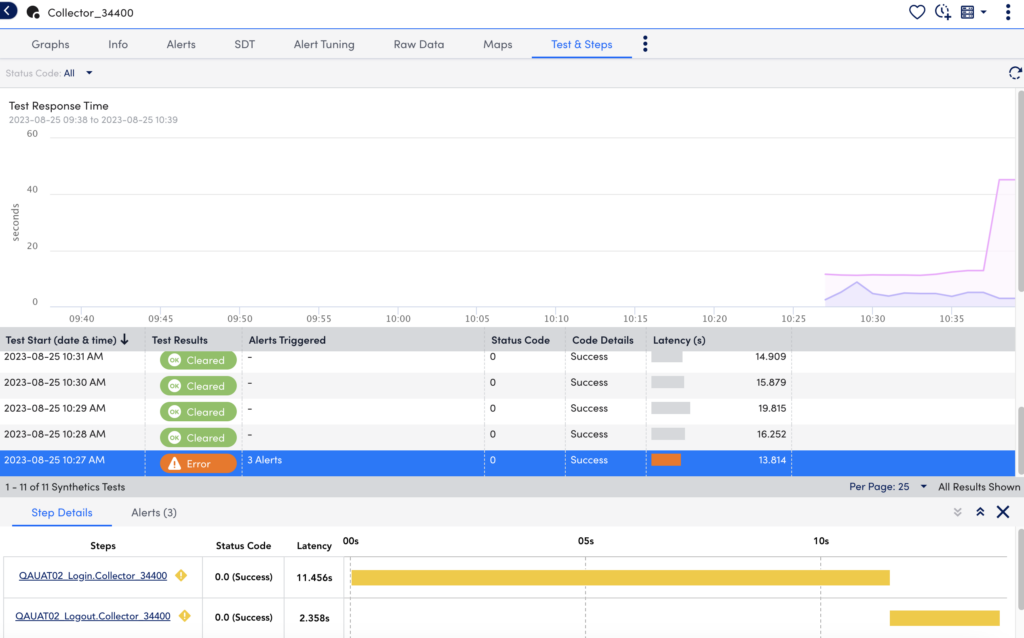
Viewing Step Details
You can select a Test from the Test and Step table to view its associated Steps details. The Step details include the Status code details and a latency time period for each Step.
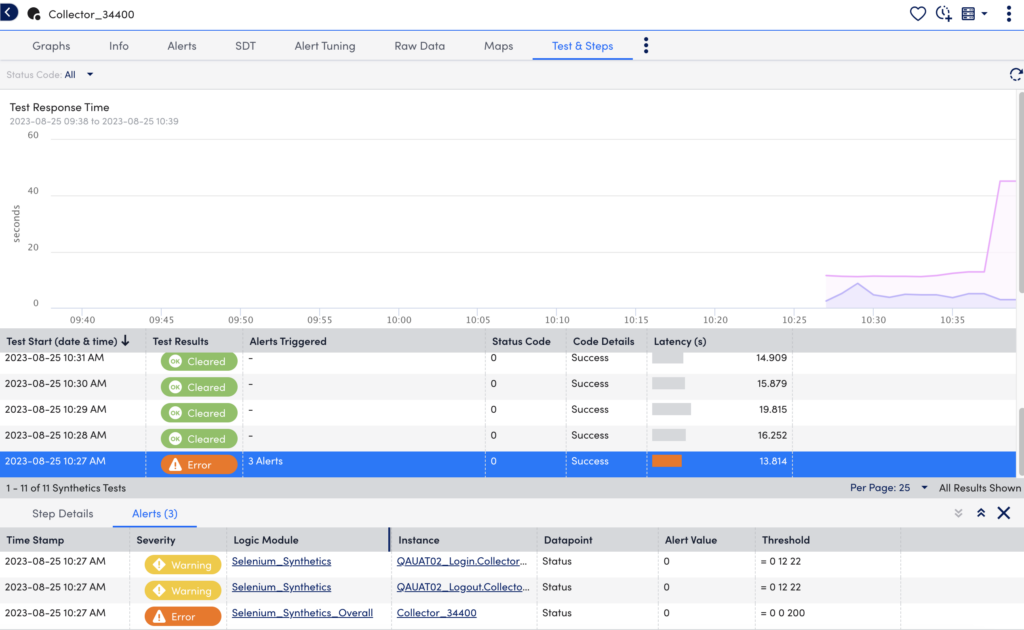
Viewing Alerts
You can select a Test from the Test and Step table to view its associated Alerts.
Important:
- For Selenium Web Checks created with collectors before 33.401, you have to reconfigure the web checks.
- To use the functionality of creating steps, you must update the collector to version 33.401 or later.
Note: Selenium Web checks cannot run in a private Incognito window in Chrome browser.
Procedure to Create Selenium Web Checks
- In LogicMonitor, navigate to Resources > Add > Synthetics.
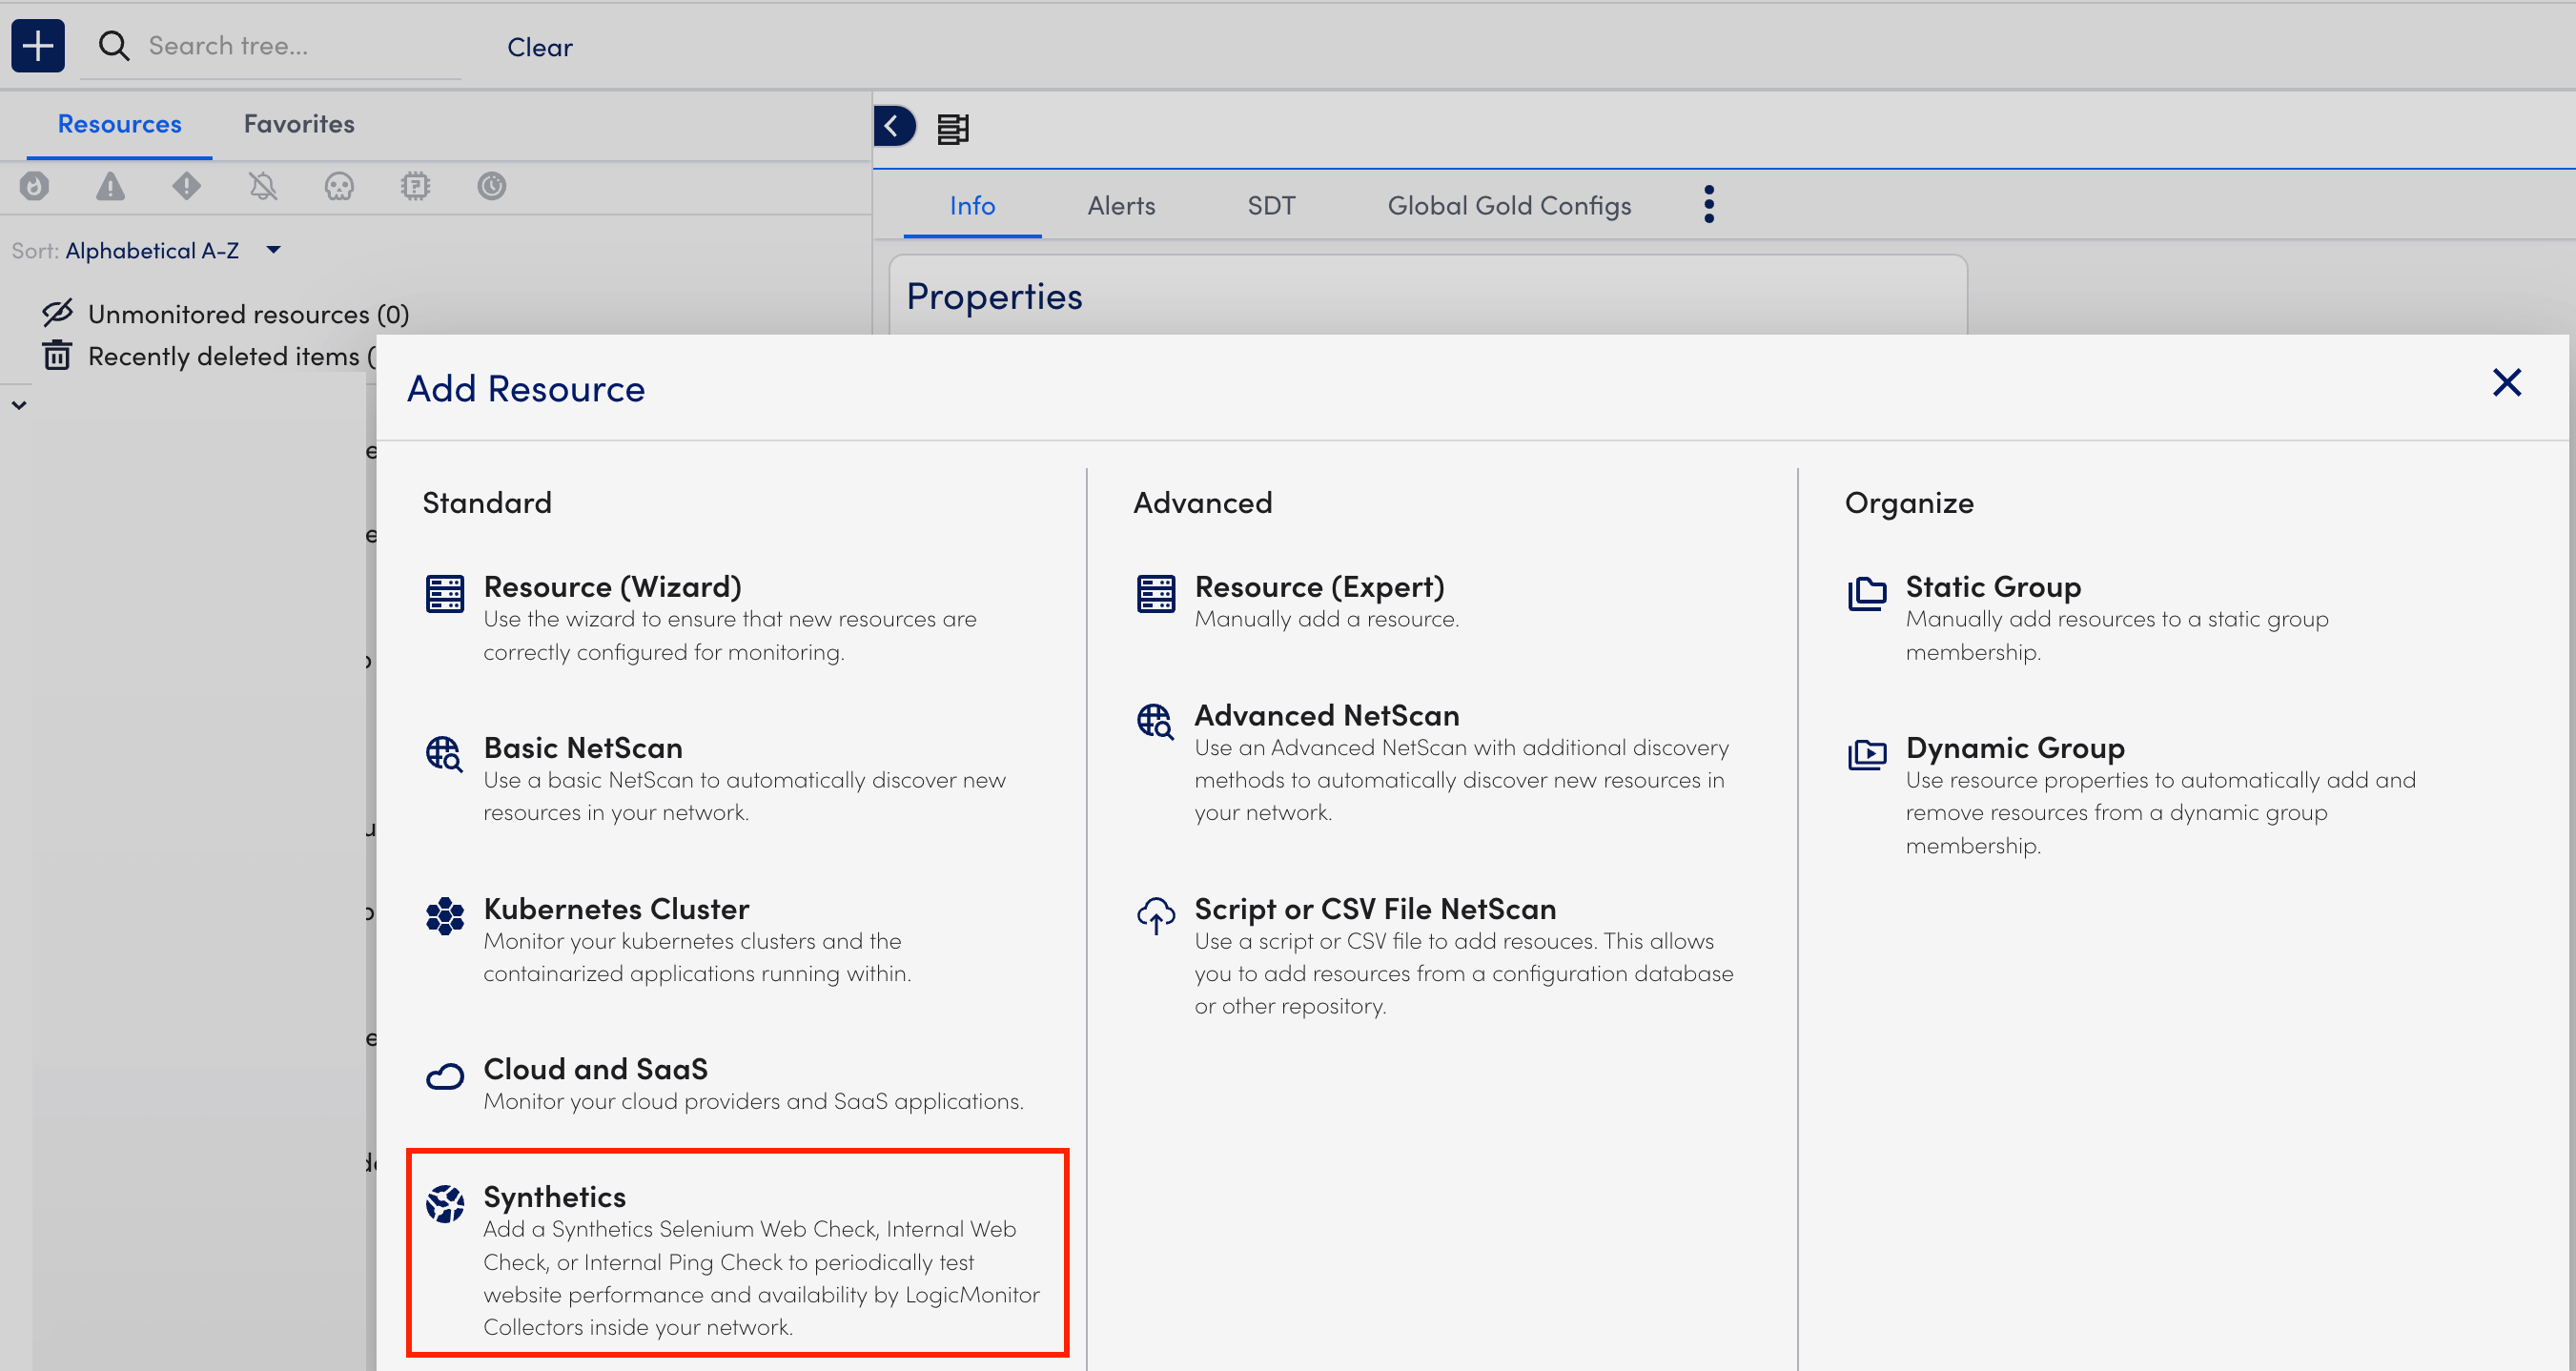
- Follow the onscreen instructions to upload the .side file from the browser transaction recording.
Note:
You can upload a .side file containing a maximum of 10 tests.
The size of the uploaded .side file must be a maximum of 1MB. - On the Step Setup page, you can view the different tests, number of steps, and parsing information in the Tests table. You can split a single test into multiple steps by performing the following:
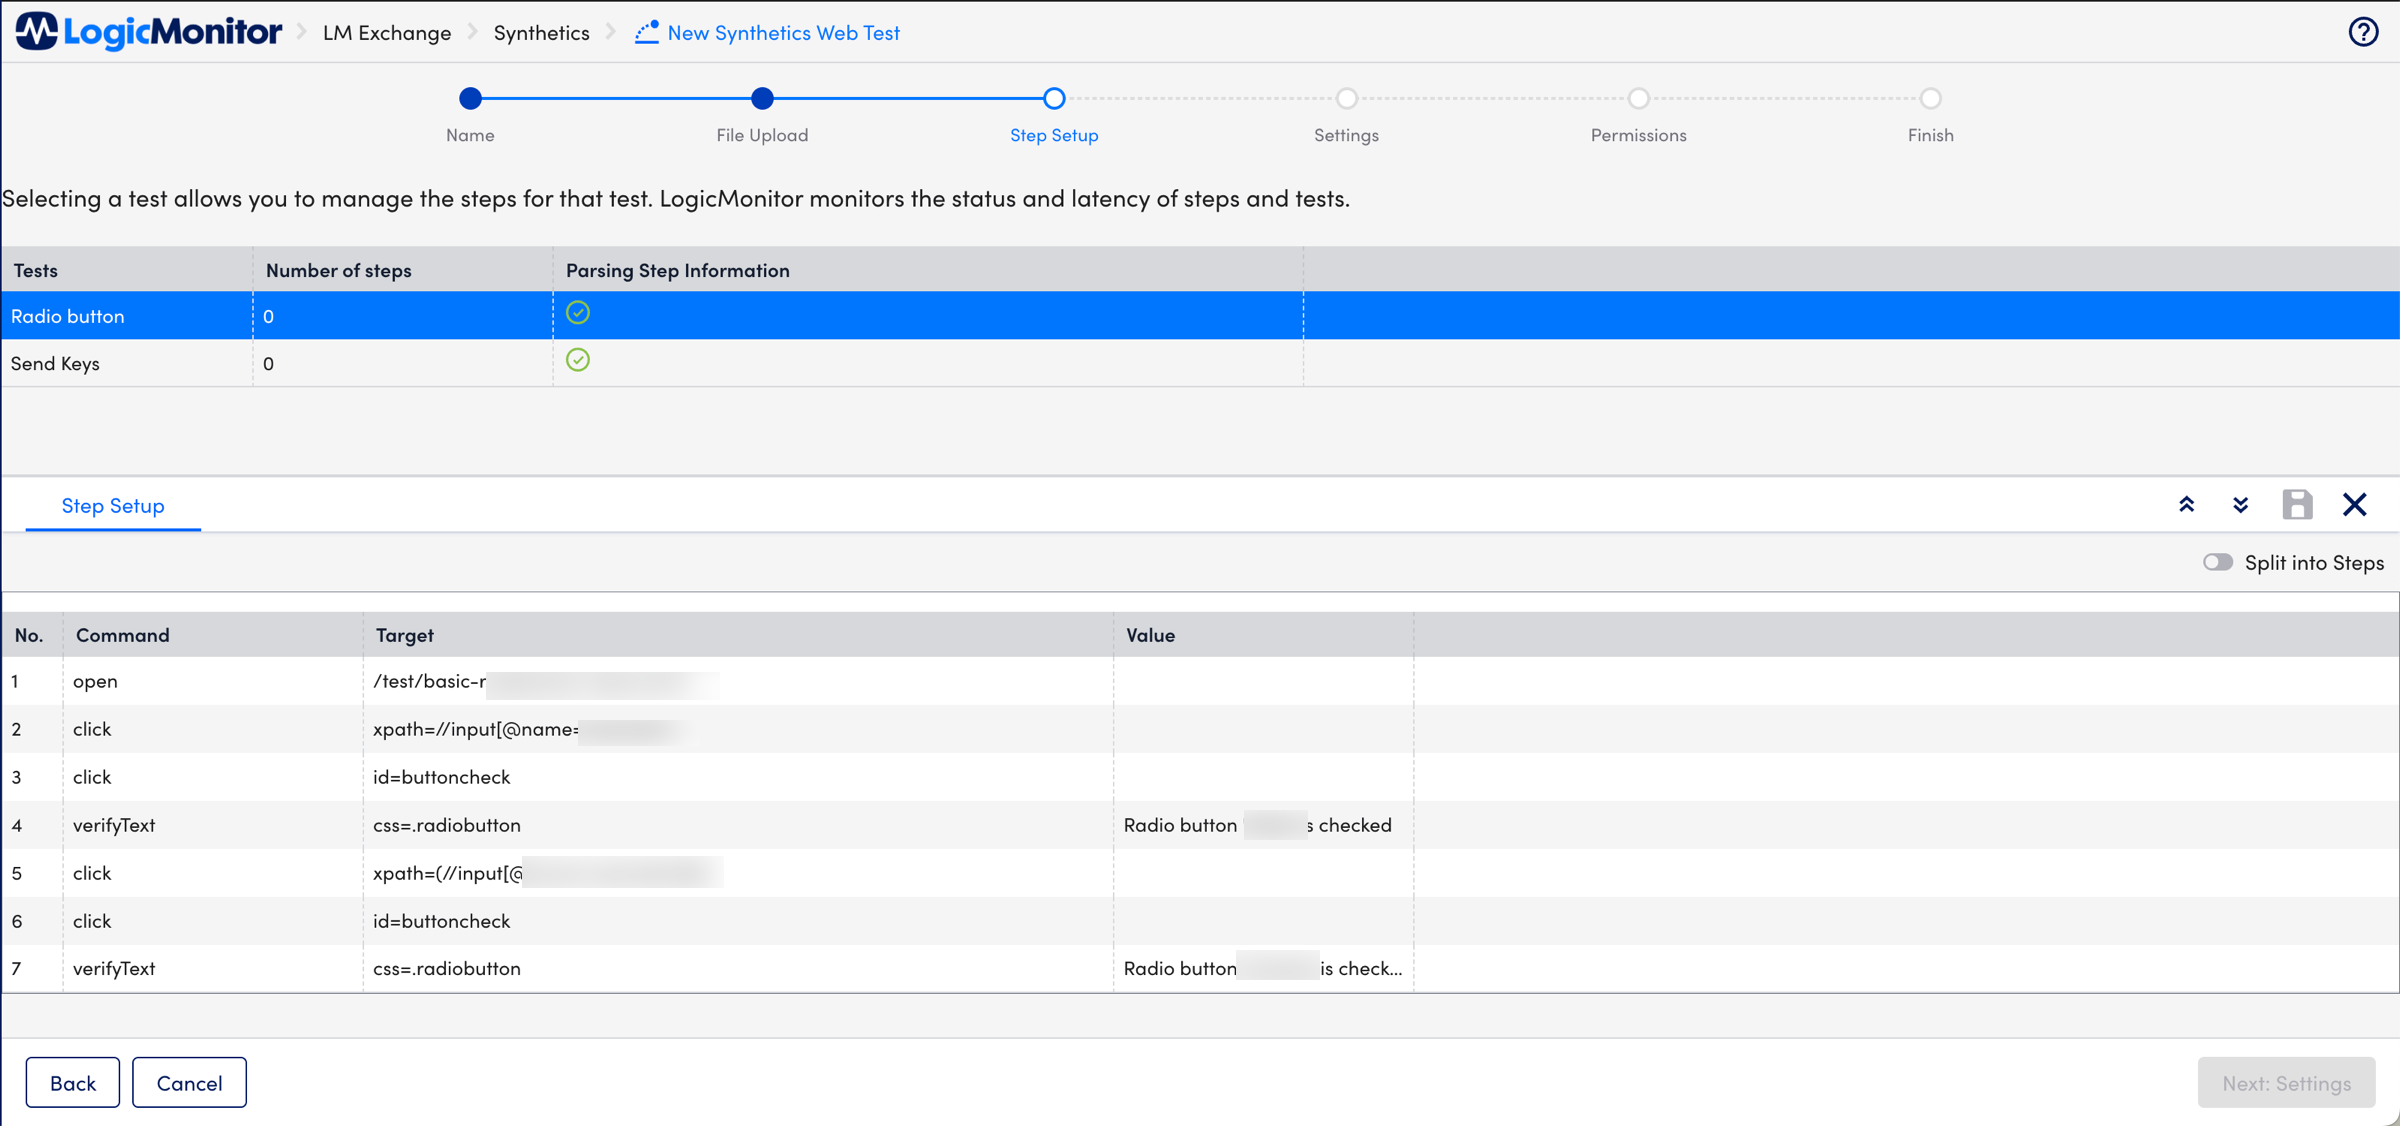
- Select a desired test from the Tests table.
The Step Setup tab displays all the test operations. - Toggle on the Split into Steps to create multiple steps.
Note: The first step is created by default at the top of all the commands. The first step cannot be deleted once saved. - Select
 at your required level and enter the appropriate step name.
 - Once you complete adding all your steps then select
 .
.
Note: You can add a maximum of 10 steps.
- Select a desired test from the Tests table.
- On the Settings page, perform the following:
- Select your required polling interval. The default and recommended value is 10 minutes.
- Enter your collector name and select it.
- At the Permissions page, ensure you add the appropriate credentials for authentication.
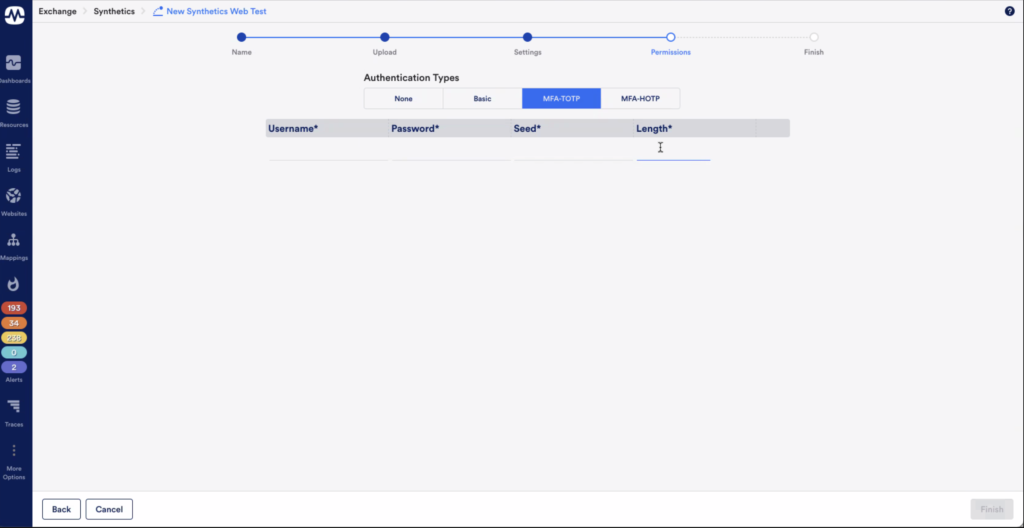
Refer to the documentation for your specific MFA provider to obtain the appropriate MFA type, seed, and length for your test credentials.
Note: You cannot edit Selenium Web Checks once they are created.
Example of Synthetics Website Test
If you want to run a Synthetics Test on a website, which contains multiple operations, there is an option to create multiple steps to logically group all your website’s operation (Login, search, and checkout). On completing the Synthetics Web Test process, the information displays on the Resources page. Each step is treated as an individual device here. This helps you to easily navigate through all of your website’s operations.
Requirements for Selenium Web Checks
- To record a browser transaction, you need one of the following:
- Selenium IDE Firefox
For more information, see Selenium IDE from Firefox Browser Add-ons. - Standalone Selenium IDE Extension
For more information, see 4.0.1-beta.14 Assets from SeleniumHQ.
- Selenium IDE Firefox
- Manage permissions for all listed resources in the Resource Tab.
- Access permission to the Synthetics Monitoring for adding the new synthetic web test.
- An active collector should be configured with the grid URL.
Authentication for Selenium Web Checks
You can add authentication to your Synthetics Web Checks with the following actions:
- Parameterizing the appropriate credentials inside the Selenium
.sidefile
This can be accomplished after you record your browser transaction by modifying the.sidefile with the appropriate authentication. - Specifying the credentials when uploading the Web check to LogicMonitor
You can specify the credentials in a step of the Synthetics Website Test wizard in your LogicMonitor portal
Note: In addition to authentication, you can specify a LogicMonitor property while uploading the .side file in the portal using the wizard. Specify in the format {synthetics.variable.variableName}. For example, synthetics.selenium.test.timeout.
Credentials consist of a username and password if you are using multi-factor authentication (MFA) token. LogicMonitor leverages the existing variable substitution in Selenium IDE to securely inject your authentication information.
Recording a Browser Transaction
Follow the Getting Started instructions from Selenium to record a browser transaction.
Recommendation: You can add WAIT_FOR_ELEMENT_VISIBLE property in the .side file and set the value greater than zero to allow a waiting period for the elements to load. A timeout error displays, If the elements don’t load in the specified period
When complete, save your .side file in a location you can access for uploading to LogicMonitor.
Note: Selenium allows you to connect to a session using a VNC viewer to watch the browser as a test executes. You can connect VNC directly to the exposed node port using a VNC viewer (For example, VNC Connect).).
Selenium Grid 4 includes a NoVNC web viewer. Exposing port 7900 allows you to open the port in a browser and see the VNC viewer activity without installing a viewer. If you use the provided docker-compose file, you would use the following:
– Chrome: “http://:7900”
– Edge: “http://:7901”
– Firefox: “http://:7901”
See the following for additional tips:
Debugging.
You can also run “Poll now” on the Selenium Webcheck to see any error messages that may be encountered.
Adding Authentication to the Browser Recording
To add authentication, you must parameterize the credentials in the Selenium .side file by replacing each instance of username, password, and token with the appropriate variable substitution.
Variables can be substituted in Selenium IDE text fields by surrounding a variable name with ${}. For example, to substitute the value of the variable myVar into the condition of an if statement would look similar to the following:${myVar} === "a".
For more information, see Selenium’s Conditional Branching documentation.
LogicMonitor uses the following special variables to substitute your credentials username, password, and token respectively:
credential.usernamecredential.passwordcredential.token
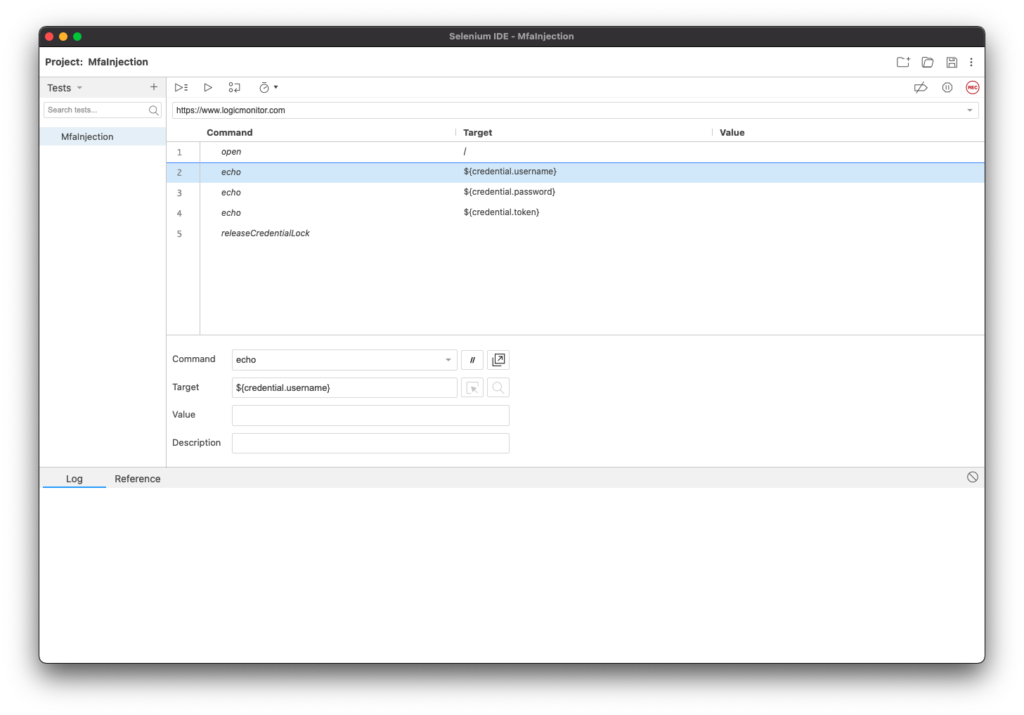
Note: Each credential field (username, password, and token) are printed to the execution log using the echo command.
Recommendation: Specify multiple test user accounts to be added to a “pool” of users that the test pulls from. This ensures MFA can be tested properly and avoids situations where one specific test user is attempting to log in too many times from different locations.
Downloading the SIDE file
You can download the SIDE file used for your Synthetics Web Check.
- In LogicMonitor, navigate to Resources > select Synthetics resource.
- Select (Manage Resource Options)
 .
. - Select Download SIDE file.
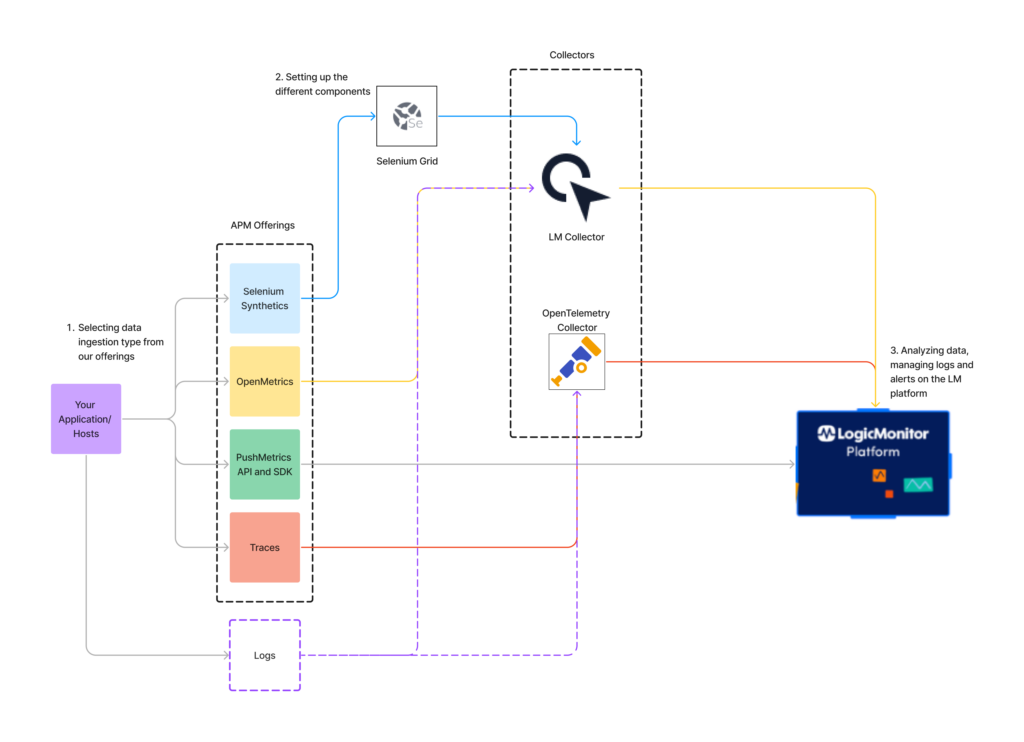
Workflow
The following diagram illustrates the LogicMonitor APM setup workflow:
Procedure
Follow the below steps to setup LogicMonitor APM:
- Selecting data ingestion type from our offerings
- Setting up the different components
- Analyzing data, managing logs and alerts on the LogicMonitor platform
Selecting Data Ingestion Type from our Offerings
You need to choose the best APM offering for your application from the following:
- Emulate and test common application operations using Selenium Synthetics: For more information, see LM Synthetics Overview.
- Set up OpenMetrics (Prometheus Exposition Format) DataSources for polling an endpoint where these metrics are exposed. For more information, see OpenMetrics DataSource Wizard.
- Use the LogicMonitor Push Metrics feature to send metrics directly to the LogicMonitor platform using a dedicated API. For more information, see Getting Started with Push Metrics.
- Distributed Tracing is an OpenTelemetry-based integration that enables you to forward trace data from instrumented applications. For more information, see Distributed Tracing Overview.
Note: You can also ingest logs from your application to the LogicMonitor platform using the LogicMonitor API or SDK, LogicMonitor Collector, or OpenTelemetry collector.
Setting up the Different Components
The following is the setup requirement for the different APM offering:
Selenium Synthetics: Install LogicMonitor Collector on your system and then install Selenium Server. Once you install the LogicMonitor Collector and Selenium Server (Grid), you can add a Selenium Synthetics Web check in your LogicMonitor portal for ingesting Synthetics data to LogicMonitor. For more information, see Selenium Synthetics Setup.
OpenMetrics Integration: Install LogicMonitor Collector on your system and use the OpenMetrics datasource wizard to load metrics from an OpenMetrics endpoint and select the metrics to process into datapoints for collection. For more information, see OpenMetrics DataSource Wizard.
PushMetrics API and SDK: LogicMonitor Push Metrics REST API programmatically ingests metrics for multiple instances associated with a single resource and DataSource. For more information, see Ingesting Metrics with the Push Metrics REST API.
Traces: LogicMonitor provides a wrapped version of OpenTelemetry that is pre-configured to forward traces from your instrumented applications to the LogicMonitor platform. You can install an OpenTelemetry Collector on Linux, Docker, or Kubernetes. For more information, see OpenTelemetry Collector Installation.
Analyzing Data, Managing Logs and Alerts on the LogicMonitor Platform
All the traces and operations of the trace data from your instrumented applications displays on the Traces page. You can access the Traces page from the navigation sidebar or from a service in Resources. For more information, see Traces Page Overview.
For every static or dynamic threshold set for the metrics monitored at the Resource or Service levels, you will receive alerts on these trace and operation metrics. For more information, see Alerting on Trace Data.
You can use the OpenTelemetry Collector Installation wizard in LogicMonitor to install an OpenTelemetry Collector. This wizard guides you through choosing a platform for installation, allows you to customize the configuration file (For example, you can configure your Cross-Origin Resource Sharing (CORS) policy by specifying the domains the collector is allowed to receive requests from), and provides the command for installing the Collector. If you are installing the Collector in a container, you can edit this command to include optional parameters that allow you to further customize the installation of the Collector.
For more information about CORS, see Mozilla’s Cross-Origin Resource Sharing (CORS) documentation.
Installing an OpenTelemetry Collector on Linux
You can install the OpenTelemetry Collector on Linux as a root or non-root user. For root users, lmotel runs as a service; and for non-root users, lmotel runs as a process.
- Navigate to Traces >
 (Onboarding), and select Install OpenTelemetry Collector.
 - Enter a name for the Collector, and select Linux for the platform.
- Select the version of the Collector you want to install.
- At the Review Configuration step of the wizard, make changes to the configuration file as necessary to customize the Processors in the OpenTelemetry Collector settings. For more information about the modifications you can make, see Configurations for OpenTelemetry Collector Processors.
You can configure CORS by specifying the origins to allow requests. For more information, see CORS (Cross-origin resource sharing) from OpenTelemetry. - At the Commands step of the wizard, modify the cURL command as needed, and then copy the command.
Note: The cURL command to download the Collector binary is only valid for two hours after it is made available.
After you download the installer, you must make it executable (chmod +x installer_file) and then run the executable (./installer_file).
In addition, the installation path for the non-root user is the following:
# installation_path=/home# status check:

$ ps -ef | grep lmotelInstalling an OpenTelemetry Collector in Docker
The wizard provides you with a preconfigured Docker run command for running a container with LogicMonitor’s OpenTelemetry Collector Docker image.
- Navigate to Traces > (Onboarding), and select Install OpenTelemetry Collector.
- Enter a name for the OpenTelemetry Collector, and select Docker for the platform.
- Select the version of the Collector you want to install.
- At the Review Configuration step of the wizard, make changes to the configuration file as necessary to customize the Processors in the OpenTelemetry Collector settings. For more information about the modifications you can make, see Configurations for OpenTelemetry Collector Processors.
You can configure CORS by specifying the origins to allow requests. For more information, see CORS (Cross-origin resource sharing) from OpenTelemetry. - At the Commands step of the wizard, do the following:
- Enter the username for the user with the minimum privileges. This is the API-only user you created for installing the OpenTelemetry Collector.
An Access ID and Access Key are automatically created for this user. This is required to authenticate to Docker when you install the OpenTelemetry Collector in your Docker container. - Copy the Run command to use for installing the Collector.
You can modify this command as needed by entering optional parameters in the command. For more information, see Configurations for OpenTelemetry Collector Container Installation.
- Enter the username for the user with the minimum privileges. This is the API-only user you created for installing the OpenTelemetry Collector.
- Click Finish.
Use the command from the wizard to install the OpenTelemetry Collector in Docker.
Note: If using Microsoft Azure App Service, you can deploy the OpenTelemetry Collector to an Azure Container Instance after you install it in Docker. For more information, see Configurations for OpenTelemetry Collector Deployment in Microsoft Azure Container Instance.
Installing an OpenTelemetry Collector in Kubernetes
LogicMonitor provides Helm Charts to install an OpenTelemetry Collector in a Kubernetes cluster. These Helm Charts run the OpenTelemetry Collector as a replicaset. The wizard provides preconfigured Helm commands for adding LogicMonitor charts and installing the OpenTelemetry Collector.
In addition, you can leverage an Ingress resource for use with the OpenTelemetry Collector by specifying the Ingress Endpoint. This allows the OpenTelemetry Collector to communicate in a hybrid environment if only some of your resources or services are hosted in Kubernetes, and you need these resources to communicate with resources not hosted in Kubernetes.
- Navigate to Traces > (Onboarding), and select Install OpenTelemetry Collector.
- Enter a name for the OpenTelemetry Collector, and select Kubernetes for the platform.
- Select the version of the Collector you want to install.
- At the Review Configuration step of the wizard, make changes to the configuration file as necessary to customize the Processors in the OpenTelemetry Collector settings. For more information about the modifications you can make, see Configurations for OpenTelemetry Collector Processors.
You can configure CORS by specifying the origins to allow requests. For more information, see CORS (Cross-origin resource sharing) from OpenTelemetry. - At the Commands step of the wizard, do the following:
- Enter the username for the user with the minimum privileges. This is the API-only user you created for installing the OpenTelemetry Collector.
An Access ID and Access Key are automatically created for this user. This is required to authenticate to Kubernetes when you install the OpenTelemetry Collector in your Kubernetes container. - If you want to leverage an Ingress resource, enter the Ingress Endpoint on which the Ingress Controller listens for incoming spans.
- Copy the Helm Chart command to use for installing the Collector.
You can modify this command as needed by entering the following:- Optional parameters
For more information, see Configurations for OpenTelemetry Collector Container Installation. - Additional properties for leveraging an Ingress resource
For more information, see Configuration for Ingress Resource for OpenTelemetry Kubernetes Installation.
- Optional parameters
- Enter the username for the user with the minimum privileges. This is the API-only user you created for installing the OpenTelemetry Collector.
- Click Finish.
The OpenTelemetry Contrib distribution is a repository for OpenTelemetry Collector components that are not a part of the core repository and distribution of the collector. LogicMonitor Exporter is a part of the OpenTelemetry Contrib distribution.
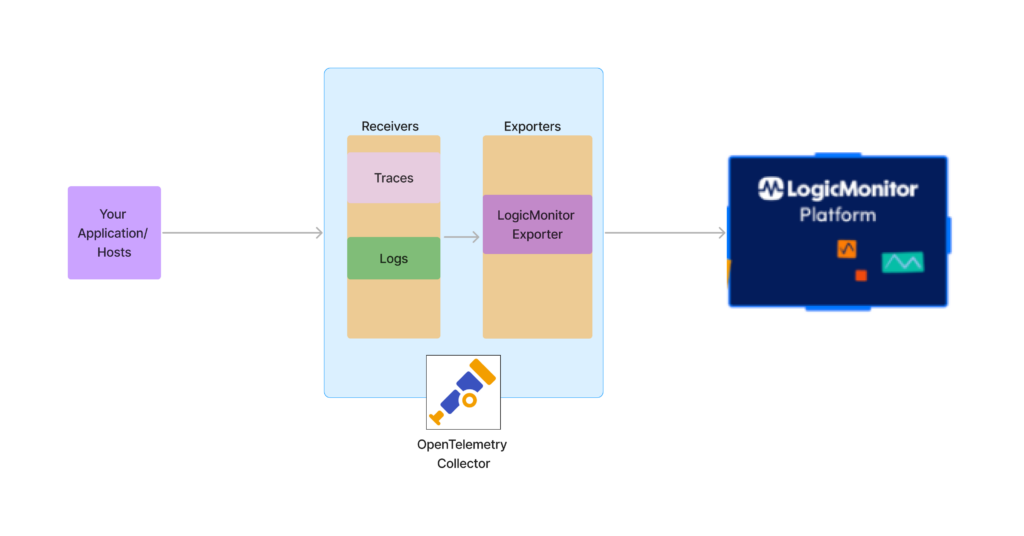
The OpenTelemetry Collector allows you to collect OpenTelemetry-supported telemetry data from your environment to the LogicMonitor platform. LogicMonitor associates the traces and logs telemetry data from the single OpenTelemetry Collector through the LogicMonitor Exporter to simplify your application’s operations and troubleshoot issues. For more information, see LogicMonitor Exporter from OpenTelemetry.
The OpenTelemetry Contrib distribution offers you the following:
- Broad coverage of traces and log receivers from different sources—Different receivers from the OpenTelemetry Collector can be used to collect traces and log data from different traces and log sources. For example, you can export traces and logs to the LogicMonitor platform from multiple trace providers like Azure and AWS X-Ray and log providers like CloudWatch, Kafka, and Syslog.
- OpenTelemetry distribution management—You can create different distributions of OpenTelemetry Collectors as needed. OpenTelemetry Collector also supports creating builds for other operating systems and creating container images with different architectures.
- Various deployments—Using the helm chart, you can deploy in different modes like a sidecar, daemon sets, and deployment.
- Telemetry interoperability—Receivers for different trace providers can be used to convert the traces from vendor-specific format to OpenTelemetry format. You can then ingest data into the LogicMonitor platform.
Important: You are responsible for upgrading and configuring of OpenTelemetry Collectors. Contact Support if you need assistance.
The following image illustrates the traces and logs ingestion process using a single LogicMonitor Exporter in the OpenTelemetry Collector:
Installing OpenTelemetry Collector from Contrib
Before starting the installation, see “General Requirements and Considerations” for installing the OpenTelemetry Collector. For more information, see OpenTelemetry Collector Installation.
Downloading and Installing OpenTelemetry Collector
Depending on your environment, you can download and install OpenTelemetry Collector on Linux, Windows, Docker, or Kubernetes. For more information, see Getting Started from OpenTelemetry.
For more information on viewing the different releases, see OpenTelemetry Collector Releases from OpenTelemetry.
Note: LogicMonitor Exporter is available with OpenTelemetry Collector Contrib v0.72.0 or later.
Configuring LogicMonitor Exporter
To configure LogicMonitor Exporter, you need to create a configuration file:
receivers:

  windowseventlog:

    channel: application

  syslog:

    tcp:

      listen_address: "0.0.0.0:54526"

    protocol: rfc5424

  jaeger:

    protocols:

      grpc:

  otlp:

    protocols:

      grpc:

processors:

  batch:

exporters:

  logicmonitor:

    endpoint: https://<company_name>.logicmonitor.com/rest

    api_token:

        access_id: "<access_id of logicmonitor>"

       access_key: "<access_key of logicmonitor>"

extensions:

  health_check:

service:

  extensions: [health_check]

  pipelines:

    logs:

      receivers : [ windowseventlog, syslog ]

      processors: [ batch ]

      exporters : [ logicmonitor ]

    traces:

      receivers : [ otlp, jaeger ]

      processors: [ batch ]

exporters : [ logicmonitor ]Exporting Telemetry Data from OpenTelemetry Collector
The OpenTelemetry Collector automatically starts exporting telemetry data to LogicMonitor after you add the LogicMonitor Exporter to your OpenTelemetry Collector configuration file.
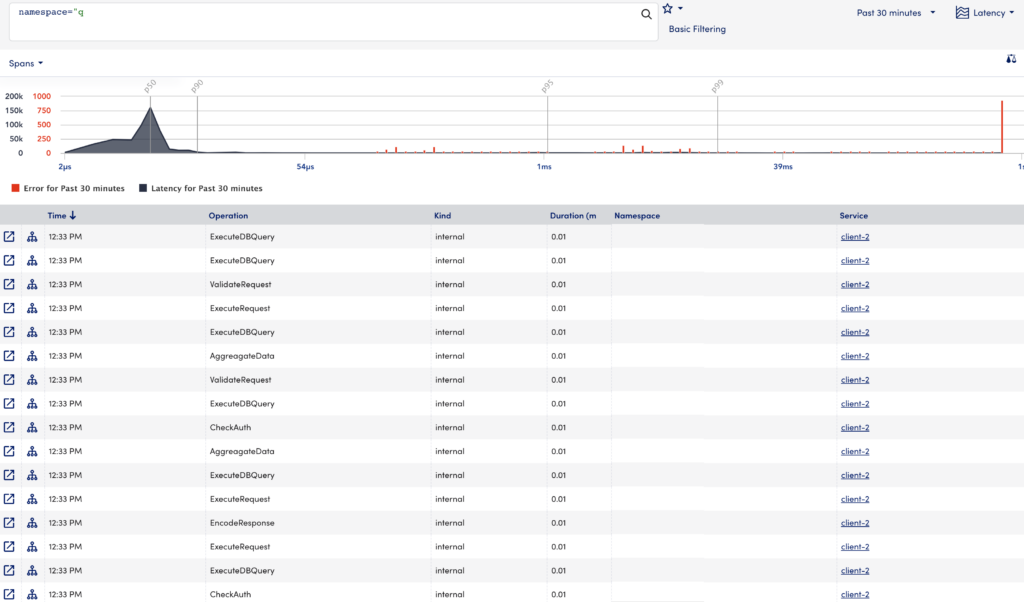
While you can view the trace data in different widgets, select View Data to view the details for the selected namespace along with the time period.
Important: You can view span data by selecting Spans from the drop-down list above the graph. The span data options are similar to the traces data.
The Traces page displays the trace data using the following visual components:
- Traces Graph—Displays trace data allowing you to visualize the performance of the traces.
- Traces Table—Lists the spans from your trace data, sorted by time.
You can use filters to narrow your trace data. When you apply the filter to the trace data, the Traces Graph and Traces Table update based on the options selected in the filters. From the Traces Table, you can access the end-to-end trace detail screen.
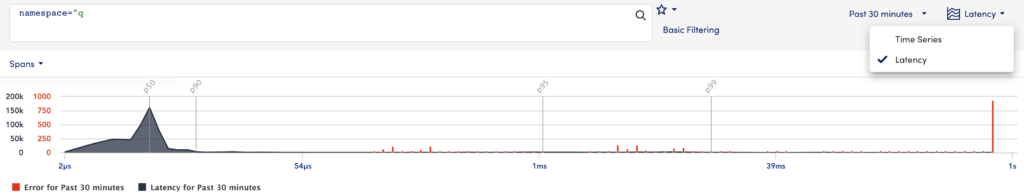
Traces Graph
The Traces Graph allows you to visualize how your traces are performing over time using the following:
- Latency—The Traces Graph displays the operations plotted by latency.
- Time Series—The Traces Graph displays spans and errors ingested over time.
You can select “Latency” or “Time Series” to view the trace data in the Traces Graph for the operation you select.
You can narrow the data in the graph by clicking and dragging your cursor over the desired data. The graph zooms in on the selected data.
Comparing Spans Data on Latency Graph
You can visually compare a single span’s data for two different time ranges on the latency graph. To display these details on the latency graph follow the steps:
- Select
 to open the Compare Spans modal.
 - On the Time tab, select your required time period from the Second Time Period drop-down.
- (Optional) On the Tags tab, specify any tags as required.
- Select Go.
Two overlay graphs display for the specified time ranges.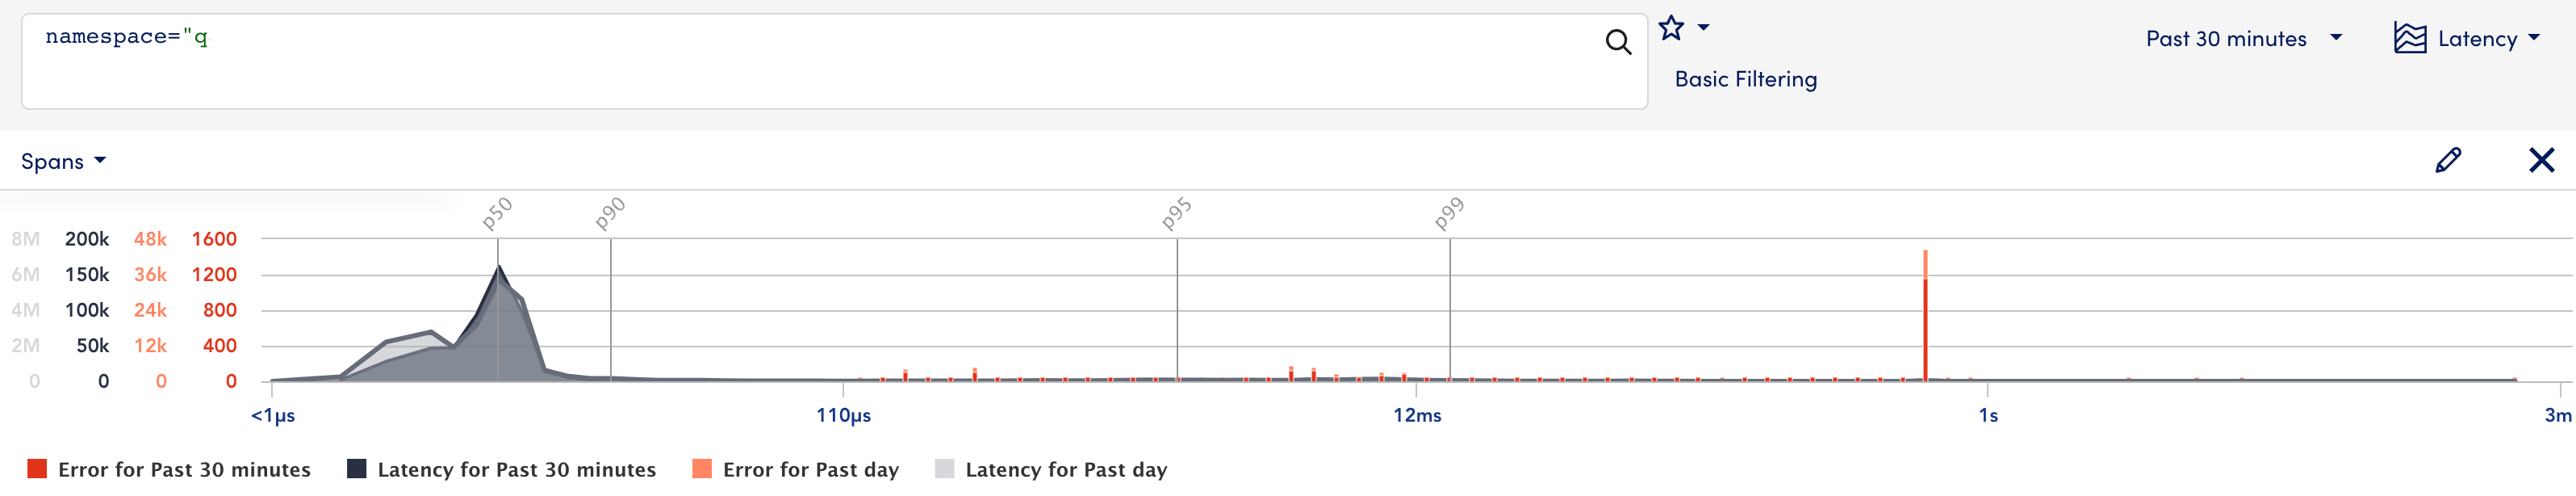
In addition, you can perform the following:
 —edits the compare spans details.
 —closes the overlay compare spans graph.
Traces Table
The Traces Table displays the specific operations within a trace using the following details:
| Field | Description |
| Time | The time that the operation occurred. You can sort the table in ascending or descending time order. |
| Operation | The name of the operation, which is set during instrumentation. |
| Kind | The kind or type of operation (internal, client, servers). |
| Duration (ms) | The duration of the operation in milliseconds. You can sort the table in ascending or descending time order. |
| Namespace | The namespace (application) to which the trace belongs. |
| Service | The service where the operation originated. If there are errors associated with the service, you will see an icon to indicate the severity. |
| Resource | The resource associated with the operation. If there are errors associated with the resource, you will see an icon to indicate the severity. |
In addition to the specific operations of a trace, the traces table also provides the following features:
 —opens the end-to-end trace view for the selected operation, along with other operations in the trace in a new tab.
 —opens a topology map that describes conceptual information about the application. For more information, see Application Topology Overview.
End-to-End Trace View
Selecting a specific operation displays the end-to-end trace that operation participates in along with other operations in the trace. The end-to-end view focuses on the operation you select, but you will also see the operations before and after it in the timeline.
For each operation, this view displays the Service name and Operation name followed by the duration and error status of the operation. The length of the bar indicates its duration, while the color of the bar indicates the error status of the operation.
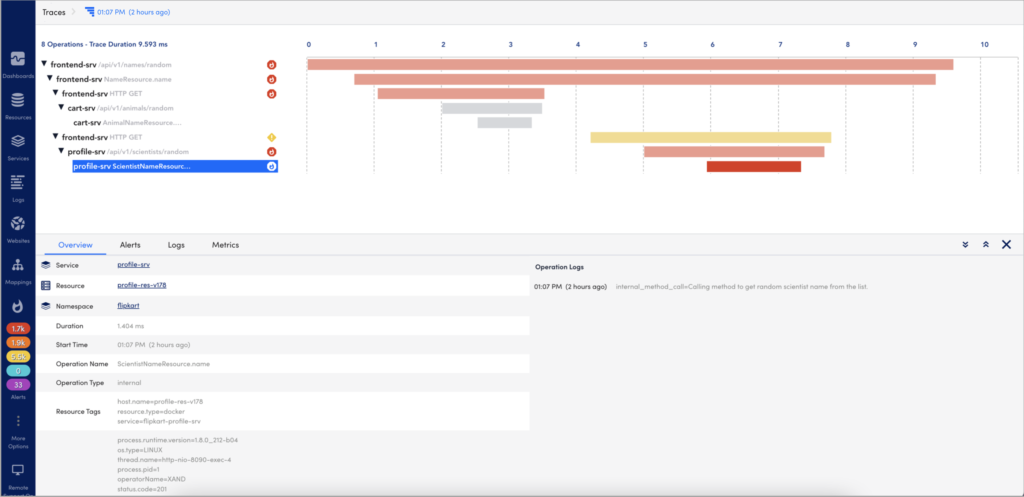
Selecting an operation opens the detail panel for that operation. This detail panel shows the following:
- Overview— Displays basic metadata for the operation (such as tags and logs), the resource the operation is associated with, and the service where the operation started.
- Alerts— Displays a list of any active alerts for the resource that the operation is associated with.
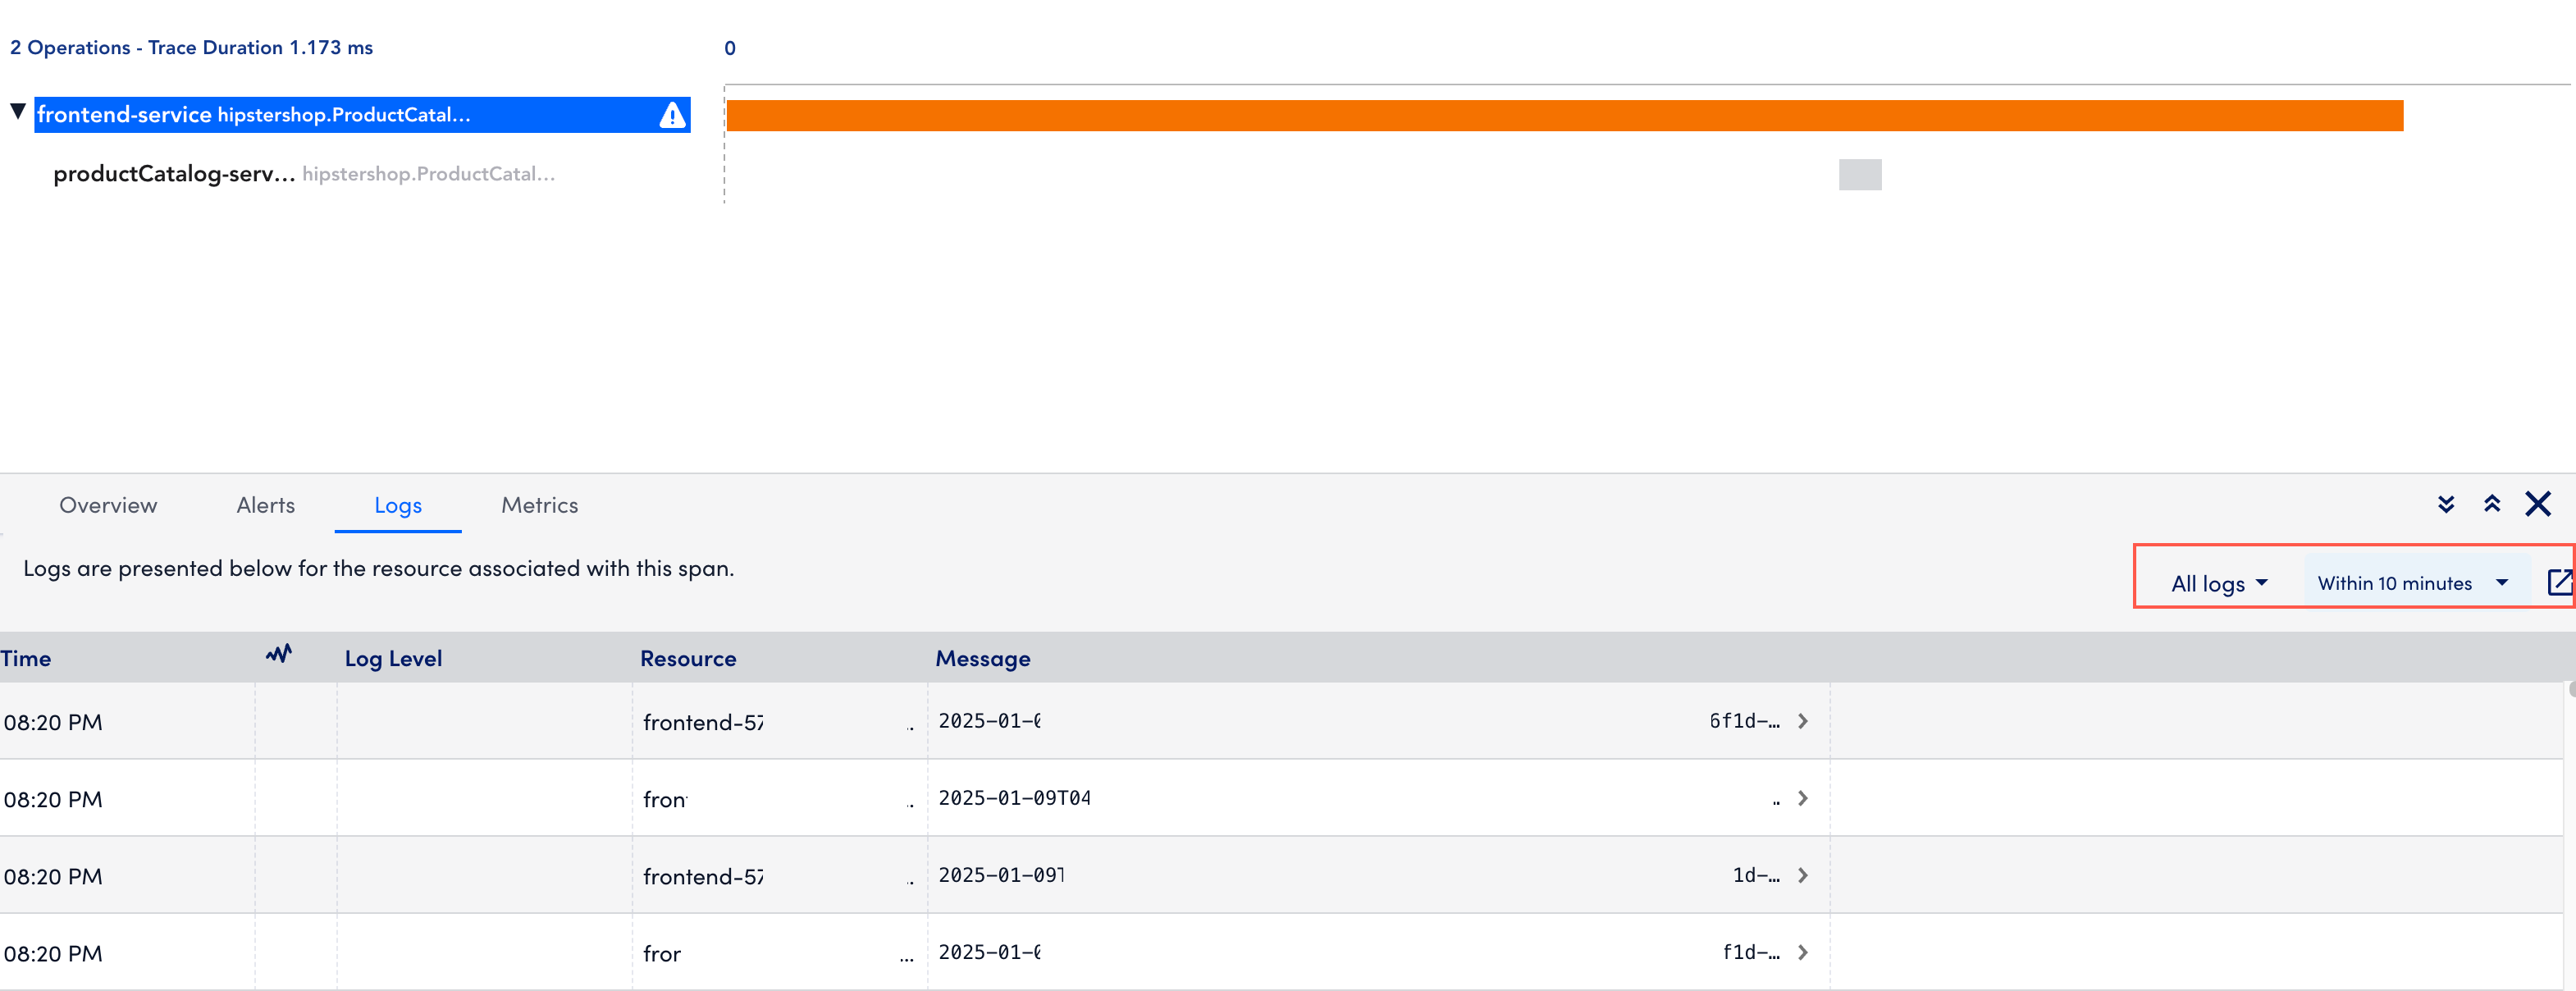
- Logs— Displays operation logs (such as application logs) sent via manual instrumentation, and resources logs (such as infrastructure and application logs) sent from LM Logs. For more information, see LM Logs for more information. In addition, you can filter logs based on the trace ID and also for a specific time range. You can also open the Logs page.
- Metrics— Displays the metrics (Duration, OperationCount, ErrorOperationCount) of the operations associated to the service namely in a graph. The metrics displays for a time range (+/- 15 minutes) of the ingested span. You can zoom in on each graph.
You can use this contextual information to troubleshoot issues identified by the traces (using duration or error status).
The following table lists the supported OpenTelemetry versions:
Important: Use the latest OpenTelemetry Collector version as the previous versions will be deprecated.
| Version | Release Date | Highlights |
| 5.2.00 (Recommended) | 22 May 2025 |
|
| 5.1.00 | 19 March 2025 | LogicMonitor now supports monitoring for Generative AI apps such as Large Language Models (LLMs) and AI chatbots using the LogicMonitor OpenTelemetry Collector (OTEL), with metrics and traces from OpenLIT and Traceloop. |
| 5.0.01 | 7 November 2024 | LogicMonitor now allows you to filter logs when created from a LogSource in the Modules page. |
| 5.0.00 | 13 August 2024 | LogicMonitor now supports the upgrade of the OpenTelemetry collector. |
| 4.0.00 | 11 June 2024 |
|
| 3.0.00 | 9 October 2023 |
|
Deprecated OpenTelemetry Collectors
| Version | Release Date | Highlights |
| 2.0.10 | 16 January 2023 |
|
| 2.0.00 | 29 June 2022 | LogicMonitor now uses OpenTelemetry Collector Contrib version 0.50.0. For more information, see releases from OpenTelemetry. |
| 1.0.06 | 21 April 2022 |
|
For more information on how to manage OpenTelemetry collectors, see Manage OpenTelemetry Collectors.
LogicMonitor application authentication ensures security when you ingest data from your application to the LogicMonitor platform and vice-versa. This mechanism is mainly achieved through different tokens. You need authentication mainly for API-based interaction (logs, metrics, or traces) with the LogicMonitor platform or your account management actions (thresholds and alert management). For more information on creating API tokens, see API Tokens.
Types of Tokens
The two methods of application authentication are listed as follows:
- LMv1 Token
- Bearer Token
LMv1 Tokens
LMv1 token is a key-based authentication which allows you to authenticate the API calls from your custom application to the LogicMonitor platform. The LMv1 token consists of a key pair (access-id and access-key).
For example, if you’re an application developer and have access to the application source code. It is recommended that you use an LMv1 token to authenticate API calls to the LM platform.
The following are some benefits of using the LMv1 tokens:
- Language neutral: You can use any programming language to implement the specifications.
- Tampering check: Built-in feature that checks for any tampering of the in-transit data to the platform.
- User-specific: The LMv1 tokens are user-specific, regardless if you use API or the user interface. You can perform different actions (API calls) based on your assigned roles.
- Handle compromise: The user roles are managed at the server end. In case of compromised tokens, you (admin) can disable the token and restrict the permissions for the user with the compromised token.
Bearer Tokens
Bearer tokens are designed to provide application owners with an authentication mechanism by which they can authenticate the API calls from their applications to the LM Platform. You don’t need application code access to authenticate applications with the platform. Once created you can copy the bearer tokens in full text. Only required fields can be edited in the bearer token for easy implementation.
You can use Bearer tokens in applications which don’t have encoding. These tokens are directly used as authorization headers.
For example, if you’re an application developer and don’t have full access to the application source code. You can set HTTP headers with a static Bearer token, without much modification to the application code.
The following are some benefits of using the Bearer tokens:
- Language neutral: You can use any programming language to implement the specifications.
- User-specific: Bearer tokens are user-specific, regardless if you use API or the user interface. You can perform different actions (API calls) based on your assigned roles.
- Handle compromise: The user roles are managed at the server end. In case of compromised tokens, the admin can disable the token and restrict the permissions for the user with the compromised token.
- Less technical know-how: You will have limited application code access and require minimum skill to inject HTTP headers in the API call.
Best Practices
- Limit the use of the tokens per application. Do not configure the same token in more than one application.
- Create the tokens with API users. This avoids the risk of stranded tokens if the user interfaces user is no longer with the organization.
- Assign only the necessary (minimum) permissions to the token owners for performing required operations in the LogicMonitor platform.
- Refresh the tokens periodically and update the token in the application to avoid any compromise to the tokens.
- Implement encryption at the REST mechanism in an application for secure token storage.
- Avoid changing the token with the application source code. The token must be configured through environment variables.
Selecting each service on the topology map displays information on which namespace it belongs to, a list of spans, associated alerts and logs. All this information displays in a tabular format below the topology map based on the selected service.
Note: There are some service nodes which appear in the topology map but when selected do not display data due to inadequate permissions.
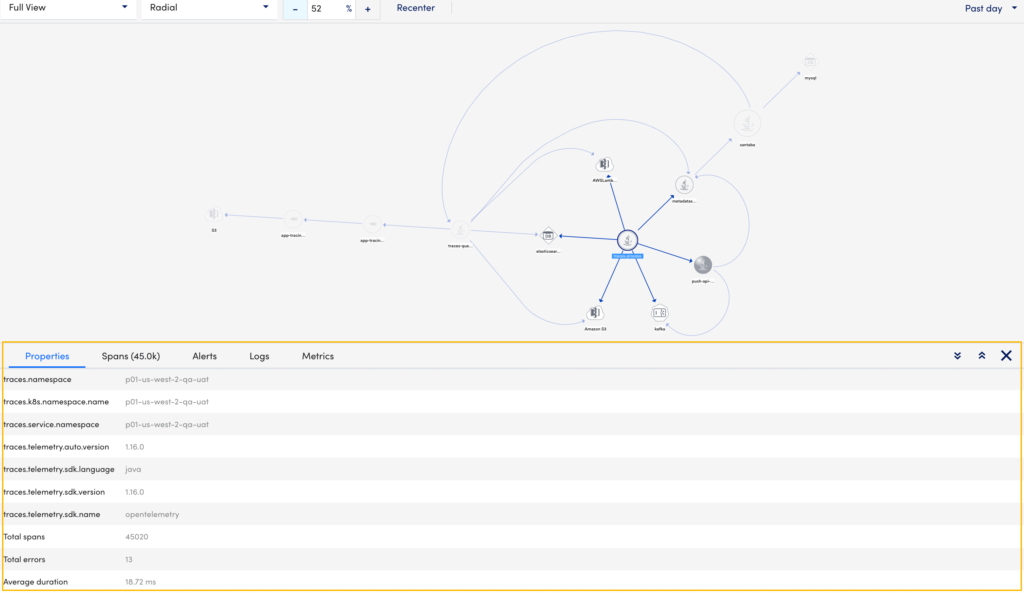
The application topology table displays the following details:
| Tab | Description |
| Properties | Displays the following information about the service:
|
| Spans | Displays all the spans information based on the time range selected in the sort data by time range option. This includes the service operation name, duration of the span, namespace or application name to which the service belongs, service name, and resource id. Note: You can select |
| Alerts | Displays all the alerts for the selected service. This includes information like severity, alert rules, instance, datapoint, escalation rule. For more information on alerts, see Managing Alerts from the Alerts page. Note:
|
| Logs | Displays all the relevant logs for the selected service. This includes the time, severity, and message for the selected service. |
| Metrics | Displays the metrics (Duration, OperationCount, ErrorOperationCount) of the operations associated to the service in a graph. The metrics displays for a time range (+/- 15 minutes) of the ingested span. You can zoom in on each graph. |