Overview
Once a dashboard has been created, it can be viewed, edited, or deleted.
Note: As discussed in Roles, the permissions assigned to your user account determine your ability to view, manage, and delete dashboards.
Viewing Dashboards
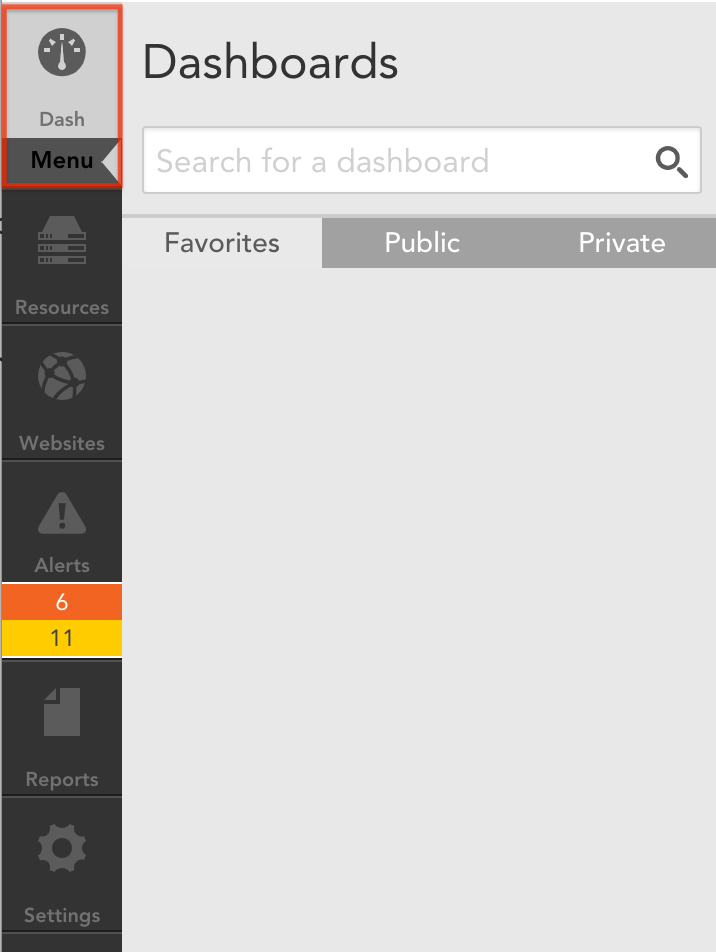
To view a dashboard, click Dash found at the top of the left-hand navigation column. This opens the Dashboard page and displays either your default dashboard or, if no default dashboard is set for your user account, the dashboard you most recently viewed.
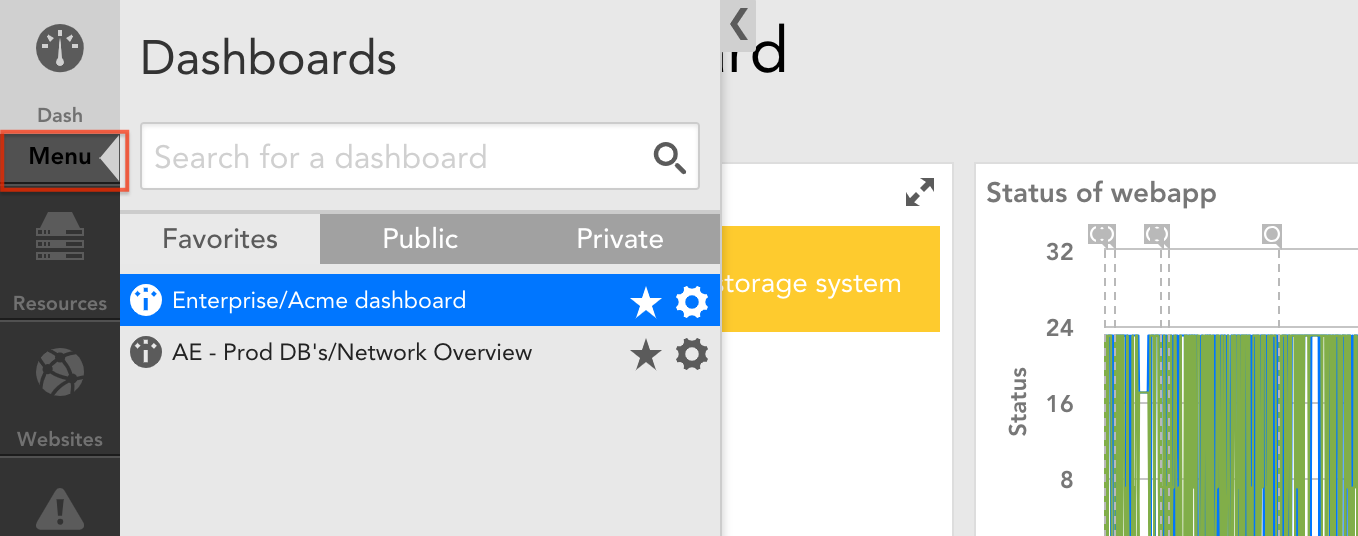
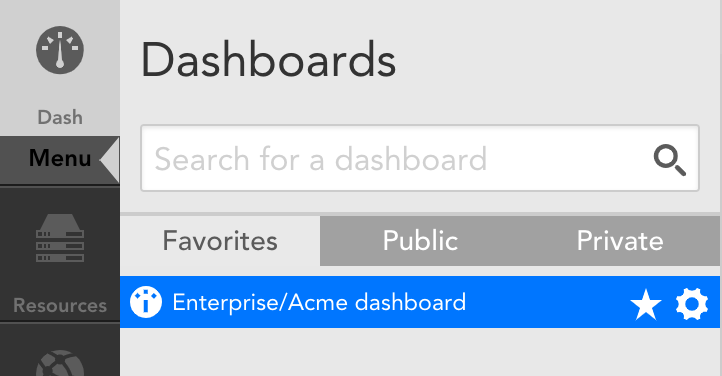
To view a different dashboard, click the Menu option that appears directly under the Dash menu to display a drop-down of all dashboards available to you. You may search for a dashboard by name using the Search field or browse the list. Once found, simply click the dashboard’s name to open it.
Editing Dashboards
Editing Top-Level Properties
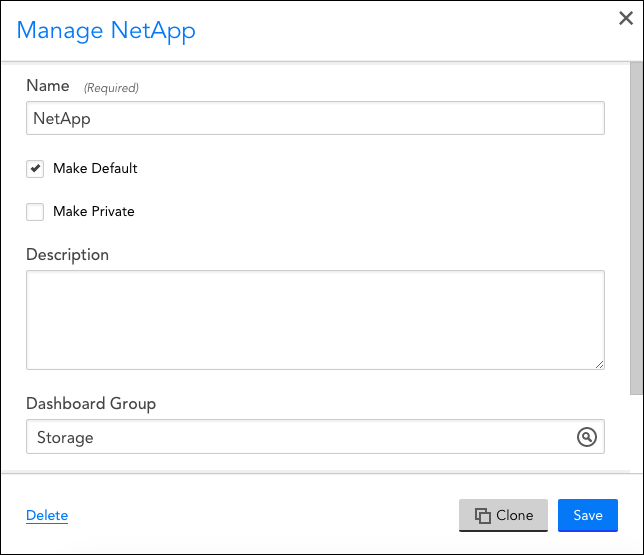
A dashboard’s top-level properties specify its name; description; the dashboard group, if any, to which it belongs; and the tokens, if any, that have been set for it. Additionally, they specify whether the dashboard is the default dashboard for your user account and whether it’s private. (For more information on configuring these top-level properties, see How are dashboards created?)
As shown next, these properties can be accessed in one of two ways:
- By clicking the cogwheel that displays to the right of every dashboard name in the drop-down dashboard menu, which is available from the left-hand Dash navigation menu.
- By clicking the Manage command available from the dashboard header.
Editing Content
Dashboard content can be added, rearranged, resized, reconfigured, cloned, or deleted.
For more information on editing dashboard content, see these related support articles:
Deleting Dashboards
A dashboard can be deleted by accessing its top-level properties page or by selecting the Delete command, which, like the Manage command, is available from the dashboard header.
In this support article, we discuss two methods for sharing dashboards with other users.
- Sharing dashboards via email
- Exporting/importing dashboards and dashboard groups
Sharing Dashboards via Email
Dashboard sharing via email allows you to send a dashboard snapshot (either on a one-time basis or on a recurring basis using a schedule of your choosing) to colleagues or customers. This is particularly useful for generating a visual report of your infrastructure’s overall status at a specific moment in time.
Dashboards are shared as web page URLs. These URLs provide read-only access to the dashboard and expire after seven days (this is a limitation of the AWS authentication technology that LogicMonitor uses to generate these URLs).
Note: You can also accomplish dashboard sharing via the Dashboard report, as discussed in Dashboard Report.
To share a dashboard via email:
- Open the dashboard you would like to share.
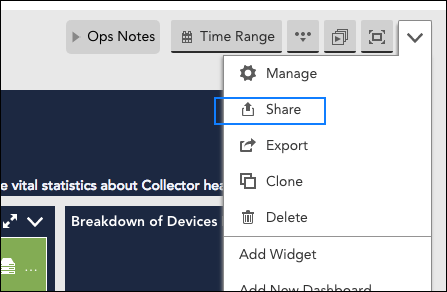
- Click the v icon in the upper right corner of the Dashboard page and select “Share” from the drop-down menu that appears, as shown next.
- Complete the Share dialog box that appears. While completing, keep the following tips in mind:
- The Share with… Users field will only populate with LogicMonitor user accounts. If you need to send the dashboard to an individual external to your LogicMonitor account, use the Share with… Other Emails field.
- Dashboards with more than 100 widgets cannot be shared via email.
- Email sharing of dashboard snapshots can be scheduled on a recurring basis.
- Once the share settings have been configured, click Share. LogicMonitor presents you with a URL that can be copied and shared. Note: This URL expires after seven days.
- Any configurations created when sharing this dashboard are saved as a Dashboard report (and placed in an auto-generated Report group titled “Shared Dashboards”). Future management of these dashboard sharing configurations is done from the Reports page.
Exporting/Importing Dashboards and Dashboard Groups
You can import or export dashboards from your account as a JSON file. This enables LogicMonitor users to harness the creativity of our customer base and share dashboard templates. This is particularly useful if you have tokenized your dashboards and widgets. Doing so allows you to simply replace token values to populate imported dashboards with new data.
Users can import dashboards that have been shared with them by navigating to Dash | Add | From file and simply uploading the received JSON file. In order to export a dashboard, navigate to Dash | Manage Dashboards | Export. This will instantly download a JSON file that you can share.
You can export a dashboard group simply by selecting the cog “Manage” icon in the Dashboard tree and selecting “Export” from the Manage Dashboard Group dialog box. This will automatically export a JSON file consisting of your entire dashboard group. A user can then import a dashboard group in the same manner as importing a single dashboard (e.g. Dash | Add | From File).
Dashboard Menu
In the lefthand navigation column, there is a menu that displays all your Dashboards based on their designation as a Favorites, Public, or Private dashboard.
Adding your Dashboards to “Favorites” helps streamline the process of reaching your most frequently used dashboards.
Adding a Dashboard to Favorites
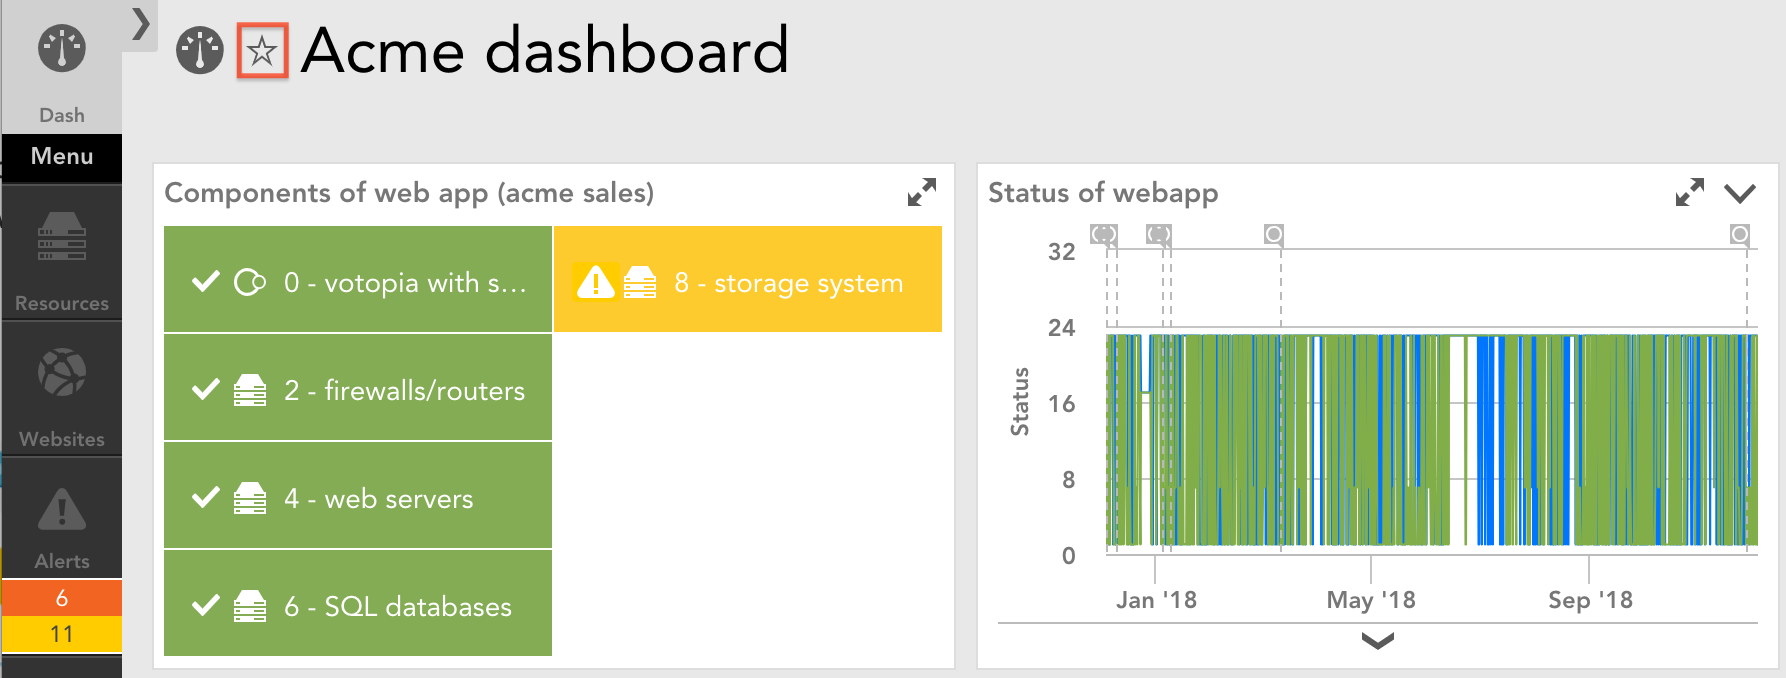
To add a dashboard to Favorites, go to your dashboard. In the upper lefthand side of the dashboard next to its title, you will see a star icon. If you click the icon, your dashboard will be automatically assigned to the “Favorites” menu.
Dashboards are powerful and customizable, and uses can vary greatly depending on how your business measures success. There are a few common uses that can help get you started.
Business / Executive Metrics
How does your business measure success?
If the answer to that question can be found in a database, internal website, or via monitoring metrics, it can be displayed in a dashboard. Custom datasources can be used to bring in details from a database, such as revenue earned by day, or from another tool such as Google Analytics.
With the wide variety of widgets available, you can easily provide meaningful metrics to your team. Whether it is the status of an application, number of emails in queue, or the flow of beer from your kegerator.
Device Dashboard
One of the most common uses for dashboards is an overall view of how similar devices are performing across groups, customers, or locations.
Some common Custom Graph widgets that are often created include:
- Network devices – Top 10 Cisco switch CPU across all Cisco
- Network devices – Top 10 interface utilization across all snmp64 interfaces
- SQL – full table scans across all SQL servers
- SQL – latch and lock wait times across all SQL servers
- SQL – lock timeouts across al SQL servers
- SQL – Transactions across all SQL servers
- Windows servers – Active Dir – Replication across all Windows servers
- Windows servers – Active Dir – Sessions across all Windows servers
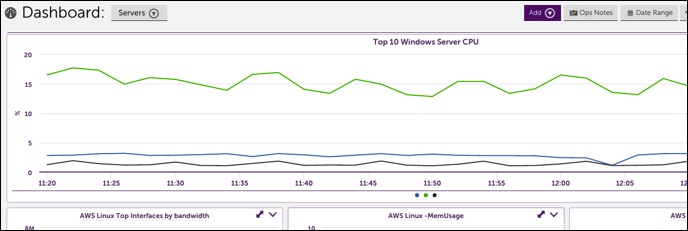
- Windows servers – CPU across all Windows servers
- Windows servers – Exchange – messages submitted across all Exchange servers
- Windows servers – Files opened across all File servers
- Windows servers – IIS – total requests across all IIS
- Windows servers – Memory across all Windows servers
Network Dashboard
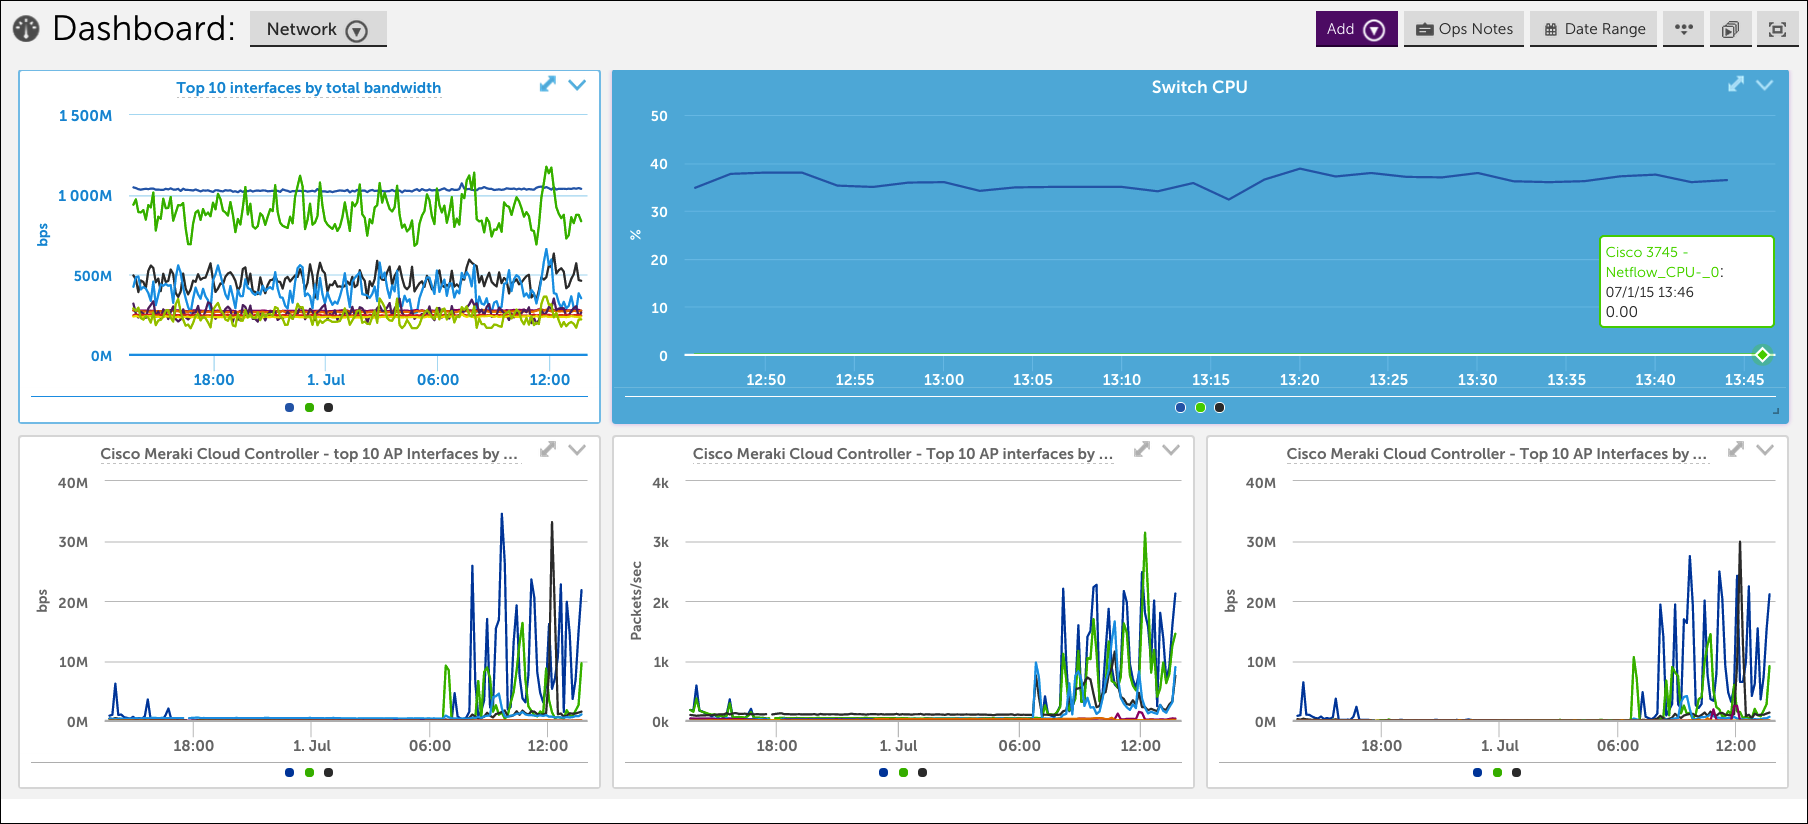
A dashboard can be a great way to keep tabs on what is happening with your network. Common widgets include:
- Alert status of network components
- Top 10 interfaces by total bandwidth
- Top applications (pinned from Network Traffic Flow Analysis)
NOC Overview
“Green is good.”
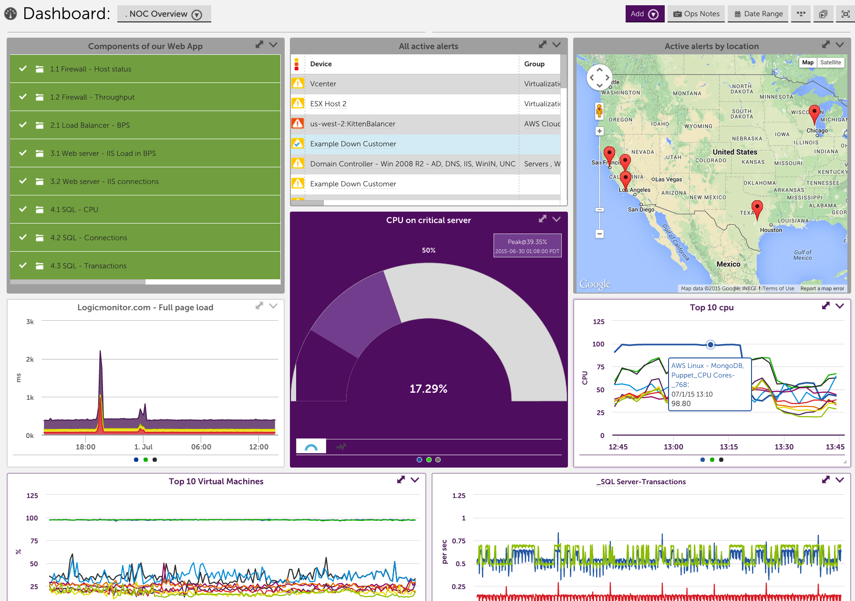
To make sure you’re the first to know if an issue arrises with a customer or application, set up a NOC overview dashboard. Recommended widgets include:
- Device NOC widget – Configured by customer, device group, or application
- Alert widget – sorted by severity
- Map widget – quick view of status based on location
- Custom Graphs for top 10 based on datapoints critical to your business
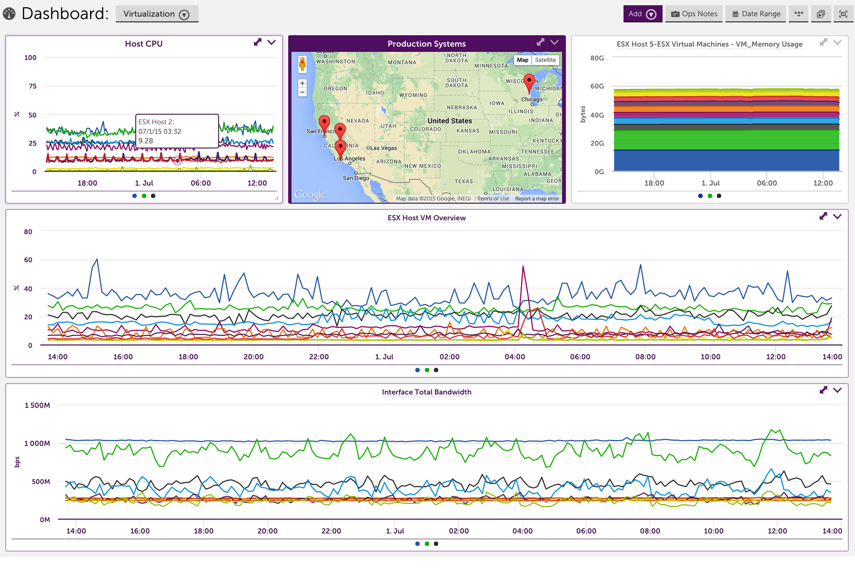
Virtualization
Virtualization is powerful, but keeping tabs on what is happening can be tricky. Dashboards are often used for an at a glance view of VM performance and status. Common widgets added for ESX Devices:
- ESX – Top 10 CPU across all VMs/ESX hosts
- ESX – Top 10 Disk Ops across all VMs/ESX hosts
- ESX – Top 10 Memory across all VMs/ESX hosts
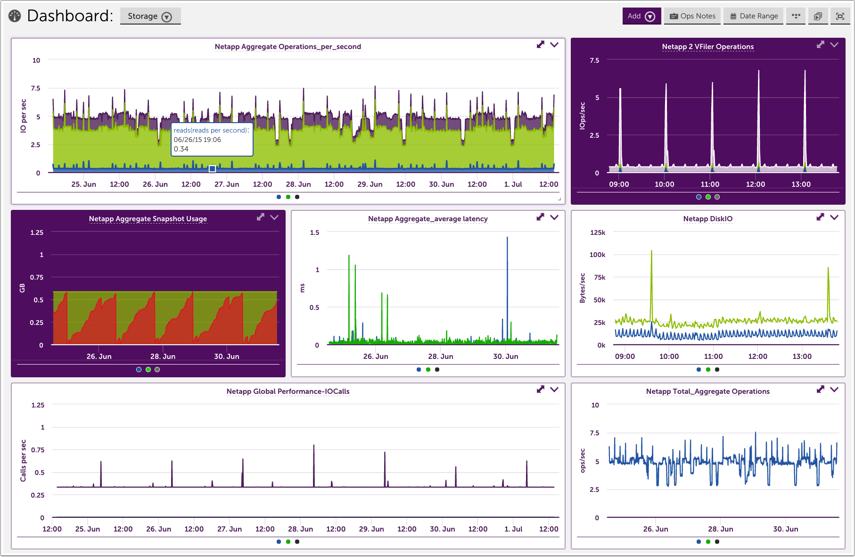
Storage
Storage is a specific example of a Device Dashboard, but given the number of customers who take advantage of our Netapp monitoring it is worth its own mention. See the example below for some helpful widget ideas.
Keep in mind that this is taking advantage primarily of the Custom Graph Widget. If you’re looking for an individual or specific aggregate metric, the Gauge or Big Number Widget may be more powerful.
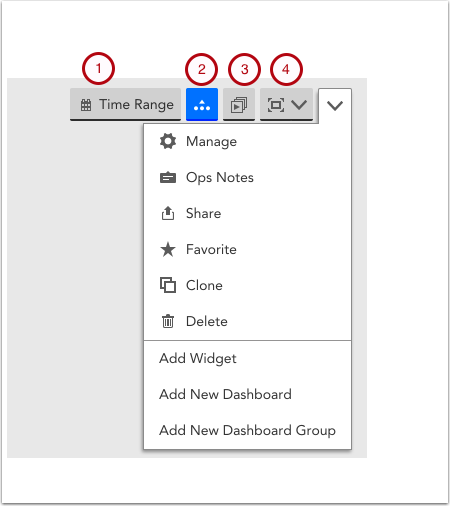
Toolbar functions
The dashboard toolbar is where you add and manage dashboards, as well as:
- Configure Date Range to be a standard period of time, such as last 24 hours, or a custom time period. The date range impacts the range of data displayed for all dashboard widgets.
- Expand or collapse all widget legends.
- Present a slideshow of different dashboards by choosing a group of dashboards to auto rotate through.
- Display the dashboard in full screen view.
Manage
This will take you to the full Manage Dashboard configuration window. From here, you can make your Dashboard public or private, edit its name and owner, set the Dashboard as your account’s default Dashboard view, and create a dynamic Dashboard using Dashboard Tokens.
Ops Notes
OpsNotes allow you to add time stamped annotations to your Dashboard’s graphs in order to identify correlations between performance and events, or simply to demarcate historical events such as upgrades.
Favorites
Favoriting a Dashboard will save it to the “Favorites” group in your Dashboard navigation panel. This will centralize your most frequently viewed dashboards in one location.
Clone
Cloning a Dashboard will allow you to replicate its configuration and apply it to a new set of devices using Dashboard Tokens.
Add Widget
Add a Widget to your Dashboard. Click here for a full list of available widgets and their respective configuration best practices.
Add New Dashboard
Create a new Dashboard. Click here for instructions on Dashboard creation best practices.
Add New Dashboard Group
Create a Dashboard group. Best practices recommend you organize Dashboards based on shared attributes, such as displaying content related to a specific datacenter/office location, end user, etc.
Isolating a graph line
It’s not uncommon to have a graph with a lot of data where you want to view just one or two lines. To do so, click on the line(s) in the graph. The legend will be replaced with only the selected lines and the ability to isolate the view.
To remove the isolation filter, click clear.
“Faux” Full Screen View
Most browsers will force you to exit full screen mode after 24 hours, meaning you have to adjust your full screen display at least once each day. To avoid this, LogicMonitor uses a “Faux” full screen view, which hides the lefthand navigation bar as well as gives you the option to hide your Dashboard titles and top navigation panel.
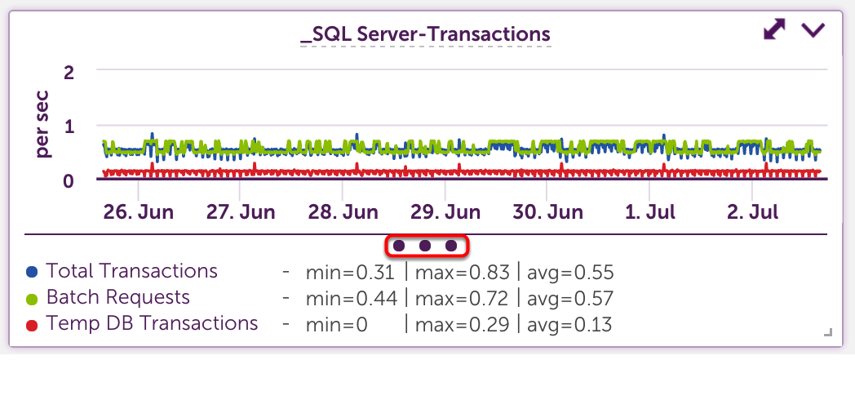
Legends
Widget legends are collapsed by default. To view a legend, you can select the expand all option from the header (number 4 above), or click on the three dots at the bottom of the widget as show below.
When expanded, legend details will paginate if they exceed the allowed space. If there is room, min, max, and average data will display.
Widget detail view
You can expand any widget by clicking the two headed arrow in the upper right corner. Doing so will provide a more detailed view.
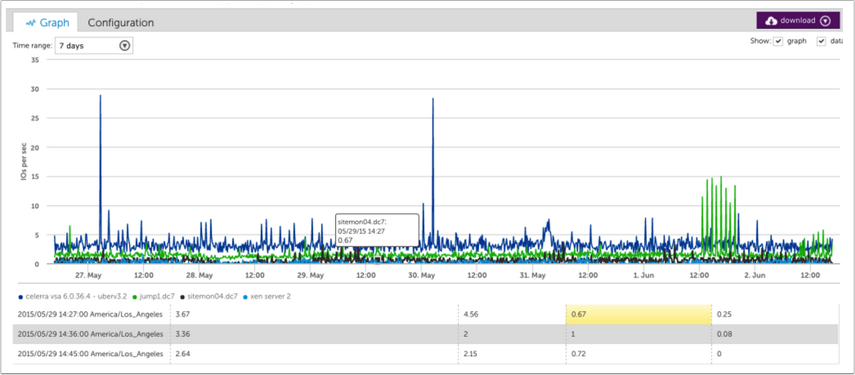
When graphs are expanded, you have the ability to view the underlying data. Hovering over a point in the graph will auto scroll the data table and highlight the corresponding datapoint.
Auto Zoom
Highlight an area on a graph to automatically zoom in on graph details. This can be done on the standard or expanded widget view.
Dashboards enable you to create customized, strategic views of your systems, ensuring the data you need to manage your business is available at a glance.
To initiate the creation of a new dashboard:
- Select Dash from the primary left-hand navigation panel.
- You’ll notice that another menu option titled “Menu” subsequently appears immediately below it. Click this option to display the Dashboards tree.
- From the Dashboards tree, select Add | New Dashboard.
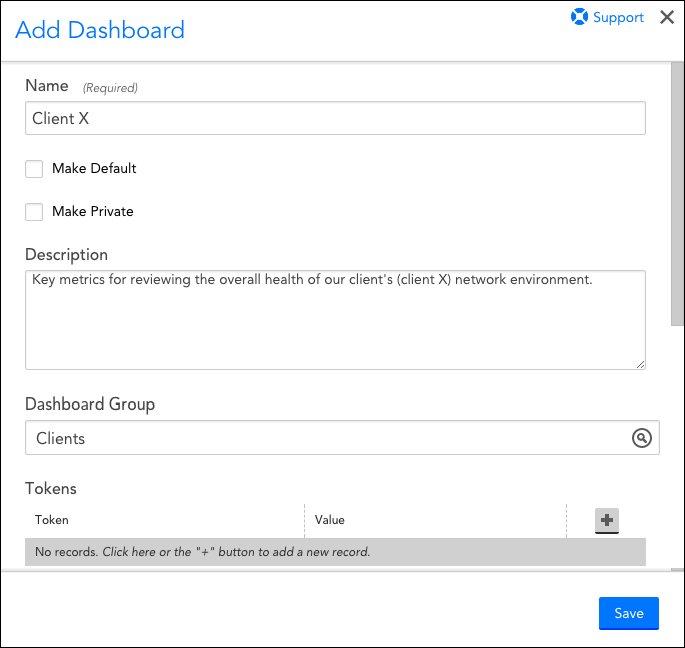
As shown (and discussed) next, the Add Dashboard dialog box displays with several settings that require configuration.
Name and Description
In the first two text fields, enter a name and description for the dashboard. Dashboard names cannot include the operators and comparison functions listed in the Complex Datapoints support article.
Make Default
If you’d like this dashboard to be the dashboard that initially displays each time you open the Dashboard page, check the Make Default option.
Note: If no default dashboard is set for your user account, the dashboard you most recently viewed will initially display when you open the Dashboard page.
Make Private
If you’d like your new dashboard to be available only to your user account, check the Make Private option. Many users find that private dashboards make great sketch pads or testing grounds for investigating on-the-fly issues or testing new widgets. The ability to create private dashboards is governed by a user’s assigned roles.
If the Make Private option isn’t selected, then it’s implicitly implied that the dashboard is public. Dashboards that are intended to be viewed by more than one user should remain public dashboards. Whether (and which) public dashboards are available to users for viewing and management is governed by a user’s assigned roles.
Administrators have the ability to view, add, and edit private dashboards for all users to enable creation of dashboards for internal and external customers. Administrator access to all dashboards also facilitates troubleshooting and overall dashboard management.
Group
If you’d like to assign your new dashboard to a dashboard group, enter the name of the group into the Group field. As you type, suggested results are made available for convenient selection from this field’s drop-down menu. If you’d like to assign your dashboard to a group that doesn’t yet exist, you may create a new group on the fly by entering the new group’s name into the Group field and then selecting it from the list of suggested results.
Dashboard groups are beneficial if you have a set of dashboards you often review together, if you have more than 10 dashboards, or if you want to assign view and manage permissions by role.
By grouping your dashboards, role-based access control is greatly simplified. Organizing your dashboards into groups also makes it easier to navigate the dashboard dropdown, and easily jump between functional areas, device types, or customers when looking for a specific overview.
Using Dashboard Tokens
Dashboard tokens allow you to apply a single dashboard template to different device or website groups simply by changing the tokens’ values. This is particularly useful for companies who would like to clone a common dashboard setup across multiple end users or datacenter/office locations.
Default Tokens
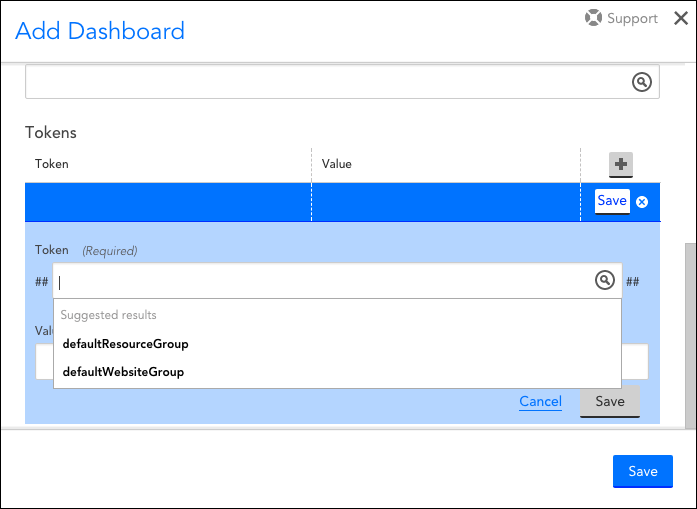
LogicMonitor provides two default tokens. To access them, click the + icon and place your cursor into the Token field. They display as suggested results, as shown next.
- ##defaultResourceGroup##. All widgets added to this dashboard will default to pulling data from the device group specified as this token’s value. For example, let’s say a managed services provider (MSP) has organized each customer’s devices into their own device groups titled “CustomerA_Devices,” “Customer B_Devices,” and so on. To create a dashboard that reflects only the performance of customer A’s environment, this token’s value would be set to device group “CustomerA_Devices.”
- ##defaultWebsiteGroup##. All widgets added to this dashboard will default to pulling data from the website group specified as this token’s value. Using the previous example, to display only customer A’s website data, this token value would be set to website group “CustomerA_Websites.”
Note: Once you’ve saved a new dashboard with one or both of these default tokens established, you can go back into the dashboard’s settings in edit/manage mode to check the Overwrite existing Resource/Website Group fields with ##defaultResourceGroup## and/or ##defaultWebsiteGroup## tokens option. When checked, this option automatically replaces any pre-existing values set in your widget definitions with these default tokens. This is particularly useful if you would like to templatize a pre-existing dashboard for repeated use across customers, datacenter locations, and so on.
Custom Tokens
In addition to the two default tokens, you can select the “+” icon to add custom tokens.
Unlike default tokens, the “value” for custom tokens is not a lookup field, but rather a text input. As such, the value of your custom tokens can be any string. The primary use case for custom tokens is to facilitate the input of new customer data after cloning a dashboard.
Continuing with the previous example, let’s say the MSP has cloned customer A’s dashboard for use with customer B. And that, on this dashboard, there is a table widget that displays the remaining CPU for one of customer A’s servers. If the MSP used a standardized naming strategy for all their devices (e.g. CustomerName.server), they could simply add a custom token to their dashboard (e.g. ##CustomerName##) and define the value as the name of the customer to which this dashboard is dedicated (in this case, customer A). Then, in the table widget’s devices field, they would use ##CustomerName##.server. Strategically, this means that after the MSP has cloned this dashboard for customer B, all they would have to do to populate customer B’s data is replace the value of ##CustomerName## in the dashboard’s Manage Dashboard dialog box with the name of customer B.
Using Tokens in Widgets
The tokens defined in your Dashboard’s ‘Manage’ Dialog act as filters for each of the widgets that will be added to the Dashboard. As a result, if you specify a device group as the value for ##defaultResourceGroup##, only devices or cloud resources residing in that group will appear in the “Resource” lookup when configuring your widgets.
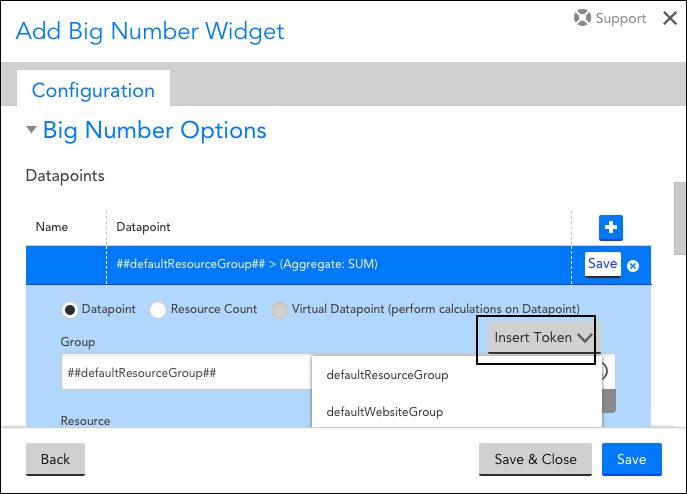
To aid the insertion of your default or custom tokens, when you select values for a widget’s Group, Resource, Resource DataSource, or Datapoint fields, an Insert Token dropdown will display all the tokens you have defined for this Dashboard.
Note: When referring to a dashboard tokens in a widget field, please keep in mind they are case sensitive. Fields not matching the token’s case may result in a widget error.

