Amazon Web Services (AWS) is almost ubiquitous with the terms “cloud computing” to many. With over 175 services, it is easy to understand why the growth and branding are strong. Here’s a fun game:
Which of these is NOT the name of an AWS Service offering:
- Elastic Compute Cloud (EC2)
- DynamoDB
- CodeStar
- Lumberyard
- Elemental MediaConvert
- QuickSight
They all are. It is likely you may have heard of many of these, but not all. It is less likely you can give a two-sentence brief on each of them or know what they do. Cloud computing often runs into a problem of scale. The scale of the cloud offerings and the scale of what you need from the cloud are very different. AWS is just one example of how cloud growth is continuing and ever-changing.
Amazon Web Services
Amazon Web Services offers everything from Infrastructure-as-a-Service (IaaS) through Platform-as-a-Service (PaaS) cloud services. For AWS, it is a matter of meeting its customers where they are.
Traditional on-premise infrastructure groups are starting to move their infrastructure to a hybrid cloud or exclusively cloud layout. AWS offers services like Elastic Compute Cloud (EC2) that provide virtual infrastructure to run servers that are managed by the customer and allow the same flexibility of function as running your own servers. Many of these customers will also use Simple Storage Service (S3) as a service to hold the information needed for their applications to function. These clients will also likely utilize Virtual Private Cloud (VPC) to provide the networking protection they are used to running on their own servers.
However, AWS also targets the world of cloud-native organizations. These organizations will likely leverage cloud services like Lambda, AWS’s serverless on-demand computing power. They may also leverage Kubernetes (k8s), often using AWS’s Elastic Kubernetes Service (EKS) to provide the implementation of k8s to make their software run.
There are any number of combinations of AWS services geared to all sectors of the market. You do not need to be a high tech company to leverage AWS. Their goal is to bring cloud computing optimizations to all of their customers, wherever they are, meet them at the level they need, and help them serve their business needs.
Monitor Your AWS
Now that you are adopting your AWS cloud strategy, you will need to be able to monitor and interact with these services to make sure your infrastructure is holding up its end of the bargain. It is nearly impossible for one person to hold the entirety of AWS’s offerings in their head, let alone be able to understand which aspects are important to monitor or be concerned about. Some very obvious metrics to look at are simple status checks for the cloud services you are leveraging. These could be as simple as check that an EC2 instance is functioning, however, it is often more important to understand that the EC2 instance you are looking at is connected to the other services that combine to provide business functionality. For this, LogicMonitor offers a solution called Service Insights that allows you to logically group your monitored services to business-level functionality.
Other known metrics to look for are CPU Utilization. For example, looking at your Relation Database Service (RDS) may be important, but at what level do you need to be concerned? LogicMonitor provides suggested Alert Thresholds for this and many other metrics for AWS cloud services so you can have visibility out-of-the-box to some critical infrastructure.
As you branch out to more niche services, the knowledge of what to monitor may become even fuzzier. For example, what metrics should you monitor for AppStream? LogicMonitor provides an out-of-the-box threshold for helping monitor thresholds of this service. When looking at SageMaker, what metrics matter? LogicMonitor provides several thresholds around disk and memory utilization, as well as suggested thresholds for invocation errors.
AWS can be a tangled mess or it can be a business lifeline. Let LogicMonitor help you understand and optimize your AWS cloud services so that you can focus on the important aspects of running your business. LogicMonitor can be the tool to help you gain confidence in the functionality of your AWS infrastructure and grow your responses to cloud infrastructure needs before they become business-critical outages. With more than 200 out-of-the-box alerts for metrics across the monitored AWS services, you can trust LogicMonitor to help you monitor your infrastructure.
To learn more about how LogicMonitor can help you monitor and understand your AWS usage and infrastructure or to see it in action, sign up for a free trial.
Hybrid IT environments enable Enterprises to optimize factors such as performance, cost, agility, and security, but they also introduce complexity. Containers are a great way to reduce some of this complexity by standardizing how applications are developed and deployed. LogicMonitor enables the use of containers by making it easier for ITOps and DevOps teams to get visibility into their containerized applications, which is why we’re excited to announce support for Bottlerocket: the new container-optimized OS by Amazon Web Services (AWS).
Increase Visibility and Reduce the Complexity of Your Hybrid IT Environment
Bottlerocket is an operating system for running containers that helps reduce management overhead by making OS updates easy to automate. It uses container orchestration services such as Amazon EKS, minimizes update failures, and improves resource usage. LogicMonitor’s container monitoring, LM Container, is fully supported for AWS EKS clusters with nodes running Bottlerocket OS. By enabling teams to run containers more efficiently and providing full visibility into workload performance, AWS Bottlerocket and LogicMonitor together are helping ITOps and DevOps teams maximize the benefits of using containers in the first place.
Getting started with Bottlerocket is as easy as selecting the Bottlerocket-specific AMI for your EKS cluster. To then deploy LM Container for insight into the cluster, simply run a few quick Helm install commands and voila! Instant visibility into the nodes, services, deployments, pods, and containers running in the cluster, as well as comprehensive performance metrics specific to the containerized applications LogicMonitor automatically detects:


We’re excited to be invited by AWS as a launch partner for Bottlerocket, which as of today is generally available. If you’re not already using LogicMonitor, request a free trial today to start monitoring your containerized environments.
Amazon Web Services Elasticsearch Service enables an organization to deploy, secure, and run their Elasticsearch clusters. AWS Elasticsearch is a cost-effective way to operate at scale.
In this article, we will cover:
- What are the available metrics?
- How to add more meaningful calculated metrics
- What are the key metrics?
- Which metrics to use Anomaly Detection dynamic thresholds on?
What Is Elasticsearch?
Elasticsearch offers a way to provide quick search experiences for your applications, websites, and data lake catalogs. It can also be used to monitor and collect logs from your infrastructure and applications. Elasticsearch is AWS’s service based on Elastic’s open-source Elasticsearch coined as an “open-source, distributed, RESTful search engine”. It is designed to provide fast, relevant, and scalable searching for your data.

AWS Cloudwatch Metrics
Elasticsearch publishes data points to Amazon CloudWatch for your Elasticsearch instances. CloudWatch enables you to retrieve statistics about those data points as an ordered set of time-series data, known as metrics. For Elasticsearch service, Amazon listed a few basic metrics and their Recommended CloudWatch Alarms.
Why Should I Add My Own Metrics?
LogicMonitor introduced Complex Datapoints to try to bring understanding around metrics value over time or as percentages. Tracking available capacity using raw values such as ClusterUsedSpace is a hard task. A complex datapoint that calculates the percentile is much more meaningful and easier to alert on.
ClusterUsedSpacePercent = (ClusterUsedSpace/(ClusterUsedSpace + FreeStorageSpace))*100
CloudWatch enables you to retrieve https errors codes 4xx and 5xx as raw values. Consider the next question: Is the value 2 for the 5xx metric good or bad? And how good (or bad) is it? Usually, when I present this question, the person would say, “It depends how many requests”. In this case, too, a complex datapoint that calculates the percentile is much more meaningful and easier to alert on.
RequestCount5xxPercent = 5xx / (5xx + 4xx + 3xx + 2xx) if (5xx + 4xx + 3xx + 2xx) > 0 else 0
RequestCount4xxPercent = 4xx / (5xx + 4xx + 3xx + 2xx) if (5xx + 4xx + 3xx + 2xx) > 0 else 0
What Are the Key Metrics?

ClusterUsedSpacePercent (Complex Datapoint)
A complex datapoint that calculates the percentage of the cluster space that is used. By default, LogicMonitor recommends a warning at 85% used and an error at 95% used.
ClusterUsedSpacePercent = (ClusterUsedSpace/(ClusterUsedSpace + FreeStorageSpace))*100
CPUUtilization
The average maximum percentage of CPU resources used for data nodes in the cluster. LogicMonitor recommends a warning at 85% utilization and an error at 95% utilization.
ClusterStatusRed
This indicates that the primary and replica shards of at least one index are not allocated to nodes in a cluster. LogicMonitor recommends an error if this value is not 0.
ClusterStatusYellow
This indicates that the primary and replica shards of at least one index are not allocated to nodes in a cluster. LogicMonitor recommends an error if this value is not 0. Please note that if you do not have replication for your Elasticsearch instances you will want to edit this metric to not alert you.
JVMMemoryPressure
This metric shows the maximum percentage of the Java heap used for all data nodes in the cluster. LogicMonitor recommends a warning if this value is above 80.
What Should I Enable Anomaly Detection Dynamic Threshold On?
While using Dynamic threshold and Static thresholds for key metrics is expected, there are other use-cases.
Example 1
Enabling Anomaly Detection for Query and Fetch Latency is a way to denote the potential degradation of a service and a way to have advanced warning when there is a shift in expected operation.

Example 2
Enabling Anomaly Detection for Query and Fetch count is a way to denote potential abnormal load on the system (or onboarding new customers).

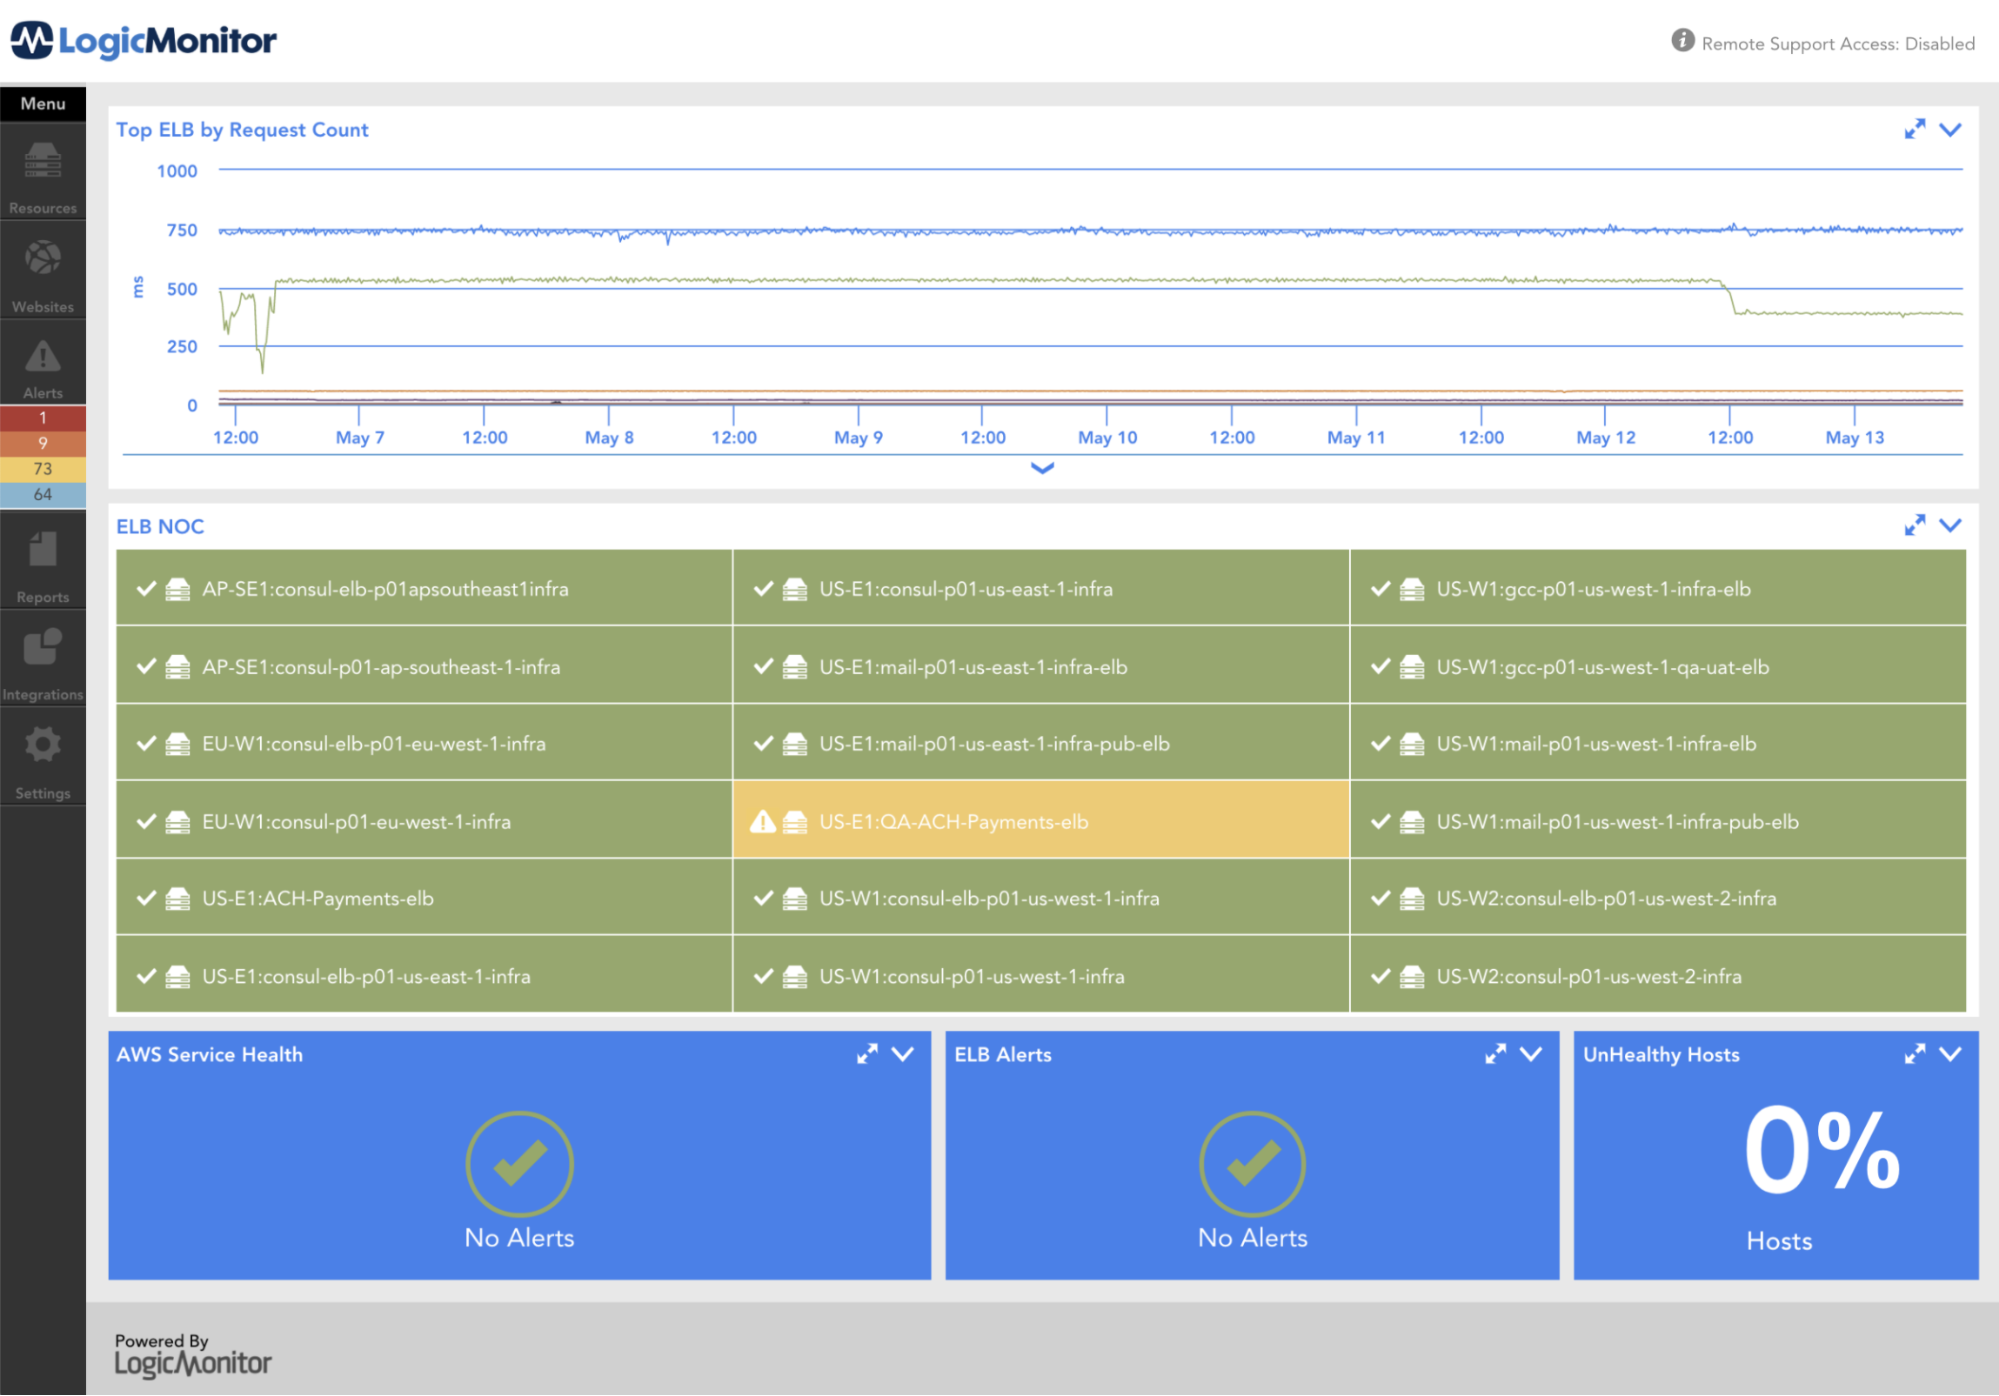
Amazon Web Services Elastic Load Balancer (AWS ELB) enables websites and web services to serve more requests from users by adding more servers based on need. Unhealthy ELB can cause your website to go offline or slow down dramatically.
In this article, we will cover:
- The available metrics
- How to add more meaningful calculated metrics
- The key metrics?
- Which metrics to use Anomaly Detection on
What is ELB (Elastic Load Balancer)?
Elastic Load Balancing automatically distributes incoming application traffic across multiple Amazon EC2 instances. It enables you to achieve fault tolerance in your applications, seamlessly providing the required amount of load balancing capacity needed to route application traffic.

AWS Cloudwatch Metrics
Elastic Load Balancing publishes data points to Amazon CloudWatch for your load balancers and your back-end instances. CloudWatch enables you to retrieve statistics about those data points as an ordered set of time-series data, known as metrics.
Why Should I Add My Own Metrics?
Let’s look at UnHealthyHostCount, UnHealthyHostCount is the number of target EC2 Instances that are considered unhealthy. By itself, it is not saying much. Consider the next question: Is the value 2 for the UnHealthyHostCount metric good or bad? And how good (or bad) is it?
Usually, when I present this question, the person would say, “It depends how many EC2 instances the ELB has”.
Scenario 1
- Number of EC2 instances managed by ELB: 2
- ELB status: Fatal, the ELB is non-operational, 100% of the EC2s are unhealthy.
- Prioritization: The problem is critical and we should fix it NOW. We are losing money!
Scenario 2
- Number of EC2 instances managed by ELB: 4
- ELB status: Error, the ELB might not support the Load, 50% of the EC2s are unhealthy.
- Prioritization: Address the problem according to the normal prioritization process.
Scenario 3
- Number of EC2 instances managed by ELB: 20
- ELB status: Warning, not a big concern, 10% of the EC2s are unhealthy.
- Prioritization: The problem is minor. It may eventually disappear by itself but keep an eye on it to make sure it is not escalating.
It’s important to note that trying to place an alert on a metric such as an unhealthy host count is not very useful. Even if we chose a number that works now, it is possible that we would change the size of the cluster that the ELB is serving (or just used Auto-Scaling-Group), and render the alert useless.
LogicMonitor introduced Complex Datapoints
UnHealthyHostRate= UnHealthyHostCount / (HealthyHostCount + UnHealthyHostCount)
What Are the Key Metrics?
UnHealthyHostRate (Complex Datapoint)
A complex datapoint, calculate the % of unhealthy hosts, more than 50% healthy hosts will be considered as critical.
UnHealthyHostRate= UnHealthyHostCount / (HealthyHostCount + UnHealthyHostCount)
HTTPCode_Backend_5XXRate_Rate (Complex Datapoint)
A complex datapoint, calculate the % of 5xx error from the total request.
HTTPCode_Backend_5XXRate_Rate = HTTPCode_Backend_5XX / RequestCount
HTTPCode_Backend_4XXRate_Rate (Complex Datapoint)
A complex datapoint, calculate the % of 4xx error from the total request.
HTTPCode_Backend_5XXRate_Rate = HTTPCode_Backend_5XX / RequestCoun
SurgeQueueRate (Complex Datapoint)
A complex datapoint, calculate the % of Queue, based on the SurgeQueueLength metric. SurgeQueueLength is the total number of requests (HTTP listener) or connections (TCP listener) that are pending routing to a healthy instance. The maximum size of the queue is 1,024. Additional requests or connections are rejected when the queue is full. For more information, see SpilloverCount.
SurgeQueueRate= SurgeQueueLength / 1024
SpilloverCount
The total number of requests that were rejected because the surge queue is full.
[HTTP listener] The load balancer returns an HTTP 503 error code.
[TCP listener] The load balancer closes the connection.
BackendConnectionErrors
The number of connections that were not successfully established between the load balancer and the registered instances. Because the load balancer retries the connection when there are errors, this count can exceed the request rate. Note that this count also includes any connection errors related to health checks.
What Should I Enable Anomaly Detection On?
While using Anomaly-Detection and Static thresholds for key metrics is expected, there are other use-cases.
Example 1
Enabling Anomaly-Detection for requests-per-second can identify unexpected load, this unexpected load can be a result of AWS ELB denial of service attack (more info about AWS (DDoS) attack).

Example 2
When requests dropping to zero can indicate a remote error (r.g. IOT device stop collecting signal).

The shift to cloud infrastructure does not remove the need for infrastructure management and administrators but rather necessitates a shift in their responsibilities. Cloud infrastructure has grown to be a ubiquitous part of the modern software industry. This is an amazing growth when you realize that Amazon did not announce Amazon Web Services, starting with Elastic Cloud Computing (EC2), until 2006. In under 15 years, a fledgling software infrastructure concept has grown to be an over $225 billion (USD) industry. This information comes before the current atmosphere has driven more companies to quickly adapt and accelerate their timelines to move to the cloud.
There are two ways to move to the cloud. The first is to use a simple “lift-and-shift” model which almost exactly mimics on-premise infrastructure. All of your applications, network, and storage infrastructure will be moved directly on to the cloud, replacing your on-premise infrastructure with cloud services designed to mimic said on-premise setups. For these, infrastructure management professionals simply transfer their knowledge of on-premise maintenance and monitoring to these cloud services. They are also able to hang up their wire cutters and crimpers to no longer walk into a server room like this:

The other way to transition to the cloud is more complete and asks more of an organization. Adopting a cloud-native approach to transitioning to the cloud will put a lot of pressure on an organization to change rapidly. The requirement is for all infrastructure engineers to start learning how to leverage cloud services to replace aging software infrastructure. They will be asked to help the software developers redesign and restructure the codebase. A good way to kick start this transition is to work with a Managed Service Provider (MSP) to help in the transformation.
The New Roles
As the shift to the cloud starts, infrastructure experts are asked to work hand in hand with development teams to think through the cloud infrastructure as it relates to developer and software needs. This growth continues during the transition and allows more ownership of the entire lifecycle of development to belong with the development team while also offering more early intervention for infrastructure professionals. The skills and expertise of running infrastructure on-premise will help these individuals understand the overall structure of a production environment and guide the decision making.
These new roles also offer greater understanding and visibility to the whole technology side of a business. The greater visibility often leads to streamlining and reducing costs by understanding inefficiencies and the needed scale. The clarity and awareness of this cloud infrastructure can be easily understood and improved upon by the existing infrastructure team as they grow in their new roles. Leaning on their experience, a company can start defining its operation goals and planning for growth.

Clear Understanding of Goals
Working with IT Operations and Development teams to determine the needs and goals of cloud infrastructure becomes the next main target. The experience and expertise of the infrastructure professionals will help to guide the error budgeting needs of critical infrastructure. Meanwhile, they can partner with the development teams to continue to define the processes of moving to cloud infrastructure. These goals will help drive the business in a maintainable and secure way to the cloud. Often these goals will lead to a desire for stability and flexibility, leading to the adoption of multi-cloud infrastructure.
Multi-cloud infrastructure comes out of the desire to not be locked into a single point of failure and the desire to leverage different offerings. Growth in a multi-cloud infrastructure necessitates the growth of infrastructure engineers, as well as the development teams, to learn these new technologies. This growth continues to motivate understanding of the whole software lifecycle and promote unity for the entire organization. As the operational goals are adopted, the next step becomes the ability to monitor the infrastructure’s performance around these goals.
Monitor Your Goals
The ability to monitor these performance goals and infrastructure becomes the main goal of infrastructure operators in the cloud. The ability to understand multiple environments and support all levels of cloud growth are vital. As the infrastructure teams reach further into the software development lifecycle, they will want an ability to track and help support the development team. Similarly, the development team will want to be able to understand the performance of their software development lifecycle as well as the production performance of their infrastructure. Having a unified platform to view all of this information and set and track goals become a joint responsibility.

The need is to have a simple, unified monitoring system for infrastructure on-premise that can grow with a company as it adds cloud infrastructure. As a company grows through hybrid on-premise and cloud infrastructure to a full multi-cloud infrastructure, being able to monitor it all is important. Setting maintaining and monitoring goals through the growth stages of a company is critical to the trust of cloud infrastructure and cross-team belief and growth.
If you are ready to discover truly helpful monitoring as your company goes through these growth stages, try LogicMonitor’s platform to gain insight into the performance of your environment. The multitude of infrastructure we monitor will help infrastructure engineers and development teams grow to fully scalable cloud teams. Try it free, or book a free demo today.
Even with a complete understanding of the benefits that come with running a hybrid environment, companies are still challenged with digital transformation best practices: what to move, when to move it, what’s being spent, how it’s performing, and what’s being overutilized and underutilized.
This is why Amazon Web Services (AWS) is one of the most strategic partners in LogicMonitor’s ecosystem. Many of our enterprise customers have workloads running in the cloud giant, whether they’re just experimenting or going all-in. It’s important to us at LogicMonitor to make sure we’re staying up-to-date with the latest and greatest services. With both companies being customer-obsessed, a strong partnership has always felt natural. Our shared goal is to ensure our customers are monitoring holistically, migrating securely, and optimizing effectively.
Automatic Upgrades Every Few Weeks
We want to give the people what they want, and what they want is more. They want to see more, know more, and do more. So much so that this has become the three-core pillar that we live by at LogicMonitor. Since the beginning, LogicMonitor has been proud to release at least 15 versions per year, meaning the already impressive breadth of coverage is getting an upgrade every few weeks. This is all done automatically, without any heavy lifting required from our users. This type of continuous innovation is very much aligned with how AWS operates.
New AWS Services
Since January 1, 2020, we’ve released 17 new LogicModules to cover AWS services, from analytics to storage products. We have also added multiple AWS regions, bringing our total number of monitored AWS services to 45. This is in addition to the 1,800 out-of-the-box monitoring templates for every other technology in a customer’s environment.

In future blogs, expect to see “how to” posts that dive into each service, why it’s important, how to configure, and how we go beyond traditional metrics. Until then, here are a couple of the newer services we’ve added to hold you over.
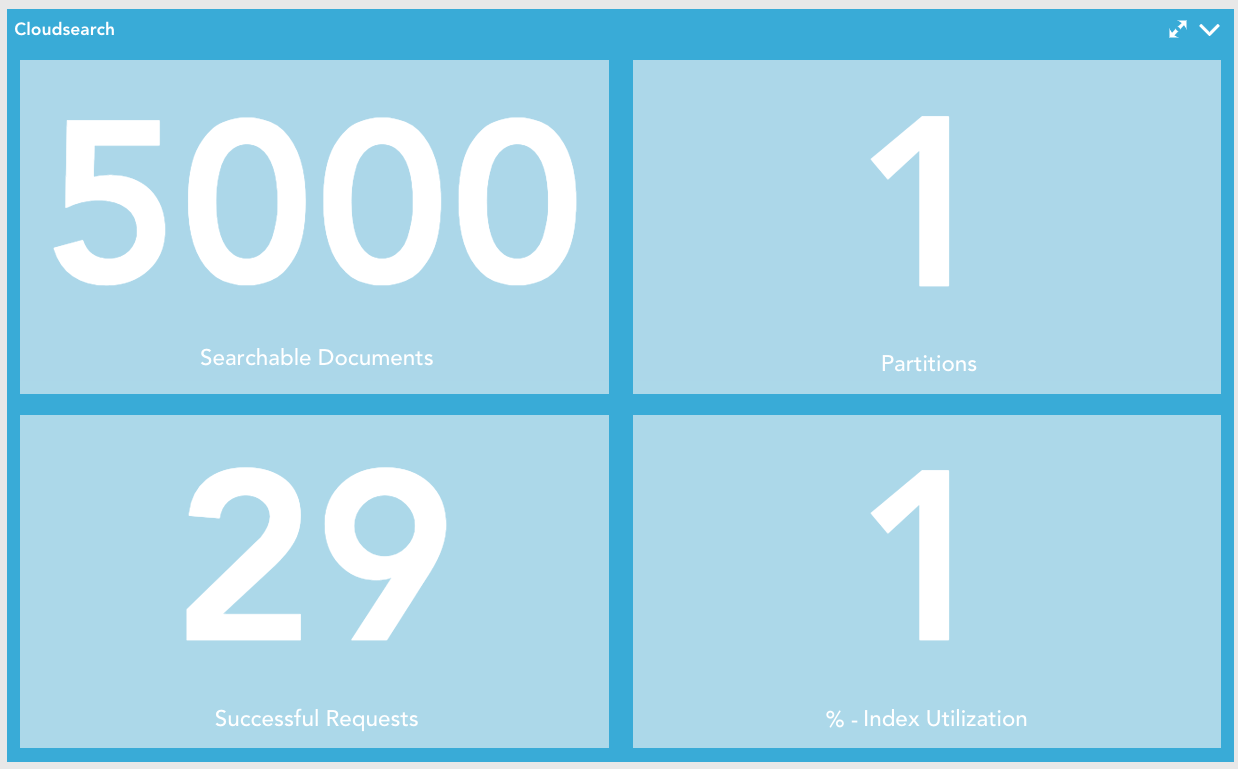
AWS CloudSearch
Amazon CloudSearch provides rich search capabilities to websites and applications. With the monitoring templates we provide, we can capture the metrics from CloudWatch and SDK. If your environment is not autoscaling, then by tracking the index utilization and number of partitions, you can make informed decisions on whether to scale up or down. With LogicMonitor, you’ll be utilizing the forecasting feature to know if you are going to need to budget for more resources.
AWS Step Functions
With AWS Step Functions you can coordinate multiple AWS services into serverless workflows, giving you more flexibility to build and update apps. To accurately monitor this service, AWS provides a good starting point. You are able to monitor and baseline execution times and time out rates of the services being used. With the historical retention of LogicMonitor and its Early Warning System, you will be able to confidently come up with a valuable baseline and threshold for alerts. Some of the Step Function specific metrics that we monitor are the state machine’s execution times and statuses. Out-of-the-box we alert if an execution aborted, timed out, failed, or throttled.
Unlike cloud-only monitoring tools in the market, LogicMonitor supports CloudWatch services and AWS SDK. This allows LogicMonitor to report on the performance and availability of your AWS resources where it matters most — from the perspective of the servers accessing them. Adding support for CloudWatch API is easy. Just do it once, and it applies to all AWS services that have a monitoring template within LogicMonitor.
Cut Through the Red Tape and Monitor Within Minutes
More often than not, people search for new monitoring tools because there was an outage or service disruption that should have been picked up by their existing toolset. In this scenario, the need for a platform that is trusted to keep up with the evolving technological landscape was yesterday. After teams finalize due diligence for the next tool, they don’t have the luxury to wait for legal and procurement teams to finalize redlines back and forth.
The addition of LogicMonitor’s listing on the AWS Marketplace enables customers to get their hands on our platform quicker than ever. When purchasing LogicMonitor via AWS Marketplace, buyers are able to consolidate billing and streamline the number of vendor contracts. Through AWS Private Offers, LogicMonitor sends you an agreed-upon click-through contract. Within minutes the process is complete, and LogicMonitor shows up as a line item on your next AWS bill.
Amazon Managed Streaming for Kafka (MSK) is an AWS service that helps build and run applications built on Apache Kafka. Kafka is a platform designed to handle continuous streams of small records or events generated from a large number of devices and applications.
In order to ensure your Kafka environment is running efficiently, it is important to adequately monitor it at both the cluster and broker level. This helps you identify performance bottlenecks, determine when it is necessary to scale your applications, and prove that they are successfully streaming messages through Kafka at low latency.
We expanded our monitoring coverage to include support for AWS MSK, and provide two DataSources to collect and alert on broker and cluster metrics. After adding your AWS environment and enabling the new services, import our newest DataSources to begin monitoring. Clusters and brokers will be automatically discovered and grouped together for easier management.

Additionally, both clusters and brokers will receive useful auto-properties such as broker identifier, node type, and Kafka version.

Using the Cloudwatch API, LogicMonitor polls directly from AWS and begins populating useful Kafka datapoints, such as controller count, partition count, disk used, and network traffic. Default alert thresholds provide advanced notification when potential issues are detected. As a best practice, we recommend keeping tabs on the following:
- Root Disk Used: This is a measurement of the percentage of the root disk used by a broker. It’s important to monitor the amount of free disk space available, because a full disk may cause interruptions to the Kafka service. By default, we include a threshold to alert when the space remaining reaches 5% or less.
- Active Controller Count: Only one controller per cluster should be active. A threshold is set to alert when more than one active controller is present within a cluster for an extended period of time.
- Offline Partitions Count: This measures the total number of partitions that are offline in the cluster. If partitions go offline, this may indicate the need to increase partition replication. This could also expose a need to scale up the broker count as well if fetches aren’t keeping up.
With LogicMonitor’s AWS MSK monitoring, you can collect, visualize, and alert on data from your cloud Kafka infrastructure alongside the rest of your hybrid infrastructure within a single pane of glass. Sign up for a free trial today!
With Azure Virtual Machine (VM) Scale Sets you can automatically scale the number of VMs running an application based on the compute resources required. VM Scale Sets make it easier to deploy and manage a large number of Virtual Machines consistently and allow you to use and pay for the minimum resources needed at any given time, but they also introduce a few monitoring challenges. VMs are automatically created and terminated as needed based on pre-configured criteria, which can make it challenging to keep monitoring up to date. Additionally, applications usually run across multiple VMs in a VM Scale Set. Combined with the frequent creation and termination of VMs, this can make it difficult to get a consistent view of application performance over time. To achieve comprehensive visibility, your monitoring tool should include automated resource discovery, meaningful metrics for Azure VMs and any running applications, and the ability to aggregate data across VMs in a VM Scale Set.
Automate resource discovery
You may choose, for example, for the number of VMs in a VM Scale Set to be auto-scaled based on CPU usage. As the CPU usage for the VMs in the set reaches a pre-configured threshold, new VMs are added. Similarly, as CPU usage for the VMs falls below a pre-configured threshold, existing VMs in the set are terminated. To maintain comprehensive visibility into your applications and underlying VMs, it’s important that new VMs are added into monitoring in a timely manner after creation, and that terminated VMs are removed from monitoring to avoid clutter. Without an automated solution, it can be challenging to keep monitoring up to date. You should use a monitoring tool with dynamic discovery that adds and removes these VMs to and from monitoring automatically. LogicMonitor uses the Azure Resource Manager APIs to automatically discover new VMs and add them into monitoring, as well as to identify terminated VMs and remove them from monitoring. Data collection and alerting starts immediately once a VM is added into monitoring, ensuring instant visibility.
Monitor meaningful metrics for VM Scale Sets

Some VM metrics are available via Azure Monitor – these basic metrics include CPU usage, bytes received and sent on network interfaces, and disk read/write operations. What these metrics don’t include are operating system (OS) level metrics like disk usage and memory usage, as well as application-specific performance metrics. You can extend Azure to collect the OS level metrics by enabling the monitoring diagnostics extension, or you can use a monitoring tool that uses an agent or collector to make queries to the VMs to get OS and application-specific metrics, typically in addition to the basic metrics available via Azure Monitor. An agent-based approach may require custom automation to ensure that an agent is installed on every VM that is created in the VM Scale Set, and that agent versions remain consistent and up to date, while an agentless solution such as the LogicMonitor Collector can be installed anywhere (including outside of the VM Scale Set) and just needs to be able to make requests to the VMs in the set. The LogicMonitor Collector relies on traditional protocols such as SNMP, WMI, HTTP, and JDBC to collect the basic CPU and network interface metrics you’d get from Azure Monitor, as well as the OS level metrics such as disk usage and memory usage, and performance metrics for any running applications. This approach will provide you with more comprehensive monitoring for each of the VMs running in your VM Scale Set.
Aggregate data across VMs
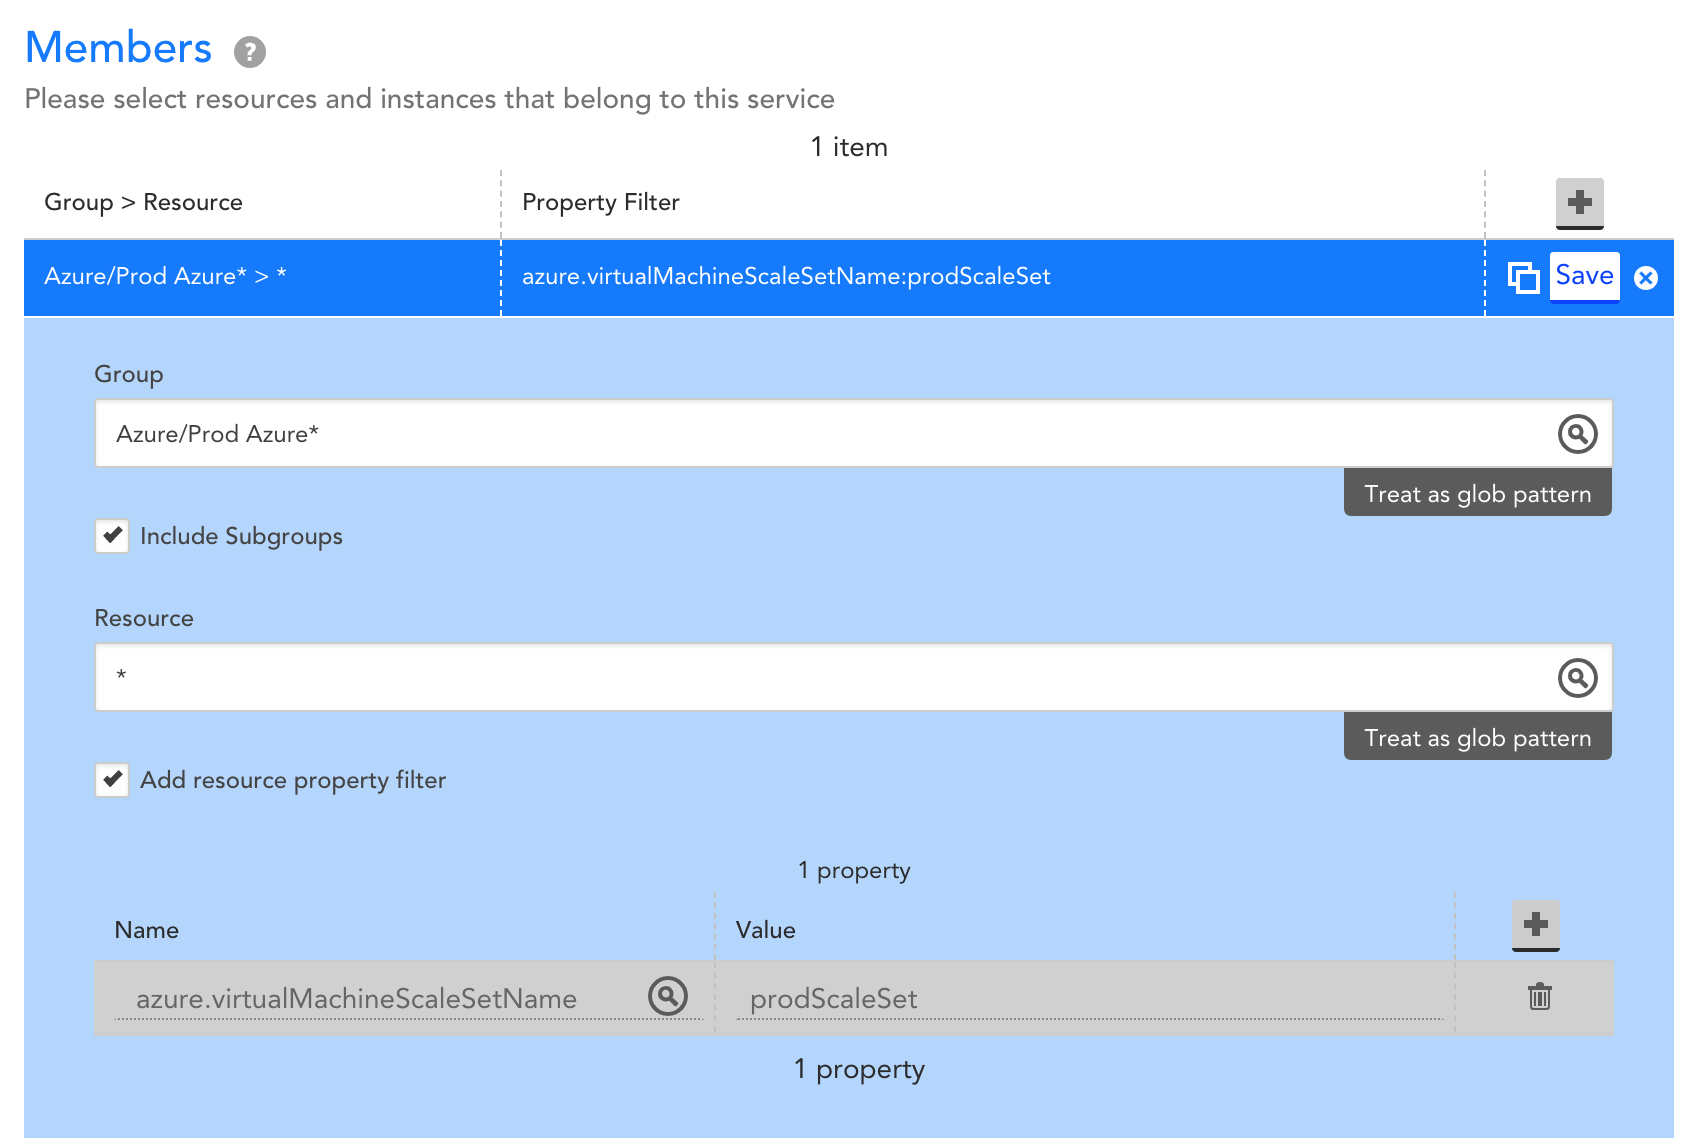
A monitoring solution with automated discovery can help ensure that what’s in monitoring reflects the VMs in your VM Scale Set at any given time, but it’s also important to ensure that you have a consistent view into application performance, regardless of changes to what VMs are running in the VM Scale Set. Terminated VMs may be removed from monitoring when they no longer exist, but retaining the performance data for the applications running on those VMs is critical to understanding how the applications are performing over time. Such an understanding can help you identify how releases and other changes impact application performance. By aggregating data across VMs in a VM Scale Set, you’ll get visibility into overall application performance, and how that performance is changing over time. With LogicMonitor’s LM Service Insight, you can dynamically group together monitored resources, such as VMs in a VM Scale Set, into a logical service. Key performance indicators can be aggregated across grouped resources to obtain insight into the performance of the overall application. For example, you might group together VMs that belong to a common VM Scale Set ‘prodScaleSet’ like so:
Let’s say the VMs in this Scale Set are supporting a web application, and running Apache web servers and MySQL databases. You may choose to aggregate performance metrics across the VMs like this:

The resulting service will provide you with visibility into the aggregate performance of the web application. As VMs are created and terminated within the VM Scale Set, LogicMonitor will automatically add and remove VMs as needed, the VMs that data is aggregated across will be automatically updated, and you’ll retain this consistent visibility into overall performance:

This means that performance data will persist as VMs in the Scale Set change, and you’ll be able to correlate releases and configuration changes with trends in application performance over time.
Additionally, you can configure alerts on this aggregate performance data, such that triggered alerts reflect your overall web application health and performance. This means that an individual VM alert that does not impact the overall web application’s performan
ce can be distinguished from a VM alert that does impact overall application performance. With LM Service Insight, a status page is created based on alert thresholds set for aggregate data, enabling you to see overall application alert status alongside alerts for the underlying VMs:

In summary, to comprehensively monitor Azure VM Scale Sets, you need a monitoring tool that has comprehensive VM monitoring, automated resource discovery that will keep monitoring up to date, and the ability to monitor and alert on data aggregated across your VMs. LogicMonitor does this all out of the box- sign up for a free trial today!
So a while back I got an email from our finance team. I was tasked to assist with tagging resources in our AWS infrastructure and investigate which items are contributing to certain costs. I don’t know about other engineers, but these kinds of tasks are on the same realm of fun as … wiping bird poop off your windshield at a gas station. So I did the sanest thing I could think of.
I deleted the email…
However, when LogicMonitor’s AWS Billing Monitoring came out, it was pretty easy to see that items are broken down, all out of the box. I wasn’t jumping head first onto the cost optimization train by any stretch of the imagination. But I was intrigued.
Apparently, tracking down all AWS resources is like moving to a new home. You pack everything, and for the first time in years, deep dive into the crevices of the garage to categorize everything. What is this instance? Are we using it? Is it running an app? Which one? That’s when I stumbled onto our mountain of orphaned EBS snapshots.
Orphaned Snapshots costing you $$$
In order to save data without paying crazy fees for EBS volumes, snapshots can be taken as a backup of the volume. It is much cheaper and you have the option of restoring the volume from a snapshot when needed. However, when an EC2 instance is terminated, even if the EBS volumes attached are deleted along with it, the snapshots leftover will be stored in s3 and you will be charged monthly. These can easily be forgotten and will pile up over time…and that is how you get a few 500GB snapshots from 2011 labeled “TESTING”.
Finding Orphaned Snapshots
There must be a programmatic way to identify orphaned snapshots since Amazon does not allow you to filter those natively. One of my team members is amazing with CLI one-liners. Check it out below:
comm -23 <(aws ec2 describe-snapshots --owner-ids AWS-ACCOUNT-ID --query 'Snapshots[*].SnapshotId' --output text | tr '\t' '\n' | sort) <(aws ec2 describe-volumes --query 'Volumes[*].SnapshotId' --output text | tr '\t' '\n' | sort | uniq)
However, if you want to extrapolate and manipulate that data (such as tag those snapshots), you will need to add on to that. What if you wanted to tag those snapshots every month? Would you copy and paste commands manually? Of course not, we aren’t animals. You can utilize a lambda function following cloudwatch event rules to do all that for you. Here is a sample script that tags all your orphaned snapshots.
Using LogicMonitor
If you have already tagged your snapshots, you can use LogicMonitor’s Cost By Tag DataSources and have immediate insight into your month to date spending.

I also created a datasource specific for Orphaned Snapshots so that I can measure datapoints like the aggregate size of all snapshots for a specific deleted volume or the oldest date of an orphaned snapshot.

Give it a try. Create a few dashboards, clear out some cruft, save some money and earn yourself a hearty pat on the back and a resounding “Thank You” from your boss. Thank yous are nice…
But so are gift cards.
Sometimes it’s necessary to run a maintenance API script in your LogicMonitor portal. For example, I move decommissioned devices into a specific folder because I no longer want to receive any alerts on these devices. An API script helps automate the process by running once a day to disable alerts on any new devices added to this folder.
One solution is running the API script in an AWS Lambda Function.
According to Amazon:
AWS Lambda lets you run code without provisioning or managing servers. You pay only for the compute time you consume – there is no charge when your code is not running. With Lambda, you can run code for virtually any type of application or backend service – all with zero administration. Just upload your code and Lambda takes care of everything required to run and scale your code with high availability. You can set up your code to automatically trigger from other AWS services or call it directly from any web or mobile app.
It’s perfect for running Python or Java scripts at a rate of once per day without having to configure a cron job or Windows Scheduled Task on a server.
There are a few little changes you’ll need to make in your Python script to get it to work in Lambda.
Steps to set up a Lambda Function:
- Write the Python code as normal
- In addition to the normal code, you have to define a handler. For a basic API Python script, the below will do. Just indent the rest of the code
def lambda_handler(request_obj, context=None):

A close statement is not required.
The default Python environment in Lambda is stripped down and doesn’t include very many modules. LogicMonitor API scripts require the “requests” module, which means we will have to build a virtual Python environment, install requests, zip it up, and upload to AWS.
There are a few ways of doing this, the easiest way to is by using PIP within an Ubuntu environment.
$ sudo apt-get install python-pip python-dev build-essential
$ sudo pip install --upgrade pip
$ sudo pip install --upgrade virtualenv
Next, make a directory to store our script and supporting python modules. In the current example, I’ve named it disablealerts because the script disables alerts on all new devices moved to a specific LogicMonitor group.
$ mkdir disablealerts
Then we need to install the requests package to the target directory as it is required for the script to run. This command will install requests to our disablealerts directory.
$ pip install requests -t disablealerts
Next, save the Python API script in the root of the disablealerts directory and compress
cd disablealerts
zip -r disablealerts.zip *
Now that we have our Python environment created and zipped we can create the Lambda Function in AWS.
Log into the AWS console and open the Lambda Section
- Click “Create Function”.
- Select “Author from scratch” and specify an appropriate name.
- Set the Runtime to Python 3.7.
- For Role, select “Choose an existing role”
- Select “lambda_basic_execution” for the existing role.

- Press the “Create Function” button
- Change the “Code entry type” to Upload a .zip file” and browse to .zip file create in the previous step and upload.
- The “Handler” needs to be the name of the python file to be executed followed by .lambda_handler, in example “index.lambda_handler”.

- The environment variables can be used for variables (optional). In the example, we could remove the Access ID and Access Key from the script itself and define them in the Environment section. The Python code to retrieve these values would be:
- AccessId = os.environ[‘AccessId’]
- AccessKey = os.environ[‘AccessKey’]
- Click the test button to run the script and ensure it works correctly in the Lambda environment.
To set the time interval click “CloudWatch Events” from the “Add triggers” section. This will open the “Configure “triggers” window and allow you to Select an appropriate rule or create a new custom rule. In the example for disabling alerts, the default rule “once_a_day_10_min_before_midnight” is perfect.

If you’re interested in learning more about how LogicMonitor can help in your environment, sign up here for a free trial or demo.