How we upgrade 10,000+ containers with zero downtime!
Managing Kubernetes version upgrades can be a formidable undertaking. API versions are graduated, new features are added and existing behaviors are deprecated. Version upgrades may also impact applications needed by the Kubernetes platform; affecting services like pod networking or DNS resolution. At LogicMonitor, we ensure our Kubernetes version upgrades are successful through a process designed to instill collaboration and due diligence in a repeatable fashion. Let’s jump into our Kubernetes upgrade best practices!
The Breakdown:
We run managed AWS EKS clusters in our environment. EKS clusters have a control plane managed by AWS and when a Kubernetes version upgrade is initiated, AWS upgrades the control plane components on our behalf. Our workload consists of a mixture of management and self-management node groups. During a Kubernetes version upgrade, AWS triggers an instance refresh on our managed node groups. To upgrade our self managed node groups, we trigger the instance refresh. To ensure nodes are cordoned off and gracefully drain of pods, we run a tool called the aws-node-termination-handler. As nodes running the prior version of Kubernetes are drained and terminated, new instances take their place, running the upgraded Kubernetes version. During this process thousands of containers are recreated across our global infrastructure. This recreation occurs at a rate which does not impact the uptime, accessibility or performance of any of our applications. We upgrade Kubernetes clusters with zero downtime or impact to our production workloads!

Datapoints we’ve found especially useful when monitoring Kubernetes version upgrading:
- Auto Scaling Group Metrics
- Desired Instance Count
- Max Size
- Min Size
- Total Nodes
- Cluster Autoscaler Metrics
- Number of Unscheduled Pods
- Number of Evicted Pods
- Number of Node in Unready State
- Number of Node Not Started
- Number of Node in Ready State
The Team
Our version upgrades are performed by a team of three engineers who play specific roles during the process described below. Ops(New), Ops(Lead) & Ops(Sr):
Operator (On-boarding) Ops(New)
This operator is new to the cycle of Kubernetes upgrades. As a new member of the team, their main goal is to familiarize themselves with the upgrade process as a whole; studying past upgrades, learning the process and supporting the current upgrade efforts. In this role, the operator will perform upgrades on both a production and non-production cluster under the guidance of the operator responsible for research and development Ops(Lead).
Core Duties
- Responsible for executing processes on development/pre-production cluster
- Responsible for executing processes on a production cluster
Operator (Lead) Ops(Lead)
This operator is the lead engineer during the upgrade cycle. They are responsible for researching changes, upgrading any critical components, determining a course of action for breaking changes, and scheduling all cluster upgrades. A considerable amount of time is dedicated to planning the proposed changes by this engineer. This operator also acts as a liaison between different stakeholders. This involves communicating important dates, interesting findings or feature deprecations. Ops(Lead) coordinates knowledge transfers sessions between the Ops(New) and Ops(Sr) as needed. In the previous cycle this operator participated as Ops(New) and has experience executing the upgrade process on both development and production clusters.
Core Duties
- This operator in the previous cycle was Ops(New), leveraging that experience, Ops(Lead) is expected to have an understanding of the execution tasks.
- Responsible for executing processes on development/pre-production clusters
- Responsible for executing processes on production clusters
- Responsible for core research of version upgrade changes
- Responsible for coordinating associated work between Ops(New) and Ops(Sr)
Operator (Senior): Ops(Sr)
This operator previously participated in the last two upgrade cycles. This engineer serves as a knowledge resource for both Ops(Lead) and Ops(On-boarding).
Core Duties
- This operator in the previous cycle was Ops(Lead), leveraging that experience, the Ops(Snr) serves as a mentor to the Ops(Lead) and Ops(On-boarding).
- Responsible for assisting with executing processes on production clusters.
The Process

Research: The lead operator starts the cycle by investigating changes between the current version and the proposed version we would like to upgrade to. During this phase of work, the lead operator shares findings, road-blockers, and items of interest with the core team. To assist the lead operator several resources were gathered over the course of previous upgrade cycles to help determine what Kubernetes components have changed in the release we plan to run. The lead operator uses these resources to answer the following questions;
- Questions
- Were any APIs graduated/deprecated that we should be concerned about?
- Are there any features enabled by default that we should be concerned about or can leverage in our Kubernetes implementation?
- What components currently running in our cluster will be impacted by the Kubernetes version upgrade ?
- Resources
Critical Components: We deem several components in our clusters as critical to the operations of Kubernetes, each of these components has recommended versions to run on specific Kubernetes versions. Research is done to verify we can run the supported version.
We define these services as critical to our clusters viability
- DNS
- Pod Networking
- Cluster Ingress
- Cluster Autoscaling
Infrastructure Development and Rollout: Once the resource portion is concluded the lead operator generates a series of pull requests to alter the infrastructure which supports our Kubernetes clusters. These pull requests are approved per our internal guidelines.
Rollout:
- Communication: During each rollout, a communication thread is created to provide team members updates on the progress of each process executed during the upgrade. In the event that an issue occurs these communication threads can be used for further investigation.
- Pre-Production: The rollout begins to our pre-production clusters. This gives the lead operator an opportunity to vet the changes and determine a course of action if a component is found in an unhealthy state. The on-boarding engineer is expected to shadow the lead engineer during these pre-production rollouts and is expected to execute the rollout on a pre-production cluster under the supervision of the lead operator.
- Production: Our production clusters are updated over the course of two maintenance periods. Traditionally, changes of this nature are done during a scheduled maintenance window due to the potential impact to our customers if something were to occur. All operators participate in the rollout of our production clusters; monitoring, overseeing and communicating updates as the rollout progresses.Once all nodes are on the new Kubernetes version, each operator performs a series of health checks to ensure each cluster is in a fully functioning state.
In conclusion, our upgrade process consists of identifying changes to critical Kubernetes components, determining their impact to our environment and creating a course of action when breaking changes are identified. Once we’re ready to implement a version upgrade, we trigger an instance refresh to our various node groups, which causes nodes to be cordoned off and gracefully drained of pods prior to termination. The team responsible for managing the upgrade process consists of 3 different roles which are cycled through by each on-boarded engineer. Kubernetes is an important part of our infrastructure, and the process we’ve designed at LogicMonitor allows us to upgrade Kubernetes versions without impacting the uptime of our services.
If you’re working with Kubernetes and the thought of searching for each new term you come across seems exhausting, you’ve come to the right place! This glossary is a comprehensive list of Kubernetes terminology in alphabetical order.
Jump to:
A | C | D | E | F |G | H | I | J | K | L | M | N | O | P | Q | R | S | T | U | V | W
Admission controller – A security feature native to Kubernetes that allows users to configure the objects allowed on a cluster. Admission controllers regulate how each cluster gets used. An admission controller quickly checks each request with the Kubernetes server prior to letting any objects run.
Affinity – A set of rules hinting at the placement of pods. There are two types:
- Node
- Pod-to-pod
Depending on how strict a scheduler must perform, these rules can be either preferred or required.
Aggregation Layer – an aggregation layer lets you extend Kubernetes with other APIs in addition to what’s available in basic Kubernetes APIs. You can use APIs that are tailored and ready-made, like service-catalog, or you can use APIs you’ve developed yourself.
AKS – Azure Kubernetes Service (AKS) is an open-source, fully managed container planning service that debuted in 2018. AKS is offered in the public Microsoft Azure cloud and can be used for deployment, scaling, and management of Docker containers and other containerized apps working in clusters. For all resources, AKS provides as required or on-demand:
- Provisioning
- Scaling
- Upgrading
You’ll see no cluster downtime and you don’t need a deep understanding of container organization to work with AKS.
Amazon EKS (EKS) – Amazon’s Elastic Kubernetes Service, or EKS, lets you run Kubernetes on Amazon Web Service (AWS) without the need for installation, operation, or maintenance of your own control plane/nodes.
Annotation – A value assigned to the metadata of an object.
API group – A group of related paths within the Kubernetes API.
API server – Part of the control plane that reveals the Kubernetes API. The front end of the control plane. This lightweight application allows you to create and extract API data from other data without needing customized development procedures.
Applications – The layer where containerized apps run. Applications are containerized solutions.
cgroup – container group – A group of processes native to Linux that have optional isolation of resources, accounting, and/or limits. A kernel feature limiting, accounting for, or isolating resource use for a specific set of processes. cgroups let you allocate various resources such as:
- System memory
- Bandwidth
- CPU time
- A combination of the above
cgroups also let you allocate these resources amongst any task groups or processes running within the system that have been user-defined. You can also:
- Monitor any cgroups you’ve configured.
- Deny certain resource access to specific cgroups.
- Dynamically reconfigure specific cgroups.
CIDR – Classless Inter-Domain Routing (CIDR) is a mask for IP addresses. Also referred to as supernetting, CIDR assigns IP addresses to improve address distribution efficiency, replacing the earlier system that was based on Class A, B, and C networks.
Cloud-controller manager – A cloud controller is a storage tool that moves data from a physical, on-premises storage location to a cloud location. Cloud controllers use either hard drives, SSDs, or a combination for on-premises storage. The cloud-controller manager is a control plane element that allows you to embed specific control logic into the cloud. This tool is structured with a plugin allowing various cloud service providers to integrate, or link up with, Kubernetes.
Cluster – Kubernetes clusters are sets of node machines that run containerized apps. In other words, if you’re using Kubernetes, you’re using clusters. At the bare minimum, clusters contain the control plane and at least one computing machine, or node. The nodes are responsible for running the apps and workloads.
ConfigMap – A dictionary of your configuration settings. A ConfigMap has strings of key-value pairs. The key-value pairs act as instructions that Kubernetes then provides to your containers. Like other Kubernetes dictionaries, you can see and set the value of the configuration. You can use ConfigMap to keep the application code separate from the configuration. It’s a crucial aspect of 12-factor apps used in creating software-as-a-service applications.
Container – Lightweight, executable image containing software and its dependencies. Containers are software packages that come ready to use. Everything needed to run an app is located in the container, such as:
- The code
- Runtime
- App libraries
- System libraries
- Default values for vital settings
Containerd – Concept of kernel features providing relatively high-level interfaces. Other software can use containerd for running and managing containers and images.
Container environment variables – “Name equals value” pairs that offer insight into the containers that run within a pod. Container environment variables provide application-specific, required information to each container about such resources as:
- System details
- Container information
- Service endpoints
Container network interface (CNI) – a project by the Cloud Native Computing Foundation, a CNI is comprised of libraries and specifications regarding the writing of plugins that configure the network interfaces within Linux containers. In Kubernetes, CNI acts as the interface between a network provider and networking pods.
Container runtime – The software that’s responsible for running the containers. This software executes each container and manages it on a node. Container runtime interface, or CRI, lets Kubernetes use several types of container runtimes without having to recompile. Theoretically, Kubernetes can use any given container runtime that uses CRI to manage its pods, containers, and images.
Container runtime interface (CRI) – A container runtime API that joins with kubelet on a node.
Container storage interface (CSI) – Offers a standardized interface between containers and storage systems, enabling customized storage plugins to cooperate with Kubernetes without the need to add each storage system to the Kubernetes repository.
Control plane – The layer in which container deployment, definition, and management occur. Some of the components of the control plane include etcd, Scheduler, and Controller Manager.
Controller – Loops that oversee the cluster’s state, making and requesting changes as necessary to move the cluster’s current state closer to the cluster’s most desired state. Some controller’s loops may run within the control plane if they are necessary for operations. For instance, the namespace controller runs inside kube-controller-manager.
CRI-O – CRI-O is an operation in Kubernetes’ container runtime interface (CRI) that lets you enable compatible runtimes that use Open Container Initiative, or OCI. If Docker, Moby, and rkt aren’t as lightweight as you need, CRI-O is a good alternative. It lets you use any runtime as the Kubernetes runtime to run pods. It also supports runc and other container runtimes that are OCI-compliant. CRIO sustains any OCI image and it can draw from all container registries as directed.
Custom controller – In some instances, Kubernetes’ core controllers may not provide the necessary control. A custom controller allows the user to extend Kubernetes core functionalities without having to change core code.
CustomResourceDefinition (CRD) – The customized code for a custom controller, used when the Kubernetes core controllers don’t provide the necessary functionality.
DaemonSet – The system’s daemons (log collectors, monitoring agents, etc.) usually must run on each node. A DaemonSet makes sure a Pod copy is functional across a group of nodes within a cluster.
Data plane – The layer that holds such working aspects as the CPU, memory, and storage for the containers to run. The data plane helps containers connect to a specific network.
Deployment – An API resource object providing updates to various applications. The deployment manages pod scheduling, management, updates, rollbacks, horizontal scaling, and lifecycles.
Device plugin – Run on nodes providing pods access to various resources. Specific setups or initializations for vendor-specific applications use device plugins to operate. A device plugin can be deployed as a DaemonSet or installed directly on each necessary node.
Disruption – An event that causes a pod (or multiple pods) to go out of service. This can have negative consequences on deployment and other resources necessary for workloads as it affects the pods required.
Docker – The software technology, Docker, or Docker Engine, provides virtualization at the operating system level in the form of containers.
Dockershim – a legacy term that is allows a Kubelet to communicate with Docker. Dockershim was removed from Kubernetes as of v.1.24.
Dynamic volume provisioning – Using the StorageClass API object, users can automatically provision storage volumes rather than needing pre-provisioned volumes. You can create storage volumes on-demand with dynamic volume provisioning. Without this tool, a cluster administrator must manually call the cloud to create a new storage volume, afterward creating PersistentVolume objects that represent those calls in Kubernetes. Dynamic provisioning eliminates pre-provisioning requirements. It simply provisions storage automatically as requested.
Endpoints – Endpoints are objects to which individual pod IP addresses are assigned. The endpoint’s object is then referenced by Kubernetes so there’s a record of all internal IP addresses for all pods so that communication can occur.
Endpoint slice – Released with Kubernetes Version 1.16. Endpoint slicing lets you group endpoints within the group using Kubernetes resources. The endpoint houses all pods matching a specific service. If there are hundreds of pods within a service and you make any changes, endpoint objects can become large. Prior to the release of endpoint slicing, every change made altered every object, passing that change to all nodes within the cluster, which caused critical performance and stability issues. Endpoint slicing lets you group similar endpoints, therefore no disruptions occur when changing multiple endpoints.
Ephemeral container – A type of container that can be run temporarily within a pod. If a pod shows signs of an issue, running an ephemeral container allows the user to diagnose the problem without affecting the entire workload. An important note is that this type of container has no resource or schedule guarantee and should not be used to run the actual workload.
Etcd – A storage configuration management tool, etcd is crucial to Kubernetes execution. It must always be consistent and available so services are scheduled and operate properly. Etcd data is critical, so having a cluster backup is highly recommended.
Event – a report of an event within a cluster normally showing a chance in a system’s state. Events have a limited retention time and K8s events should be used as supplemental data only.
Extensions – Software elements that “extend”, deeply integrating with the Kubernetes platform in support of new hardware types. Cluster admins can install one or more extensions rather than authoring a brand-new instance.
Finalizer – A key used to inform Kubernetes to wait to delete a specific marked resource until specific conditions are met. Finalizers can be used to clean up resources or infrastructure during the garbage collection process.
Garbage Collection – Garbage collection is used across multiple technologies. For Kubernetes it entails cleaning up resources, including unused containers, pods, completed jobs, and resources that have failed, amongst others.
Google Kubernetes Engine (GKE) – GKE offers a managed environment to deploy, manage, and scale containerized apps using Google’s infrastructure. This environment has several machines, such as Compute Engine that, grouped together, form a cluster.
Helm Chart – Helm Charts are YAML manifests that are combined into one package that can be presented to Kubernetes clusters. After packaging, placing a Helm Chart within your cluster is as simple as executing a helm install. The purpose of a Helm Chart is to simplify the deployment of any containerized apps. Read more about Helm.
Horizontal pod autoscaler – Also known as HPA, a horizontal pod autoscaler automatically scales the number of replica pods. Rather than using CPU power or memory thresholds to control the amount of replicated pods, the autoscaler does so. HPA can also be set for custom thresholds.
Host aliases – If a pod host file is specified, this optional mapping can be input into the host file. It is an optional map between an IP address and a hostname. Host aliases will only work in an non-host network pod.
Image – A stored container instance holding a software set that’s required for an application to run. An image is a packaging method for software allowing it to be stored in the container’s registry, sourced by a local system, and executed as an application. Metadata offers information regarding what to run, who built the application, and other information.
Ingress – This API object exposes both secure and non-secure routes (HTTPS and HTTP, respectively) beginning outside a cluster to the services running inside the cluster. An ingress provides external access to internal services. Types of ingresses include single service and load balancing, among others.
Init container – An initialization, or init container is comparable to a regular container, but an init container must run through to completion prior to another container having the ability to start. An init container must run in sequence with all other init containers before the next container may begin.
Istio – Istio, a service mesh, is a modern networking layer for transparent, language-independent automation applications for network functions. This service mesh sustains microservice communications and allows for data sharing.
Job – A Kubernetes Job object is a basic function or instruction for pod creation and termination. As Jobs are created, a Job controller then creates the pods necessary and makes sure pods are terminated successfully. As each pod terminates, the Job controller tracks the number of successfully completed pod tasks.
Kubeadm – This tool helps you dictate to Kubernetes that kubeadm init and kubeadm join are the best pathways to create Kubernetes clusters. Kubeadm takes care of the necessary actions to get a viable cluster working. Kubeadm was designed to only care about bootstrapping, not machine provisioning.
Kube-controller-manager – A component of the Control Plane running controller processes. To ease complexities, each process is rolled into one binary and run as one.
kube-apiserver – See API server.
kubectl – Command line tool that creates, inspects, updates, and deletes objects by communicating with the Kubernetes API server.
Kube-scheduler – One of the components of the Control Plane responsible for cluster management. Kube-scheduler looks for pods that have yet to be scheduled, assigning them to nodes by certain specifications, such as resource availability. As pods are assigned to nodes, each node’s kubelet gets triggered, creating the pod and its containers.
Kubelet – A mini application running on every node within a cluster. It requires a set of instructions, or PodSpecs, and uses these specifications to ensure each container is working properly. Kubelets execute the actions sent to each container from the master node.
kube-proxy – This is the network proxy for Kubernetes. This service runs on each node, handling request forwarding. kube-proxy’s main role is creating rules for iptables. Pods don’t have the same IP addresses, but with kube-proxy, the user can connect to any specific pod in Kubernetes. This is especially crucial for such actions as loan balancing enablement.
Kubernetes API – The app serving Kubernetes functionality. It operates in a RESTful interface, storing the cluster state. In other words, all Kubernetes resources and intent records get stored as objects and then modified according to RESTful orders to the API. The Kubernetes API lets the user declare management configuration. The user can interact with the API directly or with a tool such as kubectl. The Kubernetes API’s core is flexible and allows for extension into custom resources.
Kubernetes Operations (Kops) – Kops is a fast, easy, open-source method of setting up clusters. Technically, it’s the “kubectl” cluster setup method. Kops lets you deploy available clusters on Amazon Web Service (AWS) and Google clouds (GCP).
Label – Assigns meaningful, relevant identifying attributes to objects. Labels organize objects and select subsets.
Limit range – Assigned within namespace, the limit range allows resource consumption of containers and pods to be constrained, or limited. If only a certain number of object types are needed, limit range limits the number of resources that a container or pod within the namespace can request or consume.
Load Balancing – Load balancing is the process of distributing traffic across multiple servers to prevent specific servers from overloading.
Logging – The recording of events within a cluster or application. System and app logs help the user understand what happens within a cluster. Logs are especially useful in monitoring activity within clusters and debugging problems.
Manifest – A plan for the desired state of a specific object. When the user applies the manifest, Kubernetes maintains that desired object state. Every configuration file can hold several manifests. A manifest in Kubernetes illustrates all resources, you wish to create, such as:
- Deployments
- Services
- Pods
The manifest also lets you dictate how those resources should run within a cluster.
Master node – As the name suggests, this node holds Kubernetes objects in control of the cluster, its data on cluster state, and its configuration. Kubernetes objects in the Master Node include etcd, kube-controller-manager, kube-apiserver, kube-scheduler, and cloud-controller manager.
minikube – Allows users to run Kubernetes locally. A single-node cluster within a virtual memory file on the user’s computer. minikube allows you to run a cluster with just one node on your own PC, whether you’re running, Windows, macOS, or Linux. minikube is perfect for users and developers who simply want to take Kubernetes for a spin or to perform daily developmental work.
Mirror pod – An object used by a kubelet that represents a static pod. If kubelet finds static pods within the configuration, it attempts to create a pod object for it in the Kubernetes API server. The user will be able to see the pod on the API server but will not be able to control it there.
Name – A user-provided string referring to a specific object within a URL. No two objects of the same type can have the same name at the same time. If the user deletes the object, however, a new object using that name can be created.
Namespace – An abstract placeholder name Kubernetes uses to support several virtual clusters atop the same physical cluster. This helps organize cluster objects and lets the user divide that cluster’s resources. Resource names must be unique within a specific namespace in a cluster but can be used in other namespaces.
Network policy – Kubernetes pods have the ability to communicate with other pods and get traffic and information from other sources by default. This Kubernetes resource indicates how groups of pods can communicate with other pods and network endpoints. With the use of labels, pods are chosen and allowable traffic configured.
Node – A worker machine. Nodes can be either virtual or physical, depending on the individual cluster. Nodes have local daemons needed to run the pods. Nodes are managed on the Control Plane. Daemons on nodes include:
- kubelet
- kube-proxy
- Container runtime
Node Pressure Eviction – If a node appears to be failing, node-pressure eviction lets the kubelet terminate pods beforehand so as to reclaim needed node resources. If a workload resource, like StatefulSet, Deployment, or others) manages your pods and checks for pods that need replacing, your control plane (or kube controller manager) will create a new pod for each evicted pod.
Object – A system entity. The entities represent the cluster’s state. Objects are records of intent. Once a user creates an object, the Control Plane ensures the existence of the actual item the object represents. Objects represent to the system what your cluster’s workload should look like or the desired state of the cluster.
Persistent Volume (PV) – A cluster storage resource. Kubernetes doesn’t only manage containers that run an app; it also manages cluster application data. Persistent Volume (PV) abstracts data storage from existing storage infrastructure and can actually outlive the pod itself. Due to this feature, PV can create stateful pods.
Persistent volume claim (PVC) – A request for storage access. PVCs get mounted within a container and specify the storage amount required, how it can be accessed, and how to reclaim the resource.
Pod – The smallest object in Kubernetes representing a set of containers running on a cluster. Typically, a pod runs one primary container, but sidecar containers can also be added for additional features, such as logging. These objects are usually managed by a deployment.
Pod disruption – Pod disruption occurs in one of two ways:
- A user or controller destroys a pod
- There’s been an inevitable hardware, software, or system error
The inevitable, or unavoidable, types of pod disruption are called involuntary disruptions. A few examples of involuntary disruptions include:
- Hardware failure within the actual, physical machine that backs the node.
- A cluster administrator accidentally deletes an instance.
- A failure at the cloud provider occurs.
- A panicked kernel.
- A cluster network partition causes a node to disappear.
- A node runs out of resources and evicts a pod.
Aside from the last example, most users are probably familiar with the other examples. They do not occur only in Kubernetes.
Other disruptions are known as voluntary, and they include actions that can be started by an app’s owner and those started by a cluster admin. Some typical voluntary disruptions include:
- Deleting a deployment or another controller managing the pod.
- Updating the template for a deployment pod, which causes a restart.
- Simply deleting a pod.
Pod disruption budget (PDB) – Lets the user configure how many disruptions a class of pods can tolerate so there is always the correct number available even if a disruption event occurs. When a pod disruption causes a cluster to drop below budget, the operation gets paused till the budget is maintained.
Pod lifecycle – A pod has five distinct phases:
- Pending
- Running
- Succeeded
- Failed
- Unknown
The lifecycle of a pod is the order of these states throughout the pod’s existence.
Pod phase – A high-level summation of the point at which a pod is in its lifecycle. The five potential pod phases defined are:
- Pending: Accepted but waiting for the requisite amount of container images.
- Running: All containers are created, and the pod is attached to a node. One container at minimum is running, working toward starting, or is restarting.
- Succeeded: Each container within the pod has terminated successfully and will not restart.
- Failed: Each container within the pod has terminated, but one or more failed. Exits in non-zero status or system termination.
- Unknown: Pod state cannot be determined. Usually a failure to communicate with the host pod.
Pod priority – In production loads, some pods have a higher level of importance. Pod priority allows a user to give certain pods preference over others with less importance.
Pod preset – An API object that allows the user to put information in pods at the time of creation. Presets are then managed by an Admission Controller. The Admission Controller applies the preset at the time of creation request. Some of the most typical presets include:
- Secrets
- Volumes
- Mounts
- Environmental variables
Pod Security Policy – Pod Security Policies are cluster-level resources controlling sensitive aspects of a pod’s specifications. A PodSecurityPolicy object defines a specific set of conditions that a certain pod must be running for the system to accept it, in addition to defaults for other related fields.
Preemption – Pods are put in a queue after creation. Pod Priority and Preemption are turned on. As the scheduler grabs pods from this queue, it attempts to schedule them to a node within the cluster. If the pod can’t be scheduled, the scheduler uses the preemption logic to temporarily stop low-priority pods and allow the pending pod to be scheduled.
Proxy – The kube-proxy is the network proxy running on every node within a cluster that implements a piece of the Kubernetes Service model. Kube-proxy supports the network rules within each node. Network rules let the network communicate with your pods, whether the network session is in your cluster or not.
Quality of Service (QoS) Class – A concept that helps Kubernetes determine pod priority in terms of scheduling or eviction. These classes are assigned at the time of pod creation and determined by their resource requests and limitations. The three Quality of Service classes that can be assigned are:
- Guaranteed
- Burstable
- BestEffort
RBAC – Through Kubernetes API, RBAC manages authorization decisions. This allows users at the admin level to configure dynamic access policies by role. Roles contain permission rules. Role bindings grant each defined permission to a specific set of users.
ReplicaSet – A core Kubernetes controller that is used to ensure that the right amount of replicas are running.
ReplicationController – Controls the number of exact pod copies that should be allowed to run in a cluster. After the admin defines the number of replicas allowed, the Control Plane maintains cluster compliance even if pods fail, get deleted, or if too many started at deployment.
Resource quotas – Places a limitation on how many objects can be created, by type, within a namespace. Also ensures that the amount of computing resources allowed within a project is not exceeded.
Secrets – Security account credentials. Secrets are objects containing small packets of sensitive data. As the name suggests, Secrets in Kubernetes is a tool that allows you to store and manage information of a sensitive nature, such as:
- Login information
- OAuth tokens
- SSH keys
In the absence of Secrets, this sensitive data might be placed in a pod spec or image.
Security Context – A pod or container’s security context outlines the privileges and access controls. Discretionary Access Control restricts access permissions to certain objects, such as files, and is based on a user’s ID and/or group ID. Security context can be set to run as either with or without privileges.
Selector – Lets users filter lists of resources by labels. A selector in Kubernetes lets you choose resources based on their label values and assigned resource fields. Think of it like the filter you apply when using Excel spreadsheets. Selector lets you filter just the details you want to see of objects with similar labels.
Service – A conceptual method of exposing applications running on pod sets as a network service. Pod sets targeted by services are (normally) chosen by a selector. If the user adds or removes pods, the pod set that matches the selector changes. The service ensures that the network traffic gets directed to the right pod set.
Service Account – Gives an identity to processes running within a pod. Pod processes accessing the cluster are validated by the server as a specific service account, such as “default”. When a user creates a pod, if a particular service account is not specified, it automatically gets assigned as “default” within that namespace.
Service Catalog – This API extension allows apps that run on Kubernetes clusters to use externally managed software, such as datastore services provided by cloud providers. Service Catalog helps users with listing, provisioning, and binding to externally managed services without having to understand how each specific service is managed or was created.
Shuffle sharding – A technique to assign queue requests. Shuffle sharding is a nimble technique that does a better job isolating low-intensity flows from high-intensity flows than hashing the number of queues.
Sidecar container – A support extension for a main container. A sidecar container can be paired with as many main containers as necessary, enhancing the capabilities of the main containers. For instance, a sidecar container is a good addition to a main container to assist in processing or monitoring system logs.
Stateful – A process that saves data and tracks historical sessions and transactions.
StatefulSet – A Kubernetes controller that manages deployment and scaling for a pod set. Pods managed by this controller are provided unique identities. This identity is used if pods need to be rescheduled.
Stateless – A process that does NOT save data or track historical sessions and transactions.
Static pod – Similar to regular pods, static pods are managed on a node directly by kubelet, instead of on the server. The kube-scheduler ignores static pods, meaning they won’t be terminated or evicted if the node fails.
StorageClass – A way for admins to describe various options available for storage. Important fields in StorageClass specs are:
- Provisioner
- Parameters
- ReclaimPolicy
- VolumeBindingMode
If a Persistent Volume needs dynamic provisioning, these StorageClass terms can be used.
Systcl – A way for admins to modify or change kernel attributes or settings. sysctl, short for ‘system control’, is a utility in some operating systems that can read and/or modify system kernel attributes, such as:
- Version number
- Max limits
- Security settings
In compiled programs, it’s available as both a system call and administrator command. Sysctl can be used interactively or for scripting.
Taint – Core Kubernetes object. Consists of three necessary properties:
- Key
- Value
- Effect
Taint prevents pods from getting scheduled on nodes or on node groups. Specifically useful when nodes with special hardware are reserved, are not licensed for software already running within the cluster, and other reasons. Taints alert the scheduler that these nodes aren’t available for scheduling. Taints and Tolerations work together for better control over pod-to-node scheduling.
Toleration – Core Kubernetes object. Consists of three necessary properties:
- Key
- Value
- Effect
Opposite of Taints, Tolerations allow pod scheduling on nodes or on node groups. Tolerations allow pods to ignore Taints and are housed within PodSpec.
UID – A string generated by the Kubernetes system for object identification. A unique identifier.
Vertical Pod Autoscaler – This tool adjusts the CPU and memory reserves of your pods so that each application is exactly the right size. These adjustments help clusters use resources more appropriately and also frees up CPU processing and memory for your other pods.
Volume – A data directory. The volume can be accessed by containers within a pod. Volumes have a lifespan as long as its pod. As a result, volumes outlive containers running in the pod, and the data is preserved throughout container restarts.
Worker node – A Kubernetes node. See node. Kubernetes clusters consist of a worker machine set, also known as nodes. These nodes run the containerized apps. There’s at least one worker node in every cluster. Worker nodes contain the application’s workload pods. The mods and worker nodes in each cluster are managed by the control plane.
Workload – An app that runs on Kubernetes is a workload. It doesn’t matter whether the workload is just one or many components working together. Kubernetes runs the workload within a pod set. A pod is the set of containers running within the cluster. All your clusters represent the workload.
Last updated August 29, 2022
Container technology is changing the way we think about developing and running applications. Containers are lightweight packages of software that include everything it needs to run an application. This includes operating system components as well as libraries and other dependencies. Emerging technologies such as Docker and Kubernetes empowers organizations to deliver quality software with speed and ease.
Contents
- What Is Containerization?
- What Is Docker?
- How Does Docker Work?
- Docker Architecture
- Docker Advantages
- What Is Kubernetes?
- How Does Kubernetes Work?
- Kubernetes Architecture
- Kubernetes Advantages
- Can You Use Docker Without K8s?
- Can You Run K8s Without Docker?
- Benefits of Using Both Docker and K8s Together
- Kubernetes vs. Docker Swarm
What Is Containerization?
Containerization is a way to package an application with its dependencies to deliver the entire stack as one unit. Containerization enables developers to deploy their code in any environment without worrying about incompatibilities. It also eliminates dealing with configuration issues such as setting up shared libraries and paths which could take hours or days using traditional methods.
Containers are easy to manage. They can be started, stopped, moved from one machine to another and scaled up or down, all with very little effort. Containers can also provide a level of isolation. They don’t need their own dedicated hardware resources. This allows for resources to be shared among containers, which improves performance and efficiency.
Why is Containerization popular?
Container technology is becoming popular because it simplifies application deployment and scaling. In the past, developers would need to write scripts to deploy software. Containers make this much easier by packaging an application with all of its dependencies into a standard unit that can then be deployed anywhere on a computer system.
In addition, containers are more lightweight than virtual machines. This means that they take up less space and use less processing power when compared to a traditional server environment. The bottom line: containers offer many benefits for both businesses and developers alike. Enterprises can utilize them to improve IT system performance. Developers can take advantage of containers’ portability to make development easier and faster.
What Is Docker?
Docker is an open-source platform that allows developers to package an application with all of its dependencies into a standardized container for software development. Docker containers are designed to be lightweight, portable, and self-sufficient. They allow you to package up an application with everything it needs, so it will run regardless of the environment it is running in.
Containers are not new; they have been around for decades in the form of chroot on UNIX systems and virtual machines on Windows systems. However, Docker has made containers more accessible by providing a simple way to create them and manage them using standard Linux tools such as cp, tar, and rm. Docker also provides an easy way to share containers with others via public or private registries.
Containers are similar to virtual machines (VMs), but they run on top of the host operating system instead of inside another operating system. This means that they don’t have their own kernel or require special drivers to be installed. This makes them much lighter than VMs. They also have a standard format that allows them to run on any Linux system, regardless of the underlying architecture.
How Does Docker Work?
Docker containers are the runtime that gets created based on a Docker Image. An image is a file that contains all of the information needed to run an application. The image is then used to create a container.
Dockerfiles are a set of instructions for creating an image. They provide all the steps necessary to assemble a container from an intermediate base image. You can think of Dockerfile as your project’s recipe—with carefully chosen ingredients and detailed step-by-step instructions. The Dockerfile consists of three parts:
- A list of commands will be executed to build the container (image).
- A list of environment variables that will be set when running the container (image).
- A list of files and directories that will be copied into the container (image).
An image has several layers. The topmost layer is the rootfs, which contains the filesystem. The next layer is the kernel, which contains all of the operating system’s core components. The third layer is the application, which contains all of your application’s code and dependencies.
Docker images are immutable—once created, they cannot be changed. This means that you can create a new image from an existing image and it will always have the same contents as before. This makes it easy to create a new image from an existing one and reuse it in future projects without having to rebuild it.
Docker Architecture
Docker Engine allows you to develop, assemble, ship, and run applications using the following components:
Docker Daemon
The Docker daemon is a process that works in the background. It manages your containers, does image management, and builds new images for you with one command. It takes care of container naming conflicts by placing them on different hosts, etc. Daemons are run as part of the Docker Engine cluster life cycle—they start when the engine starts up or when it detects its node has been replaced.
Docker Client
The Docker client interacts with the Docker daemon. It creates images, interacts with and manages containers.
Docker Compose
Compose defines and runs multi-container Docker applications. With Compose, you use a YAML file to configure your application’s services. Then, using a single command, you create and start all the services from the configuration file.
Compose works across different operating systems (Linux versions are supported) by reading the same YAML configuration file. As long as all of the containers in an application can communicate with each other over localhost or another host/port specified in the config then docker-compose will work.
Docker Machine
The Docker Machine tool allows you to create virtual machines (VMs) that run on top of the Linux kernel provided by the operating system vendor (e.g., Red Hat Enterprise Linux). This allows you to create VMs that are based on other operating systems such as Windows Server or Ubuntu without having to install them yourself or use third-party tools.
Docker Engine REST API
The Docker Engine REST API provides endpoints for external systems to interact with containers. The goal is to facilitate communication between these systems and containers using standard protocols like JSON over HTTPS.
Docker Command Line Interface
Docker CLI is a command-line interface that can be used to control and manage Docker. It enables you to deploy your applications as containers, using the docker build, docker commit or other commands.
Docker Advantages
One of the most important benefits of Docker containers is that they are highly portable. They can run any computer or server. This is because Docker containers run as processes in the Linux kernel. This means no extra installation process for each machine is needed.
Containers also ensure that code related to different apps is isolated from one. So if there’s a vulnerability in your application it won’t affect other apps on the same server. Lastly, Docker has built-in security features such as mandatory access control (MAC), seccomp profiles, and user namespaces.
What Is Kubernetes?
Kubernetes is an open-source container orchestration system. Container orchestration is a process in which the system automatically manages different containerized applications and their respective resources, ensuring that they do not conflict or overlap with other running processes.
How Does Kubernetes Work?
Kubernetes performs CPU allocation, memory limits, storage space allocations, etc. to each container. It schedules containers across nodes in the cluster, keeps track of them, and makes sure that they are running properly. It also provides mechanisms for communicating with other clusters or external systems such as databases.
Kubernetes Architecture
Kubernetes contains two main components: a Master node and a Worker Node. Below are the main components of the master node:
etcd Cluster
The etcd cluster is a distributed key-value store that provides a reliable way to store configuration data and other states.
Kubelet
The Kubelet is the primary node agent for cluster management. It watches containers to make sure they are running and healthy restarts them if necessary and ensures that any containerized application can connect with other components of your system (like storage or another instance of itself) as needed.
Kubelet-proxy
The Kubernetes proxy runs on each Node in a cluster—it maintains connections between Pods (containers), Services, external endpoints like Docker Hub repositories or microservices architectures outside the cluster. It load balances traffic across those connections; provides health checks on all services.
Kube-controller-manager
The kube-controller-manager runs as a background process on each node in the cluster. It communicates with other controllers to achieve the desired state from the system. It also provides an API that may be used in third-party applications or external components, such as kubelets.
Kubelet-scheduler
The scheduler runs on each node and manages pods, scheduling pods to run on nodes and monitoring pod status.
Below are the main components found on a (worker) node:
kubelet
A Kubernetes container runtime that handles the containers on a node. It is responsible for providing all of the functionality required to manage your pods and services, including (but not limited to) pulling images, starting containers when necessary to scale up or down with demand, maintaining application health(such as by restarting crashed instances), attaching storage volumes from provisioners such as Docker Volumes API or Cattle Volume Driver), exposing IP addresses via Services (if configured)
Kube-proxy
Kube-proxy is a node agent that runs on each machine to provide an interface for Kubernetes services. Kube-proxy accepts connections from kubectl proxy and handles all the proxying of TCP traffic between the cluster, upstreams (such as Docker or OpenShift), and clients.
Kubelet
Kubelet is the agent that runs on each node in a Kubernetes cluster. It talks to various components of the system, keeps track of which containers are running where, and does all local setup for containers. The kubelet assigns IPs to new pods or services as they are created.
Kubernetes Advantages
Kubernetes handles much of the complexities of managing containers. This simplifies maintenance and frees developers to work on more value-added tasks. Additional benefits include:
Increased Performance: Kubernetes scales horizontally, so the more nodes you add to your cluster, the better!
Standardized Configuration Management: With kubectl run commands and templates for Dockerfile options like ports and volumes. It’s easy to deploy new clusters with a consistent configuration.
Improved Security and Stability Through Larger Resource Pools: The larger resource pools of CPUs/memory per pod give containers access to all available system resources without any contention or interference from other pods on the same node. This improves both stability as well as security by limiting exposure points in an environment where multiple services are running on a single node. If one service gets compromised it doesn’t automatically lead to compromise of another service.
Single Cluster Domain Controller For Administering Services And Applications Across All Clusters In Your Organization: A universal control plane ensures everyone has visibility into what’s happening across their entire infrastructure no matter who manages them or how they manage them. Everything is logged centrally which makes administration simpler.
Can You Use Docker Without K8s?
Docker can be used without Kubernetes. In this scenario, Docker swarm performs orchestration. Swarm is Docker’s native clustering system. Docker Swarm turns a pool of Docker engines into a single logical unit, making it simple to scale applications across multiple hosts and automatically heal itself from node failures.
Docker swarm works by orchestrating a cluster of Docker Engines to behave like one large, virtual single host. These engines communicate with each other using SwarmKit. It creates a cluster that can allocate tasks or workload dynamically among the individual nodes in the swarm depending on resource availability.
Benefits of Docker Swarm
Outside of being Docker-native, Swarm comes with a host of benefits. The additional benefits include:
Speed: You can spin up containers faster due to their lightweight nature
Size: The size of a swarm is only limited by your storage capacity meaning you get higher availability
Extendable: When you use docker swarm mode, it supports single-node swarms which makes it easier for developers or companies who want to test new ideas without compromising their production environment
Scaling: Container clusters scale automatically when nodes are added or removed from them automagically based on the need
Customizable: Swarm allows developers/companies full control over what they deploy where they deploy it making deployment pipelines smoother.
Easy To Use: Docker swarm is easy to use and deploy. It’s a simple command-line tool that you can run on your laptop or server.
Easy to Manage: You can easily manage your containers with docker swarm. You can create, join and leave a swarm without any downtime
Easy to Scale: Docker swarm scales automatically based on the number of nodes in the cluster. This means you don’t have to worry about scaling up or down your cluster when you need more or fewer resources
Easy To Secure: Docker Swarm has built-in security features that allow you to control access and permissions for each container in the cluster
Easy to Monitor: You can easily monitor your containers with the docker stats command which gives you information about each container in the cluster including CPU usage, memory usage, network traffic, etc.
Can You Run K8s Without Docker?
Kubernetes can not function without a container runtime. Docker is one of the various platforms used for containerization, but it’s not the only platform. You don’t need to use Docker exclusively; any other compatible option will work.
Benefits of Using Both Docker and K8s Together
Kubernetes is a container orchestration system for managing docker containers. Docker has been designed to provide an additional layer of control and management over the container lifecycle, however, Kubernetes provides that functionality in a way that’s more suited to large-scale deployments or to scale-out applications with high availability requirements.
Kubernetes vs. Docker Swarm
Docker Swarm is the native clustering solution for Docker. It provides built-in load balancing, high availability through an integrated management layer that includes support from major cloud providers such as AWS CloudFormation templates and Google GKE integration. Swarm also integrates with Puppet. Kubernetes is a complete system that automates control of containerized application programming interface (API) deployments into clusters of Linux containers running both within a single data center or between multiple data centers across geographies.
Kubernetes and Docker are robust technologies that simplify application deployment. Packaging applications into “containers” makes for more secure, scalable, and resilient systems. Using them together empowers teams to deliver applications with less maintenance overhead so they can focus on more important tasks.
As more and more IT organizations move towards containerized workloads and services, it is more important than ever to have insight into the containers and the services running within. Leading the container orchestration charge is Kubernetes (aka k8s – the 8 represents the letters omitted from the middle of the word). In fact, about two-thirds of IT engineers have seen their Kubernetes option increase during the pandemic as there becomes more need for scaling and performance. With great power comes great responsibility, so what can be used to help out? In this blog we’ll recap LogicMonitor’s Kubernetes Monitoring solution and go into detail on how to configure LM Logs to view Kubernetes Logs, Kubernetes Events, and Pods Logs to provide a holistic view into K8s, correlating both metrics and logs.
Kubernetes Monitoring
LogicMonitor’s Kubernetes Monitoring integration relies on an application that can be installed via Helm. It runs as one pod in your cluster, which means there’s no need to install an agent on every node. This application listens to the Kubernetes event stream and uses LogicMonitor’s API to ensure that your monitoring is always up to date, even as the resources within the cluster change. Data is automatically collected for Kubernetes nodes, pods, containers, services, and master components (e.g. scheduler, api-server, controller-manager).
Pre-configured alert thresholds provide meaningful alerts out of the box. Applications are automatically detected and monitored based on best practices, using LogicMonitor’s extensive library of monitoring templates. This means that you’ll get instant visibility into your containerized applications without the hassle of editing configuration files, having to rely on matching container image names, or manually configuring monitoring. Additionally, LogicMonitor retains this granular performance data for up to two years. Combined, these benefits enable LogicMonitor to monitor your Kubernetes clusters with fewer required tools and processes than alternative solutions. Check out LM’s Kubernetes Best Practices blog for more info.
What Can Logs Do For You?
Now that we’ve seen how LogicMonitor helps monitor Kubernetes, let’s look at gaining even more insight into what’s going on with Kubernetes logs! With LM Logs, you can ingest both Kubernetes logs and Kubernetes events and Pods logs to capture everything from the K8s logs themselves to pod events like pod creation and removal. The two Kubernetes log types have different collection methods but both are simple to configure and get up and running in a few minutes.
Ingesting Kubernetes Logs
For Kubernetes logs, we recommend using the lm-logs Helm chart configuration (which is provided as part of the Kubernetes integration). You can install and configure the LogicMonitor Kubernetes integration to forward your Kubernetes logs to the LM Logs ingestion API.
To get started, you will need a LogicMonitor API Token to authenticate all requests to the log ingestion API. Also, be sure to have a LogicMonitor Collector installed and monitoring your Kubernetes Cluster.
Deployment
- Add the LogicMonitor Helm repository:
helm repo add logicmonitor
https://logicmonitor.github.io/k8s-helm-chartsIf you already have the LogicMonitor Helm repository, you should update it to get the latest charts:
helm repo update- Install the lm-logs chart, filling in the required values:
helm install -n <namespace> \
--set lm_company_name="<lm_company_name>" \
--set lm_access_id="<lm_access_id>" \
--set lm_access_key="<lm_access_key>" \
lm-logs logicmonitor/lm-logs
Collecting and Forwarding Kubernetes Events
You can configure the LogicMonitor Collector to receive and forward Kubernetes Cluster events and Pod logs from a monitored Kubernetes cluster or cluster group.
To get started, you will need LM EA Collector 30.100 or later installed, LogicMonitor’s Kubernetes Monitoring deployed, and access to the resources (events or pods) to collect logs from.
Enable Events and Logs Collection
There are two options for enabling events and logs collection:
- Modify the Helm deployment for Argus to enable events collection (the recommended method).
helm upgrade --reuse-values \
   --set device_group_props.cluster.name="lmlogs.k8sevent.enable" \
   --set device_group_props.cluster.value="true" \
   --set device_group_props.pods.name="lmlogs.k8spodlog.enable" \
   --set device_group_props.pods.value="true" \
argus logicmonitor/argus- Manually add the following properties to the monitored Kubernetes cluster group (or individual resources) in LogicMonitor.
| Property | Description |
|---|---|
| lmlogs.k8sevent.enable=true | Sends events from pods, deployments, services, nodes, and so on to LM Logs. When false, ignores events. |
| lmlogs.k8spodlog.enable=true | Sends pod logs to LM Logs. When false, ignores logs from pods. |
Filtering Out Logs
With Kubernetes Events and Pod logs being ingested in LM Logs, you may want to filter on various criteria. To configure filter criteria, open and edit the agent.conf file. Find the criteria you want to filter and uncomment the line to enable and then edit the filtering entries.
Kubernetes Events are based on the fields: message, reason, and type.
- To filter out INFO level pod logs to LogicMonitor, uncomment or add the line: logsource.k8spodlog.filter.1.message.notcontain=INFO
For Kubernetes pod logs, you can filter on the message fields. Filtering criteria can be defined using keywords, a regular expression pattern, specific values of fields, and so on.
- To send Kubernetes events of type=Normal, comment out the line: logsource.k8sevent.filter.1.type.notequal=Normal
Lumber Bob’s Wrap Up

Once Kubernetes Monitoring and Logging is configured, you will have a full view of your Kubernetes clusters with both metrics and logs. LM’s out-of-the-box Kubernetes dashboards and visualizations will provide visibility into cluster health and the logs will be associated with each resource. Simply click on “View Logs” in the widget option to be brought to the LM Logs page with the filters and time range carried over to continue viewing the data in context.
But what about alerts? Every LM Alert is enhanced with LM Log’s Anomaly Detection to help surface potentially problematic logs to reduce troubleshooting time. Next time you receive a Kubernetes alert, don’t you wish you had a small subset of logs to review to help narrow down the root cause? LM Logs does all that and will provide you with more insight and visibility into increasingly complex architectures.
Kubernetes pods are the smallest deployable units in the Kubernetes platform. Each pod signals a single running process within the system and functions from a node or worker machine within Kubernetes, which may take on a virtual or physical form.
Occasionally, Kubernetes pod disruptions may occur within a system, either from voluntary or involuntary causes. Kubernetes pod disruptions are more likely to occur in highly available applications and prove to be a concern for cluster administrators who perform automated cluster actions.
Essentially, pods will remain in Kubernetes unless a user or controller removes them or there is a faulty system process. System administrators may apply Kubernetes pod disruption budgets (PDBs) to ensure that systems run undisrupted by creating an allowance/buffer for simultaneous pod disruptions.
Contents
- What is Kubernetes Pod Disruption?
- What is Pod Disruption Budget (PDB)?
- What’s the Difference Between a Voluntary and Involuntary Disruption?
- How to Specify a Disruption Budget
- Assessing Pod Disruption Status
- How to Avoid Outages Using Pod Disruption Budget (PDB)
- Other Useful Details in Kubernetes PDB
- Summary
What is Kubernetes Pod Disruption?
Every pod in the Kubernetes system follows a defined life cycle across phases such as pending, running, succeeded, or failed. Within a Kubernetes API, each pod features a specification and active status determined by a set of conditions. Kubernetes enables users to schedule pods to nodes only once, from which they will run until it stops or gets terminated.
In some system scenarios, Kubernetes nodes may experience a lack of RAM or disk space, which forces the system (i.e., controller) to disrupt pods (i.e., their life cycles) to keep the nodes running. Cluster administrators/controllers may deliberately disrupt the pods (voluntary), or disruption may occur from a software or hardware error.
What is Pod Disruption Budget (PDB)?
PDB is a solution to Kubernetes pod disruption managed across various controllers such as ReplicaSet, StatefulSet, ReplicationController, and Deployment. PDBs prevent server downtime/outages by shutting down too many pods at a given period.
In practical terms, a PDB maintains the minimum amount of pods required to support an SLA (service-level agreement) without incurring losses. Kubernetes users may also define PDB as a platform object that defines the minimum number of available replicas required to keep the cluster functioning stably during a voluntary eviction.
PDBs are used by clusterautoscaler to determine how to drain a node during scale down operation. It controls the pace of pod eviction during node upgrades. For example, for a service with four pods and a minAvailable setting of three, the ReplicaSet controller will evict one pod and wait for it to be replaced with a new one before evicting another pod.
To set a pod disruption budget for a service running NGINX, use the following command:
kubectl create poddisruptionbudget my-pdb –selector=app=nginx –min-available=80%
In the example above, the PDB sets the requirement that 80% of nginx pods must stay healthy at all times. When users call for a pod eviction, the cluster will enable the graceful process only if it fulfills the PDB requirement.
Before starting with a PDB, users should visit a few considerations.
Firstly, users should establish the type of application protected by the PDB. The process proceeds with examining how applications respond to pod disruptions. Users will then need to create YAML files of PDB definitions and create the PDB object from those files.
However, users must note that PDBs only apply to voluntary disruptions under deliberate admin/user commands. Therefore, PDBs will not work with fleets of involuntarily disrupted applications/pods.
If users attempt to disrupt more pods than the stipulated value voluntarily, they will encounter an error code 429 message that prevents pod eviction due to a violation of the PDB value.
What’s the Difference Between a Voluntary and Involuntary Disruption?
There are mainly two types of Kubernetes Pod Disruptions: voluntary disruptions caused by the deliberate actions of controllers and users and unavoidable involuntary disruptions resulting from hardware or software faults.
Some common examples of involuntary disruptions include the hardware failure of physical machines, nodes disappearing due to node network partitions, and kernel panics. Examples of voluntary pod disruptions include cluster administrator actions such as draining nodes to scale clusters or removing a pod from a node in line with system updates and maintenance.
It is important to remember that PDBs only apply to voluntary pod disruptions/evictions, where users and administrators temporarily evict pods for specific cluster actions. Users may apply other solutions for involuntary pod disruptions, such as replicating applications and spreading them across zones.
Pod disruptions may occur in the form of node-pressure eviction, where controllers proactively delete pods to reclaim resources on nodes, which avoids starving the system. In such cases, the kubelet ignores your PDB. Alternatively, an API-initiated eviction respects a user’s preconfigured PDB and terminalgraceperiodseconds (i.e., the time permissible for a graceful deletion of pods).
The graceful shutdown of pods, which has a default time frame of 30 seconds, is essential for Kubernetes cluster management, preventing potential workload disruptions and facilitating proper clean-up procedures. From a business/organizational perspective, a graceful termination of pods enables faster system recovery with minimal impact on the end-user experience.
Therefore, PDB is not a foolproof solution for all instances of unavailability but rather an object specifically for API-initiated evictions.
How to Specify a Disruption Budget
PDBs comprise three fields: .spec.selector, .spec.minAvailable, and .spec.maxAvailable. Essentially, .spec.selector serves as the label for the selected set of pods within the system.
With a PDB in place, users/admins can set the minimum or maximum quantity of replicas and control pod disruption with the .spec.minAvailable and .spec.maxAvailable fields. .spec.minAvailable determines the number of active pods required at all times while .spec.maxAvailable states the maximum amount of disrupted pods allowed.
Cluster administrators/controllers may only choose one between .spec.maxAvailable and .spec.minAvailable fields for each PDB. Setting a 0 value for .spec.maxAvailable or 100% .spec.minAvailable means that users forbid pod evictions.
Additionally, there are some factors to consider before specifying a Kubernetes PDB. Users/administrators should have a Kubernetes system running higher than or equal to v1.21; if not, it is necessary to upgrade the program to fulfill the required compatibilities.
Additionally, users who apply PDB should be owners of applications running on Kubernetes clusters that require high availability, such as quorum-based applications. It is also essential to affirm that service providers or cluster owners (if the user requires permission) agree to budget usage before beginning.
Understand Application Reactions
Various application types display different responses to the pod disruption process. Therefore, users should always consider PDB implementation based on the type of Kubernetes application they handle. By assessing application reactions, users can optimize PDB functions and avoid extra processes in some scenarios.
For example, in restartable jobs where users need to complete the jobs, the respective job controller will create replacement pods without PDBs. Similarly, for single-instance stateful applications that require permission, users may choose to tolerate downtime without applying PDBs or Set PDB with maxUnavailable=0, prepare for downtime/update, and delete the PDB, since users may recreate it later if necessary.
Rounding Logic
Users may express the required value of their PDBs with integers or in percentage form. Specifically, eight for minAvailable states that there should be a minimum of eight active pods at all times, while 50% minAvailable means that at least half of the total pods should always remain active.
Kubernetes rounds up pod values. For example, in the cluster scenario with a total of nine pods and 50% minAvailable, the PDB will ensure that at least five pods stay online at all times.
Assessing Pod Disruption Status
Kubernetes users should regularly check on the PDB status for a better understanding of system performance and to keep systems online. Some important factors include the current number of healthy pods, the minimum number of desired healthy pods (i.e., .spec.maxAvailable value), and the acceptable reasons for disruption (e.g., SufficientPods – where the cluster has the minimum number of healthy pods to proceed with the disruption).
How to Avoid Outages Using Poddisruption Budget (PDB)
The first step to creating a PDB involves creating a Poddisruptionbudget resource, which matches targeted pods. These resources will help drive the Kubernetes system toward timing pod drain requests to achieve nondisruptive eviction.
With a PDB in place at the start of a draining process, users can determine selectors and the state of all associated pods. By doing so, users can effectively drain nodes (i.e., during system updates) while maintaining the minimum number of active pods to avoid a negative impact. As such, PDBs can reduce or eliminate system outages to maintain cluster performance.
Other Useful Details in Kubernetes PDB
Kubernetes 1.21 brings a score of updates and changes to the platform, including the PDB APIs. Notably, an empty selector once matched zero pods by default, but with the recent patch, it matches every pod within a given namespace.
At times, users may experience various PDB configuration complications during a node upgrade or cluster action. Therefore, it is crucial to identify some common scenarios to facilitate a quick response and minimal downtime.
Here are some potential PDB issues:
Caution When Using Horizontal Pod Autoscalers
Horizontal pod autoscalers enable users to scale Kubernetes resources according to system loads based on an entered metric. However, a poorly configured PDB may lead to a mismatch of values, which calculates the existing pods, without considering the shifting values of an autoscaler.
For best practices using a pod scaler with PDB, users should define the PDB for applications or system pods that may block a scale-down. Alternatively, users may use pause pods that provide systems with the boost required to handle additional requests during a spike in server activity.
Additionally, some users may not realize that their clusters run PDBs (since they may come packaged in Kubernetes software extensions such as Operator). Therefore, users must pay close attention to PDB configurations and the possible complications and issues that may stem from platform actions such as node upgrades.
PDB With a Single Replica
Users who apply PDB in deployments with a single pod will cause kubectl drain to remain stuck. In such scenarios, users need to manage pod drains and updates manually. Hence, users should always perform PDB on deployments with more than one replica, necessary for a high-accessibility Kubernetes system.
Indefinite Deadlocks With Multiple PDBs
Multiple PDBs may result in confusion (i.e., overlapping selectors) within the cluster, causes draining processes to hang indefinitely. Therefore, for best practices, users should apply meaningful selector names linked to each set of pods along with a matchLabel that fits the controller selector.
Summary
Kubernetes remains one of the most widely used workload management platforms worldwide due to its highly intuitive functions, such as PDBs. PDBs give users greater control over their API-eviction processes, minimizing the risks of workload disruption and outages. However, users need to note that PDBs have their share of limitations and should only apply them according to specific Kubernetes scenarios.
PDBs are suitable for:
- Voluntary pod disruptions (i.e., cluster administrator actions such as running routine maintenance).
- High-accessibility deployments.
PDBs are unsuitable for:
- Involuntary pod disruptions (i.e., large-scale hardware or software errors).
- Node-pressure evictions.
- Deployments involving a single replica.
By creating a PDB for each application, users can maintain highly available applications despite frequent instances of voluntary pod disruptions (e.g., software extensions).
While the Kubernetes scheduler can help users allocate pods to nodes based on available resources, complexities may arise when there is a need to drain or remove excess nodes during system rescheduling while some pods continue to run (leading to potential downtime). With PDB resources in place, users can keep k8 applications functional to accept incoming requests with minimal delay.
The pandemic has created a unique set of circumstances that have accelerated what was already a growing trend. The shift from brick and mortar retail to a hybrid online and in-person retail experience has meant that nearly every retailer must also be an e-tailer and deliver a flawless digital shopping experience for its customers.
The rise of omnipotent global retail brands like Amazon who have defined the shopping experience but also set unrealistic expectations of how goods can be fulfilled has set the bar very high for other retailers. A digital business relies on smooth and responsive technology. A slow response from a site or an app can directly lead to lost customers. Outages of your website or your fulfillment systems can lead to lost sales and delays which impact your reputation.
Thankfully, technology is keeping pace with the expectations of the consumers with the reliance on things like Kubernetes to allow for agile development of systems and chatbots to handle costly first-line customer support. In this blog post, I will explore some of the challenges in the retail space and the trends in IT which are helping to address the challenges for retailers in this increasingly digital-first industry segment.
Trends in Retail Technology
Digital-First: Further Pivoting to E-commerce, Accelerated by COVID
COVID has accelerated what was an already significant trend as shoppers were unable to visit shops in 2020. Retailers must be increasingly innovative to keep customers in a very competitive marketplace dominated by Amazon and larger retailers. Having a strong online presence and mobile application will be fundamental to the success of the modern retailer.
AI-Driven Operations and Inventory Management
Just in time is no longer enough. Using AI to predict trends is becoming popular. Being able to predict seasonality or the latest fad is key to maintaining adequate stock levels. Using historical data to predict trends is the starting point but also learning from other trends to predict demand for new products or services is more challenging. Customer experience is already being dominated by the chatbot. Businesses will try to further leverage AI in all areas of business management from product design to marketing copy.
Additional Digital Services To Improve Customer Experience; Mobile Applications, Shared Marketplaces, and Payment Services
The world is now mobile and the vast majority of research and increasingly purchase decisions happen through a mobile device. Retailers have had to adapt already but are increasingly having to find new ways to engage customers. User experience is everything. Slow or buggy applications or online services could cost a retailer a customer. Finding better or novel ways for customers to check out, search your catalog, and be inspired by what other people are looking for will enhance the user experience and help retain customers. To compete with global corporations like Amazon, businesses are collaborating to provide their goods on shared marketplaces, improving customer experience and choice.
Net Zero Retail: Decarbonizing the Entire Supply Chain
Understanding the carbon footprint of scope three emissions (third-party) in a complex supply chain can be challenging. However, indirect emissions are still important to consider. Identifying energy efficiency opportunities is especially important for larger organizations that have a public mandate to be responsible for the way their corporation behaves. Retailers and e-tailers are focused on building a low carbon strategy and supplier engagement. Measuring your footprint is the first step. If you can measure it, you can make changes to lower your carbon emissions
Common Challenges Faced by Retail Organizations
How Do You Maintain Customer Experience in a Mobile World?
There is a myriad of different factors affecting a customer’s experience and their engagement with your online brand (website/app load/response times, checkout process, navigation and search, customer reviews, social media). Slight changes to load time or checkout experience can lose fickle customers quickly. The technology stack to deliver websites, applications, and in-store IT is pretty diverse and distributed. Continuous integration and continuous delivery (CI/CD) is a feature of a modern online business as companies test new features and functionality. Being able to add features, test spontaneously and then remove them is the Amazon way and is essential to being able to release new features which help and don’t hinder your customers.
How Do You Ensure Adequate Supply With Increasingly Complex Supply Chains?
The supply chain process is made more complex by a variety of delivery options (next day/same day), especially with perishable goods. Customer research online ahead of time leads to fierce price competition, which eats away margins. The number of interdependent factors associated with supply chain has a big impact on complexity (customer demand, seasonality, marketing, cash flow, different requirements of stakeholders in the supply chain).
Can You Be ‘Just in Time’ in a Dynamic Market?
Consumers have gotten used to being able to find what they need quickly. If you cannot supply what is needed, then your consumer will often look elsewhere. Forecasting effectively requires good data and experience and is key to making sure you can fulfill expected demand without sinking much money into stock. Just in time stock control is made easier by leveraging big data to analyze supply and demand and create forecasting models to predict both accurately.
The LogicMonitor Solution for the Retail Industry
From Logistics to E-commerce, Using Data To Drive Decision Making

LogicMonitor marries visibility into your traditional and cloud workloads with your IoT and productions systems to allow you to troubleshoot and optimize the system as a whole – from stock control to revenue data, all of this can be detailed in one system allowing the business to be more agile and make informed, data-based decisions.
Extensive Breadth of Coverage Across On-Premises Into Cloud and Containers

LogicMonitor has extensive coverage across the enterprise IT landscape and into the cloud with monitoring templates for everything from SD-WAN to containers. Often businesses are used to data silos, with teams needing their own specialist tools to monitor their specific technologies. LogicMonitor liberates silos by allowing every team to troubleshoot their problems in the same way with granular performance data for all types of infrastructure.
Easy Customization and Simplified Extensibility
LogicMonitor was designed by engineers for engineers and ease of customization is at the heart of the platform. The LM Exchange provides the perfect mechanism for the LogicMonitor team and our customers to share new monitoring templates. LogicMonitor simplifies the process of building custom monitoring templates with our rapid prototyping capabilities, allowing engineers to choose from a multitude of different mechanisms to extract monitoring metrics including our new ability to ingest metrics pushed from a monitored device. You don’t need to worry about building your own data sources if you don’t want to, we also have a large team of professional services engineers available to help users customize their monitoring based on needs.

A Secure Platform
LogicMonitor’s platform is secure. The following are just some of the ways LogicMonitor ensures user and systems security.
Secure Architecture
- RBAC, 2FA.
- Encryption of data in transit and at rest.
Secure Data Collection
- Only outbound communication is allowed from the LM Collector.
- Data encrypted with TLS.
- LM Collectors are securely locked to your environment.
Secure Operations
- Collectors based on hardened Linux with perimeter and host-based IPS.
- Operated out of top-tier DCs and AWS regions.
- All with top security measures in place.
Secure Practices
- Minimal personal data stored.
- Device access credentials stored in memory and never written to disk.
- Salted one-way hashes used in place of user passwords.
Secure Standards
- Constant penetration testing ensures maximum security.
- SOC2 validates our controls for security.
- High availability and confidentiality.
In addition to LogicMonitor’s native platform, by leveraging a secure proxy, user operations teams will retain complete control of communications. This allows users to lock down traffic out of their networks to minimize exposure to external bad actors.
Identify Patterns and Anomalies With AIOps
Especially in the retail space, being able to analyze trends in demand can be the key to ensuring you have the right stock in place to fulfill customer needs. LogicMonitor uses industry-leading algorithms to analyze any metric ingested. Using LogicMonitor’s bespoke monitoring templates allows you to ingest revenue and stock data to identify patterns and anomalies.
LogicMonitor’s AIOps features intelligently detect service-impacting signals from noise, make signals more actionable, and reduce the flurry of false alerts that keep teams up at night. With alert escalation chains, users can ensure the right team members are informed via SMS, email, chat, or ITSM integrations. LogicMonitor’s AIOps capabilities enable teams to identify the root cause of an outage and put an end to alert storms with built-in dynamic thresholds and root cause analysis.

One-Click-Observability™
Users are able to gain full observability in one click. The LogicMonitor platform can connect the dots between metrics, logs, and traces right out of the box.
- Metrics – LogicMonitor’s agentless approach to monitoring metrics makes the discovery and application of monitoring templates very easy. With coverage for more than 2,700 different technologies spanning network, cloud, containers, and applications, LogicMonitor is arguably the most comprehensive monitoring platform in the market.
- Logs – By aligning log data to metric data you remove the need to context switch between IT infrastructure monitoring and log management products. LogicMonitor correlates logs with metrics in a single platform industry-standard integrations (or via any custom log source).
- Traces – The addition of trace data alongside metrics and logs means you never miss an application error. This insight allows you to improve code quality and diagnose and fix issues faster. With end-to-end tracing for your application, you get insight into the performance of the entire app stack, from code to cloud, to ensure a flawless customer experience in agile environments.
In an industry where consumers are very cost-conscious and increasingly fickle, customer experience is important to keeping your customers happy and also just keeping your customers at full stop. Using technology to reduce downtime within your online marketplace but also to predict trends before they happen will be key to keeping ahead of the competition. Data is needed to make the right decisions and in a complex technology environment, having a complete overview of your critical business systems and business performance could be the differentiating factor that sets your business apart.
Kubernetes allows DevOps teams to deploy containerized applications faster and makes managing containers at scale significantly easier. Obtaining visibility into these containerized applications is key to maximizing application/service performance and proactively preventing downtime. Because the availability of containerized workloads relies on Kubernetes orchestration, you should also monitor Kubernetes cluster resources. With LogicMonitor’s new Kubernetes Monitoring Integration you can comprehensively monitor your Kubernetes clusters and the containerized applications running within them, alongside your existing hybrid IT infrastructure in a single pane of glass.
LogicMonitor’s Kubernetes Monitoring integration relies on an application that can be installed via Helm and that runs as one pod in your cluster, which means there’s no need to install an agent on every node. This application listens to the Kubernetes event stream and uses LogicMonitor’s API to ensure that your monitoring is always up to date, even as the resources within the cluster change. Data is automatically collected for Kubernetes nodes, pods, containers, services, and master components (e.g. scheduler, api-server, controller-manager). Pre-configured alert thresholds provide meaningful alerts out of the box. Applications are automatically detected and monitored based on best practices, using LogicMonitor’s extensive library of monitoring templates. This means that you’ll get instant visibility into your containerized applications without the hassle of editing configuration files, having to rely on matching container image names, or manually configuring monitoring. Additionally, LogicMonitor retains this granular performance data for up to two years. Combined, these benefits enable LogicMonitor to monitor your Kubernetes clusters with fewer required tools and processes than alternative solutions.
To get started, simply select the ‘Add Kubernetes Monitoring’ option from the Resources page within LogicMonitor:

You’ll be prompted to enter in some information about how and where your monitored cluster will display in the LogicMonitor resource tree, as well as what API Tokens will be used, what namespace the integration application should run in, and how many LogicMonitor Collectors you want running:

The information you enter will be used in the next step to display the Helm commands you’ll need for installation:
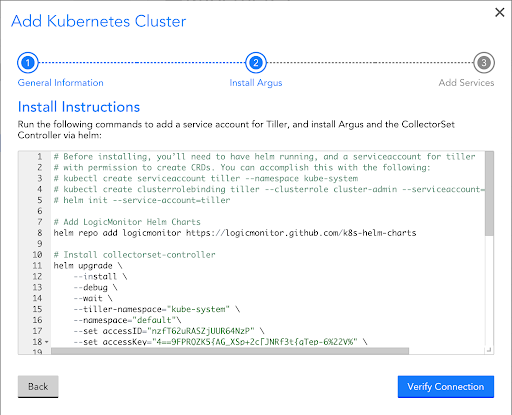
You can copy and paste the helm commands directly to install the integration in your cluster:

After installing, you should be able to verify that everything was appropriately created in LogicMonitor:

In the last step of the wizard, you can create LogicMonitor Services based on Kubernetes label key-value pairs. This result is a logical service for each label key-value pair that groups together the Nodes and Pods with the label, and aggregates metrics across them to achieve cluster-wide statistics. This enables you to track aggregate health and performance for a specific label, regardless of changes in underlying resources:

After finishing the wizard you’ll see a new Resource Group in LogicMonitor that represents your monitored Kubernetes cluster, a Service Group that includes the services created based on label key-value pairs, and a Dashboard Group that includes automated dashboards that provide instant visibility into your cluster.
The Resource Group includes:
- nodes, grouped by worker-role
- pods, grouped by namespace
- services, grouped by namespace
Each of these resources are automatically monitored, and Containers are automatically discovered and monitored for each pod:

Additionally, containerized applications will be automatically discovered and monitored. For example, this cluster is running the Kubernetes example Guestbook application, and LogicMonitor has automatically applied monitoring for Redis on all Redis pods:

The dashboard shown is created automatically and provides comprehensive visibility into cluster health in an at-a-glance format, so you can easily assess the health of your cluster and even identify where applications are consuming too many resources.

It’s as easy as that! With LogicMonitor you get comprehensive visibility into your Kubernetes environments in minutes, and present it alongside the rest of your cloud and on-premisess infrastructure, all in a single pane of glass.
If you’re not a customer yet and want to check out LogicMonitor’s industry-leading hybrid monitoring capabilities, start your free trial today.
LogicMonitor is an agentless monitoring solution. What we really mean by “agentless” is that we don’t require an agent on every monitored server (physical or virtual). One LogicMonitor Collector – a lightweight application that takes just seconds to install – can monitor hundreds or even thousands of devices, including servers, virtual machines, network switches, storage systems, cloud resources, containers, and more. As an agentless solution, LogicMonitor is easier to set up than a traditional agent-based monitoring (because you only have one lightweight app to install), and takes fewer IT cycles to manage over time (e.g. because you don’t have to worry about maintaining consistent versions across agents). When it comes to monitoring Kubernetes, LogicMonitor’s agentless approach enables you to comprehensively monitor your cluster and the health and performance of the resources within without requiring an agent on every node.
LogicMonitor’s Kubernetes Monitoring relies on two primary applications for monitoring:
- An application, Argus, running in the cluster for discovery
- A Dockerized LogicMonitor Collector running in the cluster for data collection
The first application, Argus, runs as one pod and uses event-based discovery alongside LogicMonitor’s API to ensure monitoring is always up to date with what is running in the cluster. The second application, LogicMonitor’s Collector, collects data for Kubernetes nodes, pods, containers, and services via the Kubernetes API, as well as more traditional protocols like SNMP or JMX, to ensure that cluster resource performance and health are comprehensively monitored. In all, these two pods running in your cluster is all that is required to start monitoring Kubernetes with LogicMonitor.

A diagram of how LogicMonitor’s Kubernetes monitoring works, including components necessary for discovery and monitoring.
Although running an agent on every node in a Kubernetes cluster can be made easier, for example by using a daemon set, there are also disadvantages with using agent-based monitoring for cluster architectures relying on master and worker relationships. The Kubernetes Master handles orchestration and scheduling. It is important to monitor the master components (i.e. kube-apiserver, kube-scheduler, controller-manager), to ensure the desired state of the cluster is enforced. However, with agent-based monitoring, you’ll likely end up with multiple data collection requests to these master components – one for each agent. As a result, agent-based can be overly taxing on the Kubernetes Master, in addition to being more difficult to configure and manage.
In addition to being agentless, LogicMonitor has comprehensive metrics for Kubernetes nodes, pods, containers, services, master components, and common applications, so you get instant visibility into your cluster’s health and performance. Pre-configured alert thresholds mean you get out-of-the-box monitoring and alerting. Data is retained at the granularity at which it is collected for up to two years, which enables you to have long-term visibility into the performance of your applications.

A LogicMonitor Dashboard displaying metrics for Nodes, Pods, Containers, and Services in a Kubernetes Cluster.
With LogicMonitor, you can get comprehensive Kubernetes monitoring without the hassle of node-based agents. Sign up for a free trial today!