
Name resolution is a critical component of network management, allowing systems to translate human-friendly domain names into IP addresses. However, discrepancies between tools like ping and DNS can lead to confusion and potential monitoring inaccuracies.
This article explores why these discrepancies occur and provides guidance on troubleshooting and resolving these issues.
How ping and DNS differ in name resolution: Common causes of discrepancies
Most people know their hosts via DNS names (e.g. server1.lax.company.com) rather than IP addresses (192.168.3.45), and so enter them into their monitoring systems as DNS names. Thus, there is a strong requirement that name resolution works as expected in order to make sure that the monitoring system is, in fact, monitoring what the user expects it to be.
Sometimes, we get support requests about how the LogicMonitor collector is resolving a DNS name to an IP address incorrectly, but the DNS is all set up as it should be, so something is wrong with the collector. However, the issue is simply in the interactions of how hosts resolve names, which is not always the same as how DNS resolves names.
The confusion lies in the fact that the tools people often use to validate their name resolution setup – host and nslookup – only use the name resolution system. They talk to the name servers listed in /etc/resolv.conf (or passed to them by their Active Directory configuration), and ask the name servers about what a particular host resolves as.
However, Windows and Linux do not just use the DNS system. They have other sources of resolving names – the /etc/hosts file on linux,WindowsSystem32driversetchosts on Windows, NIS, NetBIOS name resolution, caching systems like nscd – none of which are consulted by host or nslookup, but any of which may return conflicting information that the operating system may use.
As a simple example, you can see below that there is a local entry defining the address of foo.com to be 10.1.1.1:
 [[email protected]:~]$ cat /etc/hosts
 127.0.0.1 logicmonitor.com logicmonitor.com.localdomain logicmonitor.com4 logicmonitor.com4.localdomain4
 ::1 logicmonitor.com logicmonitor.com.localdomain logicmonitor.com6 logicmonitor.com6.localdomain6
 10.1.1.1 foo.com
While the ping program uses the locally configured address:
[[email protected]:~]$ ping foo.com
PING foo.com (10.1.1.1) 56(84) bytes of data.
^C
--- foo.com ping statistics ---
2 packets transmitted, 0 received, 100% packet loss, time 1725ms
The host and nslookup programs do not:
[[email protected]:~]$ host foo.com
 foo.com has address 23.21.224.150
 foo.com has address 23.21.179.138
 foo.com mail is handled by 1000 0.0.0.0.
 [[email protected]:~]$ nslookup foo.com
 Server: 216.52.126.1
 Address: 216.52.126.1#53
Non-authoritative answer:
 Name: foo.com
 Address: 23.21.224.150
Comparison of Ping vs DNS Name Resolution
Ping and DNS resolve names differently due to the varied sources they consult. Below is a comparison of these tools:
| Aspect | Ping | DNS (nslookup, host) |
| Source of Resolution | Local hosts files, NetBIOS, NIS, caching systems | Only DNS servers listed in /etc/resolv.conf |
| Impact of Caching | May use stale cached data (e.g., nscd) | Typically reflects current DNS server data |
| Local Overrides | Uses /etc/hosts and similar local sources | Ignores local entries, only queries DNS servers |
Troubleshooting steps for resolving name resolution discrepancies
If you encounter discrepancies between how the ping command resolves a DNS name and the expected DNS results, follow these steps to pinpoint and resolve the issue:
- Check Local Hosts Files
First, inspect the local hosts file on your system (/etc/hosts on Linux or C:\Windows\System32\drivers\etc\hosts on Windows). Entries in these files can override DNS settings, causing ping to resolve a name differently than tools like nslookup or host. Look for any entries that may be directing traffic to an unexpected IP address. - Flush DNS and Name Service Caches
Caching can often be the culprit behind outdated or incorrect name resolution. Use commands such as ipconfig /flushdns on Windows or sudo systemd-resolve –flush-caches on Linux to clear DNS caches. Additionally, if you’re using a name service cache daemon like nscd, restart it with sudo systemctl restart nscd to ensure it’s not serving stale data. - Review Name Resolution Order
On Linux systems, the order of name resolution is determined by the nsswitch.conf file. This file specifies which services to query (e.g., DNS, files, NIS) and in what order. Misconfigurations here can lead to unexpected results. Ensure the file is set up correctly and reflects the desired order of resolution. - Compare Results with Nslookup or Host
Use nslookup or host to query your DNS server names directly. This will show you the IP address that DNS servers are returning for a given hostname. Compare these results with what ping is showing. If nslookup provides the correct IP address while ping does not, you’ve confirmed that the issue lies outside of DNS, likely due to local overrides or caching. - Examine Network Configuration and Overrides
Network settings, including VPNs, proxy configurations, or split DNS setups, can affect name resolution. Check your network settings and look for any rules or overrides that could be directing your queries differently based on your network context.
By systematically reviewing these factors, you can identify the root cause of name resolution discrepancies and ensure your monitoring and diagnostic tools are functioning as expected. Always keep in mind the source each tool is using, and adjust configurations as needed to maintain consistent and reliable name resolution across your systems.
Take control of your network monitoring with LogicMonitor
So the moral of the story? Know where the tool you are using is getting its information from. If it is nslookup or host, it is only querying the Domain Name system. The operating system (ping, telnet, etc) may well be using other sources of information.
Don’t let name resolution discrepancies compromise your network performance. LogicMonitor provides comprehensive insights into your network’s health, helping you pinpoint and resolve issues swiftly. With advanced monitoring tools that factor in all name resolution sources, LogicMonitor ensures that your monitoring data reflects the true state of your network.
Virtual memory in Linux allows the operating system to use part of the hard disk as extra RAM, effectively creating the illusion of having more memory available, but before diving into monitoring techniques, it’s crucial to understand the basics of virtual memory. This process involves two key mechanisms: swapping and paging.
- Swapping: Entire processes are moved from RAM to disk when physical RAM memory is full.
- Paging: Only specific pages of memory are moved to disk, allowing more granular control over memory usage. More information about these mechanisms is available in The Linux Documentation Project’s guide on swap space. For a beginner-friendly explanation of swap space, see PhoenixNAP’s article on what swap space is and how it works.
LogicMonitor’s article What is Virtual Memory Anyway provides a deeper look into these concepts.
Essential commands for monitoring Linux memory usage
Monitoring a system’s available memory is critical to ensuring it operates efficiently. Here’s how to get started:
1. Physical memory: free and top commands
Using the free command provides a quick snapshot of memory usage, including total, used, and memory allocation. The top command offers real-time memory usage stats, making it invaluable for ongoing monitoring.
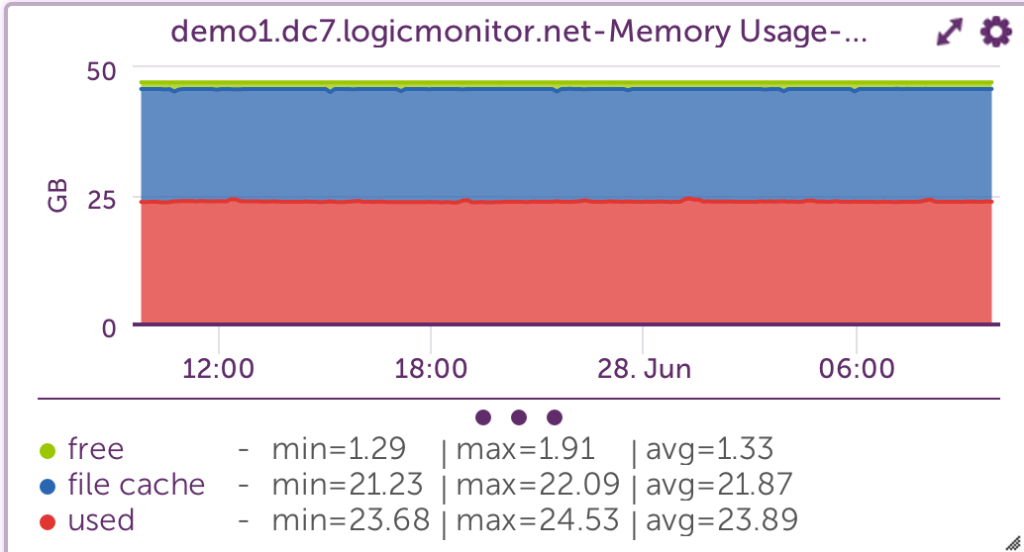
[demo1.dc7:~]$ free -g
             total       used       free     shared    buffers     cached
Mem:            47         45          1          0          0         21
SaaS-based server view
Linux uses all physical memory that is not needed by running programs as cache files. When programs need physical memory, the Linux kernel will reallocate a file cache memory to programs. So, memory addresses used by the file cache is free, or at least allocatable to programs, and serves its purpose until needed by another program.
It’s ok if all Linux memory is used, little is free, or is in use as a file cache. It’s better to have some file cache, except in these two instances:
- When running large Java programs where maximized heaps are necessary
- Needing databases, rather than the OS, to manage disk caching
As long as there is free virtual memory, and not active swapping, most systems will run efficiently with physical memory. More information about Linux memory is available in LogicMonitor’s blog article The Right Way to Monitor Linux Memory, Again.
2. Virtual memory usage: free -t command
Using free -t provides detailed information about swap memory usage, which is critical for understanding how much virtual memory is in use.
Example
free -t
[demo1.dc7:~]$ free -t
total used free shared buffers cached
Mem: 49376156 48027256 1348900 0 279292 22996652
-/+ buffers/cache: 24751312 24624844
Swap: 4194296 0 4194296
Total: 53570452 48027256 5543196
Monitoring view
According to the outputs above, the system has used zero swap space. So, even though 90% of the total swap and physical virtual memory space is in use, the system never ran low enough on physical memory.
High swap usage can be dangerous, as it means the system is close to exhausting all memory. When programs need more main memory and are unable to obtain it, the Out Of Memory (OOM) Killer will begin killing processes based on the amount of memory initially requested, among other criteria. The server process, which sets the entire function of a server, will likely be one of the first to be killed.
While high swap usage is not recommended, low to moderate swap usage of inactive memory is no cause for concern. The system will shift inactive pages from physical memory to disk to free memory for active pages.
Knowing if swaps are being used is key to keeping usage low.
Monitoring virtual memory paging rate
One of the most critical indicators of memory issues is the rate at which memory pages are moved from physical memory to disk. This can be monitored using the vmstat command, specifically the si (pages swapped in) and so (pages swapped out) columns.
Example
vmstat
dev1.lax6:~]$ vmstat 1
procs -----------memory---------- ---swap-- -----io---- --system-- -----cpu-----
r  b   swpd   free   buff  cache   si   so    bi    bo   in   cs us sy id wa st
8 17 2422376 122428   2520  24436  952  676  1796   904 10360 4421 41  0 33 26  0
9 17 2423820 123372   2524  24316  732 1716   752  1792 12259 4592 43  0 25 32  0
8 17 2425844 120408   2524  25044  416 2204  1616  2264 14675 4514 43  0 36 21  0
7 19 2427004 120532   2568  25640  608 1280   764  1308 12592 4383 44  0 36 20  0
8 24 2428816 121712   2572  25688  328 1880   500  1888 13289 4339 43  0 32 25  0
Server monitoring view:
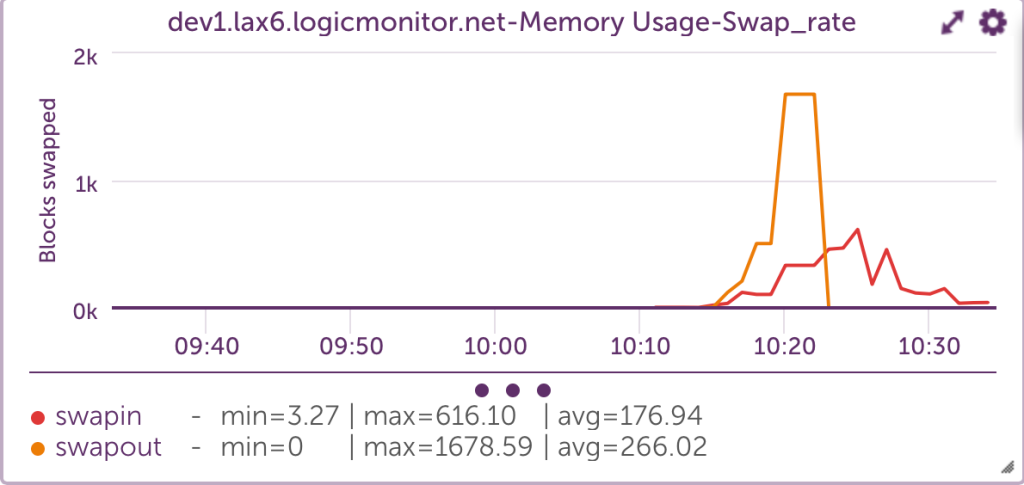
Swapping out a large number of blocks is the main indicator that a system is running low on memory. Swapping blocks at a high rate causes bottlenecks to performance because systems must look for needed codes on disk, rather than on physical memory, to run efficiently. This “hunt-and-switch” process slows performance.
In reviewing this graph, the sustained spikes in the page-in and page-out rates could be an indication of memory contention. Occasional spikes may be normal under heavy workloads, but frequent or prolonged activity often indicates the need to optimize memory usage, increase physical memory, or investigate memory leaks.
Additionally, the relationship between page-in and page-out rates can provide insight into system performance. For instance, a high page-in rate with a relatively low page-out rate may suggest that the system is successfully recovering from a temporary spike in memory usage. However, if both metrics are high over a long period, the system is likely thrashing — constantly swapping memory in and out, leading to performance issues.
Best practices for Linux memory management
To keep your system running efficiently, it’s essential to follow these best practices:
- Minimize swapping: Ddjust the swappiness parameter to reduce swapping frequency, especially on systems with ample RAM.
- Optimize swap space: Ensure swap space is appropriately sized for workloads.
- Monitor file cache usage: Understand that Linux uses available RAM for file caching, which can improve performance but may need adjustments depending on applications.
For more insights on how Linux manages memory, including tips on free memory and file cache, read LogicMonitor’s article More Linux Memory: Free Memory That Is Not Free Nor Cache.
Conclusion
Monitoring and managing virtual memory effectively is crucial for maintaining optimal performance in Linux systems. By using the right tools and following best practices, IT managers can be confident that servers will handle even the most demanding workloads without missing a beat.
A full range of Linux monitoring resources is available on the LogicMonitor blog. In particular, LogicMonitor offers reliable Linux monitoring capabilities via SSH, which can collect critical metrics such as CPU, memory/shared memory, filesystem utilization, user space, uptime, and network throughput. This method is especially useful for systems where SNMP is not configured. LogicMonitor’s suite of DataSources allows IT managers to monitor Linux environments comprehensively without the need for special permissions or SNMP setup.
For more details on configuring SSH-based Linux monitoring, and how to import LogicModules for full coverage, explore LogicMonitor’s Linux (SSH) Monitoring package.
For businesses and organizations that need reliable, secure servers to host data, applications, or services worldwide, Linux is often the platform of choice. Linux is a popular operating system because it is open-source, highly secure, and offers a lot of customization options, making it ideal for both personal and professional use.
Let’s learn what Linux is and some of the reasons why it’s such a popular option for setting up and maintaining servers, from emerging startups all the way to full enterprise deployments.
What is Linux?
Linux is an open-source operating system based on Unix known for its stability, security, and flexibility. It powers various devices, from personal computers and servers to smartphones. The kernel, the core component, manages hardware resources and facilitates software communication. Users can customize and distribute their own versions, called distributions, like Ubuntu and Fedora. Developers and system administrators favor Linux for its powerful command-line interface and extensive programming support.
Whether running dynamically scaled workloads in the cloud, creating private cloud infrastructure, or deploying bullet-proof web servers, Linux’s flexibility, scalability, and security make it an ideal choice. You can use it to build reliable, high-performance web servers or as the foundation for custom application development environments.
Based on UNIX principles, Linux offers efficient multitasking and supports multiple users, groups, and access control lists (ACLs). Popular distributions include Ubuntu, Suse, and Red Hat Enterprise Linux, which provide extensive software libraries and security features.
Why is Linux so popular?
Linux’s popularity is due to its flexibility and cost-effectiveness. Many companies integrate Linux servers into their IT infrastructure across various environments, such as embedded systems, private clouds, and endpoint devices. Its open-source nature allows developers to customize their operating systems without vendor constraints.
Here are 9 reasons why Linux is a popular choice for servers:
1. Open-source nature and customization flexibility
Linux is open-source and free, allowing users to modify and distribute it as needed. Its flexibility and customization make it an ideal choice for server operational environments. For example, developers can access code repositories, modify source code, and build custom kernel versions.
In addition to adapting the kernel to specific needs, developers have access to a wide variety of software packages available with most Linux distributions. These packages can be used to add additional functionality or security features, such as firewalls or intrusion detection systems (IDS). Additionally, many distributions come with tools such as lshw (list hardware) and lspci (list devices), which allow administrators to view detailed information about the hardware and devices connected to the server.
Linux offers great customization and flexibility, allowing users to adapt solutions to their needs. Additionally, users can optimize Linux to enhance system performance for specific applications, ensuring that the system runs efficiently and effectively.
2. Range of applications and tools
Linux has become a popular choice for servers because its wide range of applications and tools allow users to customize and configure their systems to perform virtually any task. Linux is compatible with various hardware architectures and easily integrates numerous applications and services.
Linux is well-known for its compatibility and integration with various hardware and software platforms. This makes it ideal for server use; you can deploy it in almost any environment. It is also possible to install Linux on multiple hardware types, from laptops to the latest servers.
The most common uses for Linux servers include web hosting, database management, file sharing, game servers, and virtualization—all of which require specific software packages or libraries to run correctly. Fortunately, Linux’s open-source nature makes it easy to find the necessary components for any type of application or use case, reducing the need to purchase expensive commercial software.
In addition to its vast array of applications and tools, Linux offers an impressive range of user-friendly features that make it a great choice for administrators who want to manage their server environment easily. For example, administrators can leverage projects like Terraform or Ansible to manage large numbers of Linux servers or VMs all at once. Rather than logging in to each system and configuring them individually, the Linux ecosystem makes it easy to deploy and configure environments through repeatable, automated actions.
3. Enhanced security
Built from the ground up with security in mind, Linux has numerous features that make it difficult to breach. A critical security feature is access control capability, which allows admins to set permissions and restrictions on user accounts and files. For example, administrators can set read-only or write-only access rights for users to prevent unauthorized programs from executing on their servers.
Additionally, Linux supports multiple authentication methods, such as username/password combinations, smart cards, biometrics, and digital certificates. These methods provide an extra layer of protection by verifying each user’s identity before granting access to data and resources.
The open-source nature of Linux means that anyone can find, report, or fix a security issue. This is in major contrast to proprietary systems like Windows, where you’re mostly at the vendor’s mercy to identify and fix bugs before hackers find them and use them maliciously.
Linux source code is public, meaning anyone can check their developers’ work to see if they left a door open for hackers. Because of this, Linux is generally seen as more secure than Windows and other proprietary operating systems.
Linux stands out for its lower number of security vulnerabilities than other operating systems, making it a preferred choice for many users and organizations seeking a robust and reliable platform. The Linux community and developers are also dedicated to maintaining a secure environment by providing frequent updates and patches. These regular security updates ensure that any emerging threats are quickly addressed, protecting and securing the system.
4. High stability and reliability
Due to its outstanding reliability, Linux can run for extended periods without needing reboots, making it a popular choice for server operating systems. It’s also incredibly secure and stable, making it well-suited for mission-critical tasks. Linux’s robust open-source codebase and highly active development community mean bugs can quickly be identified and patched. Additionally, many available packages make tools easily accessible to complete the tasks at hand.
Long-term support (LTS) versions of Linux distributions allow users to upgrade reliably without worrying about compatibility issues. Many companies provide dedicated LTS versions explicitly designed for use as servers, with guaranteed support and security updates for up to five years or more.
Linux efficiently manages resources, providing stable and consistent performance. Its robust design ensures system resources are utilized optimally, resulting in reliable and smooth operation even under demanding conditions. This consistent performance makes Linux an ideal choice for both servers and desktop environments.
5. Community support and resources
Linux is widely used as a server operating system due to its robust community support and resources. Support includes user forums, online knowledge bases, live chat help desks, and detailed tutorials.
Linux users benefit from the abundance of dedicated forums. They are filled with experienced professionals eager to help those having trouble with setup or have questions regarding configuration options. Many forums offer personalized advice and general information on topics ranging from hardware compatibility to troubleshooting common issues. Community-driven development ensures that Linux receives regular updates and new features, enhancing functionality and security.
6. Cost-effectiveness compared to proprietary software
You can use Linux to run mission-critical applications while still being affordable. In most cases, you can save money on licensing fees because Linux requires fewer resources than other operating systems. Linux is cheaper because there are no license fees unless you’re paying for RHEL or Oracle. However, it’s important to note that it can require more advanced years than other licensed and supported operating systems.
Linux offers a lower total cost of ownership due to reduced software and support costs over time. Its open-source nature eliminates the need for expensive licensing fees, and the robust support from the Linux community minimizes the need for costly external support services.
7. Scalability for handling large amounts of data and traffic
Linux is highly scalable, making it an ideal platform for servers that handle large amounts of data and traffic. It can run hundreds of services simultaneously and can be configured to provide elastic responses that match the user’s demand. This scalability extends to more than hardware—Linux can scale across multiple systems for added efficiency and flexibility. It offers advanced features like virtualization and fault tolerance to ensure business continuity.
Scaling Linux is easy and seamless. It runs exceptionally well on both physical and virtual machines and can easily handle large loads while maintaining availability and uptime. This makes it ideal for applications that require reliability, such as web hosting and database management.
Linux also offers cutting-edge features for developers, like the eBPF virtual machine and io_uring, which allow developers to track kernel events and perform I/O operations more efficiently. Linux’s stability makes it perfectly suited for mission-critical applications when reliability is crucial. Many users rely on eBPF and robust “user mode” protections to ensure errors or failures don’t affect the entire system. Containers and VMs also exist to further isolate what the kernel and userspace cannot isolate.
8. Compatibility with modern DevOps practices and configuration management
Linux is an important part of modern DevOps practices. Many businesses use it to streamline their software development and deployment processes. With containerization technologies like Docker and orchestration tools like Kubernetes, Linux provides a platform for these tools to operate efficiently. Its lightweight and modular architecture allows for continuous integration/continuous deployment (CI/CD) pipelines, enabling rapid development cycles and more efficient management of infrastructure as code (IaC).
Linux’s high compatibility with configuration management tools such as Ansible, Puppet, Chef, and SaltStack ensures efficient and scalable infrastructure management. These tools allow administrators to automate server provisioning, configuration, and management, creating consistency and reducing the potential for human error.
For instance, Ansible uses simple YAML files to describe automation jobs, which you can execute on any Linux machine without requiring a special agent. Puppet provides a more comprehensive framework with a declarative language that allows administrators to define the desired state of their infrastructure.
9. Support for visualization
Linux excels in virtualization, offering various tools and technologies to create and manage virtual environments. Virtualization allows multiple operating systems to run on a single physical machine, optimizing resource utilization and reducing hardware costs. Tools like KVM (Kernel-based Virtual Machine), QEMU, and Xen enable the creation of virtual machines (VMs) with high performance and security.
Linux’s built-in support for these virtualization technologies ensures efficient resource allocation and management, making it a preferred choice for hosting multiple servers on a single physical host. Additionally, Linux containers (LXC) and containerization platforms like Docker offer lightweight alternatives to traditional VMs, providing isolated environments for applications with minimal overhead. This versatility in virtualization supports diverse use cases, from development and testing to production workloads, making Linux an ideal choice for scalable and cost-effective server solutions.
Conclusion
Linux has grown incredibly popular, as evidenced by its widespread use in web hosting services, cloud computing solutions, home routers, IoT devices, TVs, cars, refrigerators, and anything else with a computer that isn’t a Windows or Mac desktop or laptop. Its lightweight design enables it to consume fewer resources while providing powerful performance levels, which are ideal for server tasks like database management or application hosting.
If you’re considering using Linux for your servers, these seven reasons provide a great starting point to help you decide if it’s right for your business. From security and stability to flexibility and affordability, there are many compelling reasons to give Linux a try.
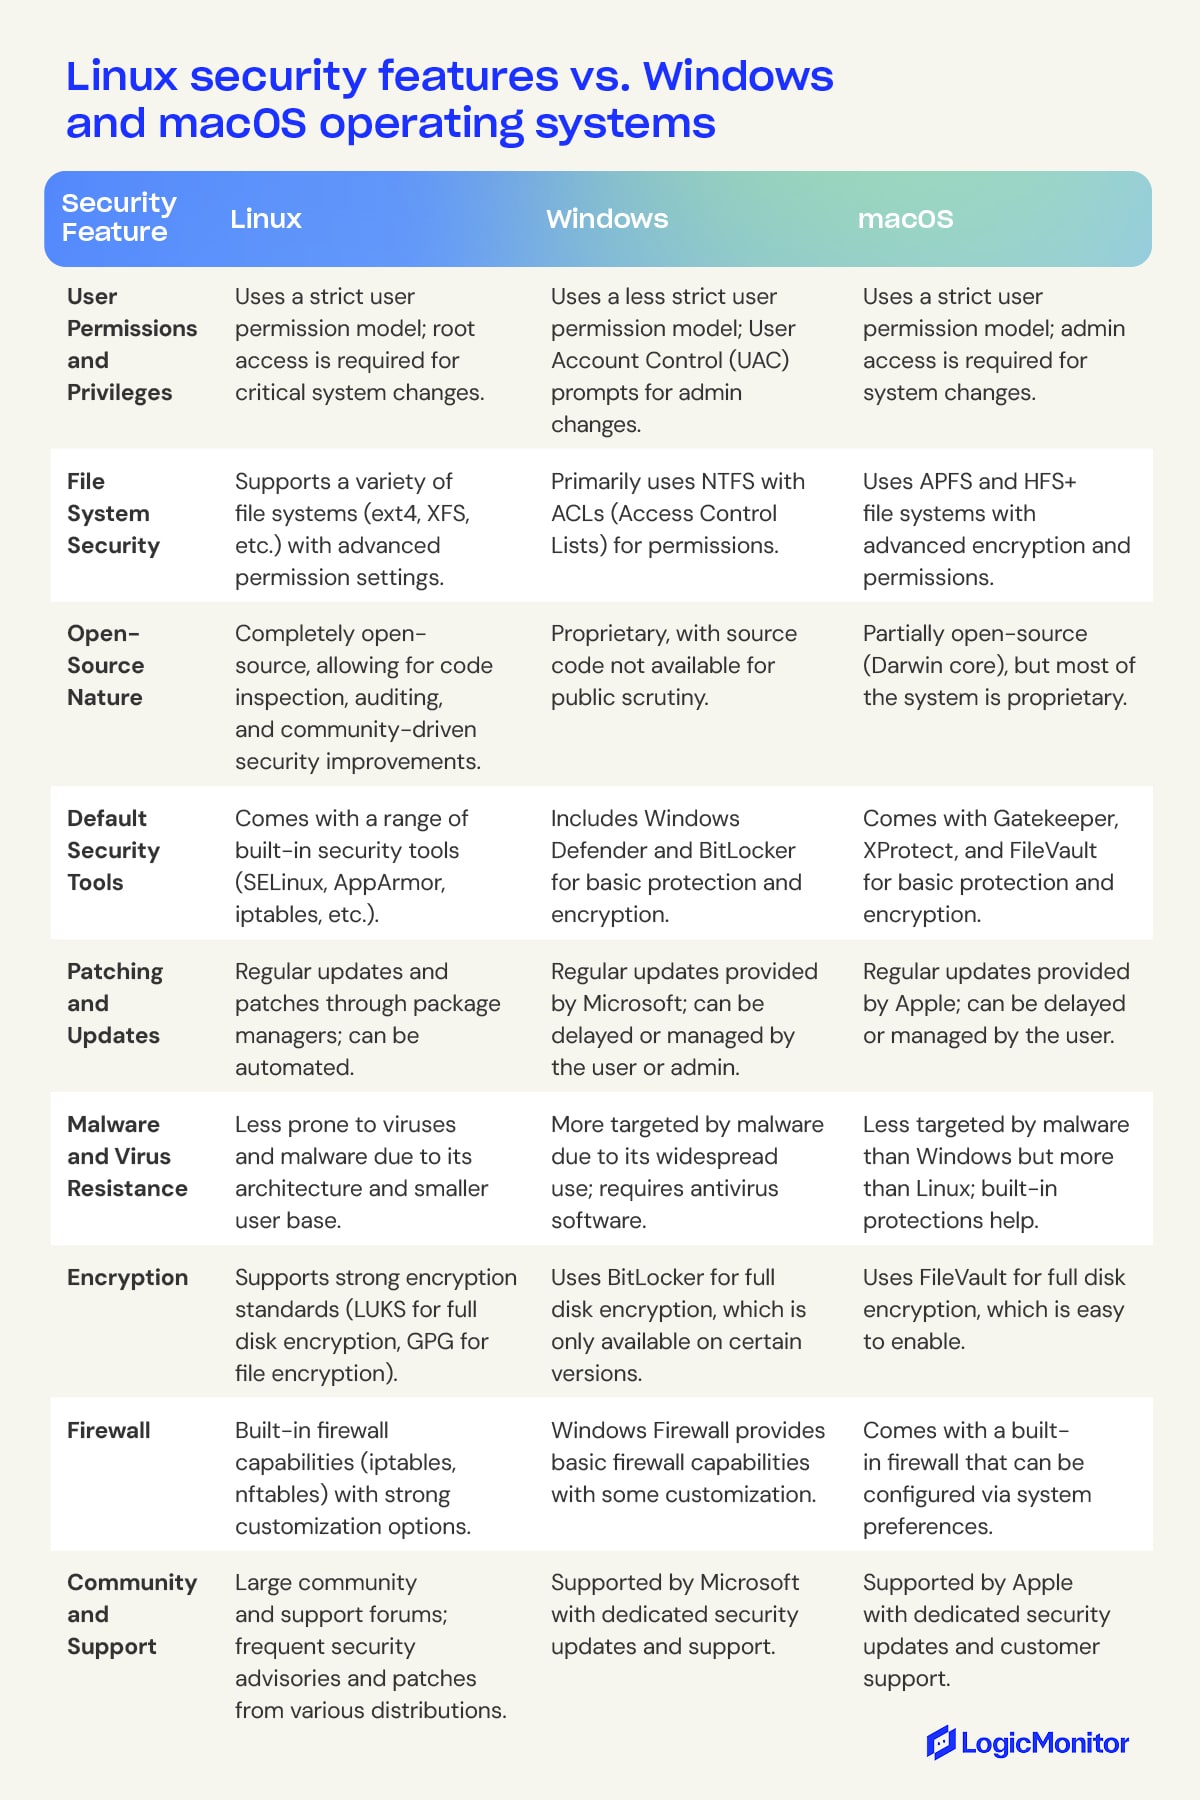
Security features comparison chart
Linux FAQs
How much control do users have over their Linux systems?
Linux gives users a lot of control over their systems. Users can choose how their Linux system looks and works, from the desktop environment to the core system settings. They can also customize security settings, install the software they want, and tweak the system’s performance. Unlike other operating systems with restrictions, Linux lets users manage and modify their systems as they see fit. This flexibility is beneficial for advanced users and IT professionals who need a high level of customization.
How do I troubleshoot and fix boot issues in Linux?
Various factors, such as corrupted boot loader configurations or faulty hardware, can cause boot issues in Linux. Common steps to troubleshoot boot issues include checking the boot loader configuration file (such as GRUB), running filesystem checks using commands like fsck, and examining system logs located in the /var/log directory for errors.
How do I handle file permission and ownership issues in Linux?
File permission and ownership issues can lead to access problems. To troubleshoot, use the ls -l command to check the current permissions and ownership of files and directories. Modify permissions with chmod and change ownership with chown. Ensure that users and groups have access rights to the required files appropriately.
What should I do if my Linux server is running out of memory?
If your Linux server is running out of memory, you can troubleshoot by identifying memory-intensive processes using commands like top, htop, or free. Check for memory leaks or misconfigured applications that consume excessive memory. The Out-Of-Memory (OOM) killer may also come into play, terminating processes to free up memory. Additionally, optimizing your system by adjusting swap space and configuring memory limits for applications can help. Monitoring tools like vmstat and sar provide insights into memory usage patterns. Start monitoring your Linux systems with LogicMonitor and gain valuable insights into their performance.
Contact us today and see how our comprehensive platform can help you optimize your Linux environment. Don’t miss out on this opportunity to take control of your IT operations and stay ahead of the competition with LogicMonitor!
Some time ago, our fearless (fearsome?) leader wrote a fine blog about the Right Way to Monitor Linux Virtual Memory. It turns out he was right on the money (Steve’s a smart guy — who knew?). Although his blog focused on monitoring Linux Virtual memory, it turns out there’s some nuance in monitoring Physical memory as well.
Because you’re a Linux geek, you of course know that free is the tool you use to ask your kernel about how it’s using memory:

Or, better yet, you’ll just trust your monitoring system to do it for you. Here’s one of the visualizations provided by LogicMonitor’s NetSNMPMem DataSource applied to a Linux system:
But wait! What does it mean when your monitoring system — which is most certainly polling Net-SNMP for memory info — disagrees with free. In this case, Net-SNMP says this system is using ~28 GB of memory, while free claims it’s only using ~1.5 GiB. A discrepancy of ~26.5 GiB is certainly worth further investigation.
Let’s take a quick look at where the graph is getting its data, and how it is calculating “Used” space. As you can see in the screenshot below, the “Used” datapoint on the graph is calculated by subtracting “Free” and “File Cache” from “TotalReal” (The total amount of real/physical memory installed on this host). If you believe free is providing the correct info, we’d assume either “Free” or “File Cache” to be about 12 GiB larger.

So let’s see how free calculates “used” and see if that clears things up. Turns out free gets its information by parsing the /proc/meminfo file. This file provides much more detailed memory usage than Net-SNMP. Here’s a snippet from proc/sysinfo.c, the code free uses to parse /proc/meminfo:
mem_used = kb_main_total – kb_main_free – kb_main_cached – kb_main_buffers;
Apparently free is using a similar calculation, subtracting free space and cache space from the total amount of memory. However, buffer space is also being subtracted, which isn’t captured by NetSNMPMem or factored into the “Used” calculation. Normally, buffers won’t use a huge amount of space; the kernel documentation cites “20MiB or so”, so this probably isn’t the culprit. The free command above does show ~30 GiB under buff/cache but it doesn’t give a breakdown of buffers and cache. Let’s look at /proc/meminfo on the system in question:

Buffers shows a paltry ~75 MiB of space used. Quite a bit more than the kernel docs specify, but nowhere near 12 GiB. Looking at Cached, we see about 2.5 GiB, which is what was reflected by Net-SNMP as shown in the graph above.
So what gives? Is free wrong? Shouldn’t Buffers and Cache added up to the ~30 GiB listed in the output of free? We’d better confirm what free means by “buff/cache”, so back to the source!
printf(” %11s”, scale_size(kb_main_buffers+kb_main_cached, flags, args));
Looks rather straightforward, buffers plus cached. We’ll have to go a bit deeper and verify how these values are getting created. The kb_main_buffers variable is straight from the Buffers line in /proc/meminfo, so let’s see what comprises kb_main_cached:
kb_main_cached = kb_page_cache + kb_slab_reclaimable;
That’s interesting, free’s cache metric is the sum of the page cache, and whatever kb_slab_reclaimable is. The kb_page_cache variable corresponds to the Cached” line in /proc/meminfo, so presumably the slab thing is the source of our discrepancy. Looking in /proc/meminfo again, there’s “Slab”, “SReclaimable”, and “SUnreclaim”. I’ll save you some Googling; Slab is the size of the in-kernel data structures cache. It caches things like inodes and dentries. SReclaimable is part of the slab that can be reclaimed, whereas SUnreclaim is the other part of the slab that (you guessed it) can’t be reclaimed.
Putting it altogether, let’s add Cached, SReclaimable, and Buffers from /proc/meminfo to get what free calls “buff/cache” (or kb_main_cached in the source):
2577684 + 27733024 + 74448 = 30385156
The output of free and /proc/meminfo were recorded a few minutes apart, but the value above looks like what we’re seeing from the free command above. We’re getting the data from the same place, so this is completely expected.
But, weren’t we originally concerned with “used” space? Let’s confirm based on the formula in the source for “mem_used” above:
MemTotal – MemFree – (Cached + SReclaimable + Buffers) – Buffers = Used
32661080 – 464700 – 30385156 – 74448 = 1736776
It’s not exactly the same as what free is reporting as “used”, but it’s much closer. The discrepancy is due to polling the data at different times; we’re doing the same calculations above as free does.
The values provided by Net-SNMP clearly fail to take the slab space into account, or we would see a much larger “File Cache” and much smaller “Used” on our graph. Net-SNMP does use /proc/meminfo, but doesn’t take slab reclaimable space into account. Technically, the “File Cache” datapoint in the graph above is correct, as slab reclaimable space is an object cache, not a file cache. Regardless, to get this extra degree of insight, we can use Net-SNMP’s “extend” feature to get the contents of the /proc/meminfo file via SNMP and do the calculations ourselves.
Add this line to your snmpd.conf, and restart the daemon:
With LogicMonitor’s new Linux_Meminfo_SNMP DataSource your newly-configured extended OID will be discovered and monitored automatically.

But there’s one more piece of the puzzle you might still be curious about; why was the slab cache using ~28 GiB of memory? We’ll save the detailed analysis for a possible future blog, but for the curious, we looked at /proc/slabinfo (like meminfo, but for slab) and it was largely being used by the “dentry” object type. For the nerdy and curious, you can read more about the “directory entry cache” in the kernel.org vfs specification.
LogicMonitor has always been committed to providing the most comprehensive insight into your datacenter. Our array of executive dashboards track performance metrics with up to two years of history, as well as provide at-a-glance views of your infrastructure’s present status. Now, LogicMonitor can also predict the state of your infrastructure for up to three months with alert forecasting.
Several years back, the hashtag #monitoringsucks took the IT world by storm. Among monitoring users’ chief complaints was the lack of actionable data that could be drawn from your typical monitoring tools. IT blogger James Turnbull notes:
“Nagios can trigger [alerts] on a percentage threshold, for example the disk is 90% full… [but it] doesn’t tell you the most critical piece of information you need to make decisions: how fast is the disk growing.”
This is a problem many IT professionals face. Monitoring has historically been relegated to being the bearer of bad news: it warns you about performance issues, but does not help strategize a resolution. Alert forecasting tackles this challenge in a new and exciting way by predicting metrics’ trends and letting you know when they will reach a designated alert threshold. With this information, you can prioritize the urgency of performance issues, refine budget projections, and strategize resource allocation.
Let’s take a look at some of our most popular alert forecasting uses.
Continuing with Mr. Turnbull’s example of disk usage, let’s say you receive a warning indicating a disk is 80% full. With 20% of your disk space still available, this alert may not induce any sense of urgency. But, it does beg some questions: how quickly is disk space filling up? When will you receive a critical alert that the disk is, say, at 95% capacity? To answer these questions, you need alert forecasting. With the historical data collected on this disk, alert forecasting uses predictive analytic algorithms to craft a future trajectory of disk usage. This trajectory shows how much time will pass until the alert becomes critical and requires immediate attention. In this case, knowing how quickly your free disk space is diminishing allows you to create a strategic timeline for how and when you will need to allocate resources to increase available disk space.

Forecasting predicts that disk space usage will surpass 95% within 28 days.
Another common use of LogicMonitor’s forecasting is financial budgeting. Take, for example, one of LogicMonitor’s most popular datasources, AWS Billing. As cloud computing continues to lure the IT industry, AWS’ platform has become a major portion of one’s IT budget. Using alert forecasting on our AWS Billing datasource lets you project what your monthly or quarterly spend will be. This is an invaluable tool for everyone involved in drafting your IT budget including CFOs, CIOs, and Directors.
The benefits of alert forecasting are enormous, but there is always one question that hounds any sort of predictive analytics tool: how accurate are the forecasts? The short answer for LogicMonitor’s alert forecasting is “extremely accurate.” For a longer and probably more convincing answer, let’s delve into how alert forecasting works.
Before we start forecasting, we ensure your historical data is robust by applying a seasonal hybrid ESD model. In layman’s terms, this algorithm corrects data gaps and removes isolated outliers that don’t represent your metric’s overall trend. Once the data is primed, we use a series of ARIMA and HoltWinters statistical models, similar to those used in business’ fiscal projections and economic forecasting, which graph a trajectory of your metric’s future performance. One particularly cool feature of our alert forecasting is the “minimum confidence to include” field, which lets you designate the minimum level of confidence that LogicMonitor’s algorithms must have in order to predict an alert. For instance, a 90% minimum confidence indicates there is at least a 90% chance that an alert will be triggered by a certain date. Just as LogicMonitor is committed to never sending you a false alert, we are also committed to making the most accurate forecasting projections!

At LogicMonitor, we go beyond alerting on your environment’s performance issues. We want to be a resource for optimizing your entire IT strategy. To learn more about the alert forecasting tool, including how to set one up for yourself, visit our Alert Forecasting support page.
This table uses the past year of data to project the number of days until media wearout, CPU, 5-min load average, and disk usage datapoints surpass their designated thresholds.
What is the process for monitoring custom metrics on your AWS EC2 (Amazon Elastic Cloud Compute) Linux instances? The easy way is to use a LogicMonitor collector to monitor your Linux servers, which will provide much more detail and metrics than AWS monitoring provides. Using a collector means its easy to write your own datasources to extend what is collected, using all sorts of mechanisms (JMX, snmp, WMI, database queries, JSON or other HTTP output, etc.) – although you probably won’t need to.
However, if you don’t want the complete suite of LogicMonitor monitoring on your devices, and just want the cloudwatch metrics to show in LogicMonitor, LogicMonitor’s AWS integration will automatically pull in all the standard Cloudwatch metrics. But if you want to extend the Cloudwatch metrics – we’re going to use custom EC2 Linux memory metrics as an example (one of the standard metrics the Collector would get automatically for you) – and pull them into LogicMonitor, this step by step guide will show you how to do it.
As background, the default metrics for each of your EC2 instances are comprised of CPU, Disk, Network and Status. AWS provides the option, for a price, to add custom EC2 metrics to CloudWatch. This requires some configuration on the EC2 instance, within AWS itself, and through adding new datapoints to the existing EC2 datasource in your LogicMonitor portal. If you add AWS tags to your EC2 instances that are defined as Linux, it will make it easier to apply multiple EC2 instances to the new datasource that will be created.
To note, this blog post assumes you have taken the time to set tags. For this example we have used the AWS tag, “system.aws.tag.OS,” and set it to “Linux”. Check out this AWS article to learn how to setup the custom metrics for memory on the AWS EC2 Linux, and verify that the new custom metrics are visible within cloudwatch (illustrated in the image below).

Step 1: Setup Your AWS Account in LogicMonitor
- LogicMonitor’s AWS monitoring requires an AWS Account and Read Only user to get started.
Step 2: Clone the AWS EC2 Datasource in LogicMonitor (see image below)
- In Settings → LogicModules → Datasources, type “EC2” in the search.
- Select the AWS_EC2 datasource and hit the clone button at the bottom of the page.
- Name the new datasource to “AWS_EC2_Memory_Linux”.
- Change the Displayed as name to “EC2 Custom”.
- Set the Applies to field to match our tag that we set in AWS for Linux systems (in this case: “Linux”).
- You can now select a datapoint toward the bottom of the new datasource and clone it.


Step 3: Clone the CPU Utilization Datapoint and Change the Metric Path and Name (see image below)
- Clone it for each new memory metric: MemoryAvailable, MemoryUsed and MemoryUtilization.
- Change the metric paths in each of the new datapoints to match the new names:
- System/Linux>InstanceId:##system.aws.resourceid##>MemoryAvailable
- System/Linux>InstanceId:##system.aws.resourceid##>MemoryUsed
- System/Linux>InstanceId:##system.aws.resourceid##>MemoryUtilization
- Set the Alert Threshold in the data point via the dropdown to “No Threshold”.
- Update the Description and save the new datapoint.

Step 4: Add a New Graph for Memory to the Datasource Showing New Values and Existing Graphs (see image below)
- In the datasource, click the “Add Graph” button and name the new graph “Memory” (also make sure the graph name field specifically is set as “Memory”).
- Set the label name to “Memory Stats”.
- Add each of the datapoints and lines to the graph.
- Save the datasource.

Step 5: Selecting EC2 Custom Instance in Devices Tab (see images below)
- Go to the devices tab and while selecting the name of one of the Linux AWS EC2 instances, click the manage button and run active discovery – you should now see a new EC2 Custom instance.
- Select the EC2 Custom instance and look in the raw data tab to see the new memory fields (illustrated in the first image below).
- Then, select the graph tab to see the new Memory graph (illustrated in the second image below). To note, the Memory graph will take some time to populate.


That’s it, enjoy your new EC2 memory custom metrics in LogicMonitor!
A customer contacted our support recently, wondering why his Linux servers showed high memory utilization. We’ve talked a fair bit about monitoring Linux memory, and what it means. But this case was a little different. The customer showed that according to free, top, and LogicMonitor graphs, most of his server’s memory was in use – and not as file system cache.
However, the odd thing is that top and ps showed that the sum of all processes RSS (resident segment size) was consuming very little memory. So where was the memory going?
The most common reason people have for complaining that the free memory shown in top does not add up to the resident memory used by processes is because they fail to notice that most of the memory is used by the cache (which is, in effect, free memory.) But that was not the case here.
Looking at the contents of /proc/meminfo showed these two lines:
Slab: 4126212 kB
SReclaimable: 4096172 kB
So – almost 4G of memory was in use by the kernel slab memory structures – but almost all of that memory was reclaimable. (Or, in effect, free.)
So reclaimable slab space is yet another way that Linux memory can be in effect free, but not show up in the free memory statistics.
Does this change the way we should monitor the memory of Linux systems? Not at all. Linux will do a good job of managing the available physical memory and the data structures within it. When physical memory runs low, it will start swapping out to disk backed virtual memory. So long as you are monitoring the rate of blocks being swapped per second, and this is fairly low number – it doesn’t really matter what the physical memory is being used for.
Of course, you can dig into what is using the slab, using slabtop, /proc/slabinfo, and start tuning your /proc/sys/vm stuff, for things like min_slab_ratio…
But, unless you have active paging on this system, I would not bother.
Everything is working fine, and if memory gets low, the kernel will give up the reclaimable slab (4G worth.)
I was going to write about the differences between monitoring virtual memory on Linux and Solaris, but figured it would be beneficial to start with some fundamentals about what virtual memory is, and the differences between Solaris and Linux.

Virtual memory is used by all current operating systems. It simply means that the memory address a program requests is virtualized – not necessarily related to a physical memory address. The program may request the content of memory address 1000; the computer looks at where the current map for address 1000 is pointing, and returns the contents of that address. (Virtual address 1000 may be mapped to physical address 20.) Of course, if the memory is virtualized, that means that there is no need to actually have physical memory on the server for every address the programs think they can address – so the programs can believe the server to have more memory than it physically does. Virtual memory addresses do not need to be mapped to anything until they are allocated by a program. And a virtual memory address can be mapped not to a physical block of memory for storage, but to a block on a hard drive.
So if the operating system has 2G of physical memory, has a program loaded that is using 1.5G of memory, and the user attempts to start another program that will also use 1.5G of data in memory – what happens? To simplify things a bit, the memory pages that the first program is using will be copied from physical memory to disk, thus freeing enough memory for the second program to run. If the first program then has to run again, the second program’s data will be written to the disk backed portion of virtual memory, and the first program’s data read in from disk, and it will run again. Of course, accessing a hard drive to retrieve the contents of a virtual memory block will be much slower than accessing physical memory, so the operating system tries to avoid using disk backed virtual memory.
There are two terms used: swapping and paging. In Linux, these are used synonymously – but in Solaris and other more venerable operating systems, swapping refers to moving an entire process out to disk backed virtual memory, not just some of its least used memory blocks. (Swapping predates hardware support for virtual memory mapping in the CPU.)
Paging is the process of moving some chunk of memory (not necessarily an entire process and its memory) from physical memory out to disk backed memory (swap partition or a swap file) in order to free more physical memory. The operating system may use different algorithms for selecting the memory to page out – such as the least recently used block of memory – so for example, if a program has been running happily, but the OS is getting low on memory, it may move the parts of the program responsible for initialization and loading out to disk, simply as they haven’t been accessed in a while. (And it is quite likely that those memory pages will never be accessed again while the program runs, so this is a good choice. And if the memory being paged out was read in from disk, and hasn’t been altered – it won’t be written to the swap space, just removed from physical memory, as the OS knows it can read it in again from the original disk location.)
And the final complication – Solaris virtualizes the swap space, as well. So some physical memory is in fact used as swap space, as well as the swap space allocated on disk, and the amount of physical memory used as part of the virtualized swap space changes with the demand for memory, so the size of the virtual swap space changes.
So the use of virtual memory on disk to increase the apparent physical size of memory is a good thing – but swap can cause problems. It’s not usually the paging out of memory that causes problems – it’s when the system attempts to use the memory that is currently backed by disk that is the problem, as it has to read the blocks from disk back to physical memory – and of course, disk access is much slower than memory access. So if the OS has to constantly copy memory from disk to run it, then copy it back to disk and load new memory spaces from disk (known as thrashing) this can bring your system to a crawl. So the use of swap is not bad – but the active use of memory that is mapped to disk can be a performance killer. (Thus the rate of disk IO to the swap partitions will be an indication of the performance issues.) And of course completely exhausting swap (which means the entire system memory has no free space) is also a Bad Thing.
One question we sometimes hear is “I have lots of physical memory. Should I disable swap space? That way I can be sure I won’t have any swapping or paging issues.”
Short answer: No. You should always have swap available. There will always be some pages that can be safely swapped out to disk, that will rarely or never be accessed again, that will allow more free physical memory for active uses – even if the active use is just as a file system cache. (So having space on disk to act as memory allows more memory to be used to avoid having to read the disk!) And of course, having swap means much more available virtual memory – so less chance of running out of memory, and having the out-of-memory killer kill random processes.
So we’ve talked about what swapping and paging is, why it’s important, and what problems it can cause. Next article will talk about how to monitor it effectively, and compare the monitoring required on Linux and Solaris.
Last week I was traveling to and from our Austin office – which means a fair amount of time for reading. Amongst other books, I read “The Principles of Product Development Flow”, Reinertsen, Donald G. The most interesting part of this book (to me) was the chapters on queueing theory.
Little’s law shows the Wait time for a process = queue size/processing rate. That’s a nice intuitive formula, but with broad applicability.
So what does this have to do with monitoring? (more…)
One of our long time customers, Appfolio, who makes great SaaS property management software, asked how they could use LogicMonitor to monitor the size of some files across their fleet of Linux servers. A simple request, but not as simple as one might hope. Why not? LogicMonitor usually uses SNMP to monitor Linux servers, as that way there is no need for extra software to be installed on any server. (It should be noted that some people deploy LogicMonitor collectors as agents, deploying one per server. In this case, you could use a script based datasource to simply run ‘ls’ on arbitrary files – but that’s for a different blog entry.) While SNMP has many defined OIDs (a fancy way of saying questions that can be asked and answered), there is no defined OID for “how big is arbitrary file X?” Which means that by default, there is no way to remotely query a system, using SNMP, to determine a file size. (more…)