You might think that SD-WAN and firewalls are two completely unrelated technologies. However, integrating these innovations improves network availability, optimizes network performance, and adds an extra layer of security capabilities to your organization.
In this blog post, you will learn more about SD-WAN and firewalls, and why combining them can be a game-changer for your network infrastructure.
How Firewalls and SD-WAN work together
Firewalls and SD-WAN provide network security and management benefits but do it in different ways. A firewall enforces rules determining the security of outgoing and incoming network traffic, while SD-WAN enhances and manages traffic by directing it through the best available route. While many people working in IT use these technologies separately, you can integrate them for more secure and successful network performance.
Steps to integrate Firewalls and SD-WAN
Combining a firewall with an SD-WAN solution requires multiple steps. First, you must determine your network’s security and performance requirements and choose a firewall that integrates with an SD-WAN device. Then you need to physically connect your chosen firewall with the device and configure security policies on the firewall. That helps you decide which network router traffic to approve or block. You also need to determine network optimization procedures in your SD-WAN device.
Testing your integration and monitoring your network is critical. The best network monitoring tools, like LogicMonitor’s LM Envision platform, evaluate and visualize the performance and security of your entire network infrastructure, helping you identify and minimize issues that could impact your organization. LogicMonitor’s platform provides real-time network monitoring, letting you troubleshoot problems as they happen.
Benefits of combining Firewalls with SD-WAN
Combining firewalls and SD-WAN provides multiple benefits for network security and management. Integrating these technologies improves security by safeguarding internal and perimeter network layers. Your firewall protects your network infrastructure from external threats, while your SD-WAN device protects against dangers from incoming traffic.
Integrating firewalls with SD-WAN will also streamline network management, allowing you to focus on other IT tasks. You can benefit from a centralized network management system that ensures availability and reduces component failures.
Next, let’s take a look at the individual benefits of these two technologies:
Understanding Firewalls
Definition
A firewall is a network security device or software that observes and manages incoming and outgoing network traffic based on your preferred security parameters. It serves as a gatekeeper between your network and another network, like the Internet. Using a firewall can prevent unauthorized access to your network.
Functionality
Firewalls function in different ways. Firewalls monitor network packets and compare them to your security protocols, deciding which packets should pass through your network. It also prevents your network from accessing specific ports, which is an old-school way of making it more difficult for bad actors to infiltrate your network and steal sensitive data.
Other firewall functionality includes network address translation (NAT), which allows an internal network device to hide its IP address on the internet. NAT technically can hide an internal network device’s IP, but the primary purpose of NAT is to allow many (internal) hosts to access another network (usually the public internet) with the same address, so NAT is not quite “firewall” functionality.
In a modern environment, firewall solutions that go along with secure SD-WAN typically operate on zones and applications and abstract a lot of the IP/Port concepts of older firewalls.
Types
Firewall types include stateful inspection firewalls that inspect network packets and monitor connections between devices. Application layer firewalls examine network traffic at the application layer of a network based on the services and applications you use. Next-generation firewalls have extra advanced security features such as URL filtering and intrusion prevention. Cloud firewalls have recently become more popular and monitor network traffic in cloud applications.
Importance in network security
Firewalls and antivirus are important because they protect your valuable data centers from hackers and ensure your network is safe and reliable. Bad actors can distribute malware and distributed denial of service attacks after finding network vulnerabilities, making firewalls one of the most important additions to your tech stack.
Understanding SD-WAN
Definition
SD-WAN stands for Software-defined Wide Area Network. It uses software to spread network traffic across a wide area network and maintain network speeds and connectivity.
Functionality
SD-WAN functions by controlling how network traffic passes through locations. SD-WAN typically requires physical hardware and uses software to decide the best route for network traffic in real-time based on performance and bandwidth.
Traditional WAN at scale usually requires large amounts of money for MPLS circuits, which are like toll roads that provide reliable, safe, critical internet connections between two points.
SD-WAN is highly regarded because it takes many “commodity” internet connections (COX business accounts, home connections, satellites, MPLS, etc.), and it automatically manages traffic between them to give you a user experience like MPLS for much less cost and hassle.
Benefits
SD-WAN improves network performance. Ultimately, SD-WAN enhances traffic so the applications and service providers you use work properly. It also offers multiple security advantages. You can create security procedures through a single virtual platform, making it easy to review network activity and identify threats.
Importance in network management
Another benefit is simplified network management. You can customize and manage WANs with software rather than dealing with a traditional WAN through physical hardware. That can save time and costs for your organization and make it easier to administer and operate your network.
SD-WAN vs. Firewalls
| Feature | SD-WAN | Firewall | Combined Use |
| Primary Function | Optimizes network traffic and performance. | Secures network by monitoring and blocking threats. | Enhances both network performance and security. |
| Key Benefit | Improves connectivity and reduces costs. | Protects against cyber threats. | Provides a balanced approach to security and performance. |
| Use Cases | Multi-site connectivity, cloud access. | Perimeter security, internal segmentation. | Best for businesses needing both optimization and security. |
| Deployment | Cloud or on-premises, managed centrally. | Hardware or virtual, at network perimeter. | Integrated, often within a unified platform. |
| Performance Impact | Optimizes routes for lower latency. | May slow down traffic due to inspection. | Balances security with performance needs. |
When to use SD-WAN, Firewalls, or both
Choosing between SD-WAN, firewalls, or a combination of both depends on your organization’s specific network needs, security requirements, and overall IT strategy. Here’s a guide to help you determine the best approach for different scenarios:
When to use SD-WAN
SD-WAN is ideal for organizations that need to optimize their wide-area networks (WANs) for better performance and cost efficiency. Consider using SD-WAN in the following scenarios:
- Multiple Branch Locations: If your business operates across multiple locations, SD-WAN can simplify WAN management by providing centralized control and automated traffic routing across diverse connection types like broadband, LTE, and MPLS.
- Cloud-First Strategies: Organizations that rely heavily on cloud applications and services benefit from SD-WAN’s ability to provide direct, optimized access to cloud providers, bypassing traditional backhaul paths that can cause latency.
- Cost Reduction Needs: SD-WAN can significantly reduce operational costs by utilizing cheaper broadband connections alongside traditional MPLS, effectively balancing performance and cost without sacrificing reliability.
- Performance Optimization: For companies looking to improve application performance, SD-WAN’s ability to dynamically route traffic through the best available path ensures that critical applications receive the bandwidth and low latency they need.
When to use Firewalls
Firewalls are essential for any network security strategy, providing a first line of defense against cyber threats. You should prioritize standalone firewall solutions in the following situations:
- High-Security Environments: If your organization handles sensitive data or operates in a highly regulated industry (e.g., healthcare, finance), standalone firewalls offer the advanced threat prevention and compliance features necessary to protect critical assets.
- Internal Network Segmentation: Firewalls are effective for segmenting internal networks, creating security zones that restrict access to sensitive areas, and preventing lateral movement by attackers within the network.
- Dedicated Perimeter Security: For businesses with traditional network architectures that rely on a strong perimeter defense, firewalls provide robust security features such as deep packet inspection, intrusion prevention, and application-layer filtering.
- Complex Security Requirements: When your network demands intricate security policies, detailed monitoring, and customized access controls, standalone firewalls offer the depth of security management that SD-WAN alone cannot provide.
When to use both SD-WAN and Firewalls
Integrating SD-WAN with firewalls can provide the best of both worlds—optimized network performance and robust security. Consider combining both technologies in these scenarios:
- Comprehensive Security and Performance: Organizations that need to maintain high performance across their network while ensuring strong security should integrate SD-WAN and firewalls. This combination helps in dynamically routing traffic efficiently while protecting against cyber threats at multiple layers.
- Hybrid and Multi-Cloud Environments: For businesses leveraging hybrid cloud or multi-cloud environments, integrating SD-WAN and firewalls ensures secure, optimized connections between on-premises infrastructure and various cloud services, enhancing both connectivity and security posture.
- Retail and Distributed Enterprises: Retail chains, franchises, and other distributed enterprises with many endpoints can benefit from SD-WAN’s simplified management and firewalls’ ability to protect sensitive transactions and customer data across all locations.
- Remote Workforces: As remote work becomes more prevalent, combining SD-WAN and firewalls can secure remote connections, ensuring employees have reliable, fast, and secure access to corporate resources from any location.
Conclusion: Maximizing network performance with SD-WAN and Firewalls
Firewalls and SD-WAN have many differences, but combining them can improve network performance, management, and security. Doing so can prevent cyberattacks and ensure your applications operate smoothly, providing a robust solution that meets both connectivity and security needs. You can create a resilient and efficient network infrastructure that supports your business objectives by leveraging both technologies.
Continuous monitoring is essential to maximize the benefits of integrating SD-WAN and firewalls. LogicMonitor’s LM Envision platform provides full visibility into your entire network infrastructure, offering real-time insights and proactive alerts in a single pane of glass. This ensures you can swiftly identify and resolve issues, keeping your network secure and optimized.
The recent CrowdStrike outage highlights the urgent need for robust observability solutions and reliable IT infrastructure. On that Friday, employees started their days with unwelcome surprises. They struggled to boot up their systems, and travelers, including some of our own, faced disruptions in their journeys. These personal frustrations and inconveniences were just the beginning. The damage was much deeper with businesses facing operational downtime, financial losses, and reputational damage as a result of the outage. This incident surfaces the importance of a unified observability view across IT infrastructure to mitigate risks effectively.
Why enterprise-grade IT observability matters
While basic monitoring systems that focus solely on “up/down” status provide limited visibility, they often fail to identify the root cause of issues. Enterprise-grade IT observability goes beyond traditional monitoring by offering deep insights into system health, performance, and dependencies, which are crucial for effective troubleshooting.
Enterprise-grade IT observability capabilities, enhanced by advanced logging tools and generative AI companions, provide a single pane of glass view that reduces complexity and enables more effective problem resolution. By integrating various data sources and offering contextual insights, proactive observability tools significantly shorten Mean Time to Identification (MTTI) and Mean Time to Resolution (MTTR).
How LogicMonitor customers worked through major disruption during the CrowdStrike IT outage
During the CrowdStrike outage, LogicMonitor provided meaningful contextual information through the Windows log data ingested at or around the time the issue occurred, enabling customers to take the relevant course of action. Here’s a detailed account of how we helped one of our customers navigate the issue with LogicMonitor’s help.
A customer’s immediate response and resolution
During out-of-working hours, LogicMonitor detected a critical “down” condition on the servers across a customer’s Windows environment, ensuring no critical warning went unnoticed. As part of the troubleshooting process, the anomalies and logs provided by LM Envision offered additional context. The ‘message’ field in each anomaly highlighted unusual patterns, helping to identify potential issues more effectively.
The IT team was alerted immediately and able to detect the exact extent of the affected systems. The detailed, meaningful, and insightful context provided by the LM Envision dashboards allowed for rapid analysis and quick decision-making. This enabled them to efficiently monitor the restoration process, significantly improving their MTTI/MTTR.
With LogicMonitor’s proactive monitoring and detailed alert system, the customer was able to minimize downtime and mitigate potential breaches of SLAs during the outage. The detailed insights provided by LM Envision enabled the IT team to respond swiftly and effectively, reducing the impact on business continuity despite the widespread scope of the CrowdStrike incident.
How Edwin AI enhancements saved the day
One customer leveraging Edwin AI was able to correlate over 500 alerts to the CrowdStrike incident, showcasing the platform’s efficiency in reducing alert noise. Edwin AI’s advanced analytics and correlation capabilities were instrumental in quickly identifying the cause and effects of the situation.
Another customer using Edwin AI successfully identified the root cause of the failed CrowdStrike Falcon service. This customer used LogicMonitor to identify process-level failures, allowing them to correlate and pinpoint the exact cause of the disruption. Edwin AI’s proactive insights and detailed analysis significantly shortened their troubleshooting time.
The real-life stories of our customers emphasize the significance of not only advanced AI capabilities but also the crucial role of enterprise-grade IT observability in effectively managing widespread IT incidents. The CrowdStrike incident is a stark reminder of the pressing need for comprehensive observability solutions, not just for a select few businesses but for all enterprises to thrive in the digital era.
LogicMonitor’s capabilities for outage management
Hybrid Observability powered by AI
LogicMonitor’s approach to hybrid observability combines agentless monitoring with logs in context to provide a unified view of the IT landscape. The complexity in synthesizing various disparate data sources allows LM Envision to provide superior situational awareness. This streamlined approach reduces tool sprawl and enhances operational efficiency, simplifying security management and providing a comprehensive overview of your IT environment.
Proactive detection and response
Leveraging AI and machine learning (ML), LM Envision identifies anomalies in metrics and logs to help provide early warnings of potential problems. When a critical issue triggers an alert, LogicMonitor automatically ensures that teams are promptly notified. Additionally, monitoring out-of-band hardware controllers offers extra visibility into hardware health, facilitating faster issue resolution.
An added layer—Reducing alert noise and providing early warnings with Edwin AI
By analyzing vast amounts of data, LogicMonitor Edwin AI acts as a super IT operations (ITOps) teammate, working 24/7 to reduce alert noise and deliver actionable insights. Edwin AI prioritizes critical issues, thus reducing alert fatigue and accelerating root cause analysis. This capability is crucial during incidents like the CrowdStrike outage, where early warnings and proactive responses can significantly minimize business impact.
Wrapping up
The CrowdStrike outage has reinforced the critical importance of enterprise-grade IT observability. LogicMonitor’s hybrid observability platform, powered by AI, provides businesses with what they need to detect issues early, respond proactively, and maintain business continuity. By empowering customers during outages and preventing potential disruptions, LogicMonitor helps protect brand reputation and customer satisfaction.
IT operations are a constant juggling act. Too many tools, too much data, and not enough time to proactively avoid outages. But what if AI could not only streamline your tools but help you make sense of the chaos? That’s the power of AIOps.
What is AIOps?
To understand AIOps and its evolving landscape, one needs to grasp its basics and current trends.
AIOps stands for Artificial Intelligence (AI) for IT Operations. It is a set of AI-driven technologies designed to improve the efficiency and automation of IT operations.
AIOps vs. Generative AI
AIOps is different from generative AI. Generative AI (GenAI) can generate text, images, or other media using generative models. Its applications range from chatbots to complex creations like art and music. Large Language Models (LLMs) are vital to GenAI. They, use massive datasets to understand, summarize, create, and predict new content.
Current trends in AIOps
Current AIOps trends show a shift to easier data accumulation. Both on-premise systems and cloud providers offer accessible REST APIs and open telemetry. This change lets enterprise IT teams get real-time insights from huge data lakes and IT tools. They leverage technologies like machine learning (ML), AI, natural language processing (NLP), and GenAI.
The challenge: DIY vs. off-the-shelf AIOps
Choosing between custom DIY and off-the-shelf options has its own challenges. While open-source options are available, they may require longer periods (18-24 months) to show value, necessitating ongoing security and technology updates.
The AIOps hype cycle is in full swing. It reflects the growing focus on leveraging AI to improve IT operations and observability. To turn hype into reality, IT leaders need to address common pain points.
Solving IT alert fatigue and data overload with AIOps
Addressing pain points in AIOps involves understanding the many challenges faced by IT teams and executives. IT teams are overwhelmed. Alert fatigue, constant context switching, and an overwhelming amount of data without actionable insights impact day-to-day operations and decrease efficiency.
For IT executives, the challenge is managing expectations. They have to do more with fewer resources. They must also use automation and efficiency to improve business availability and prevent negative publicity from service downtimes. Outdated manual workflows and tools make this even harder
Even with a tool migration, changing underlying IT processes is a culture shift. It demands extensive teamwork and reorientation, often proving more challenging than anticipated. This slows the path to desired efficiencies and business outcomes in AIOps.
The convergence of AIOps and hybrid observability
The convergence of AIOps and hybrid observability represents a significant shift in addressing modern IT challenges. This convergence is essential because of how applications are built and monitored. It requires addressing streams, traces, and metrics from various sources. This is different from traditional observability tools—highlighting the need for diverse tools to serve both legacy and modern observability stacks.
AIOps tools once focused on alert data from various sources. But convergence changes everything. Think of it as a discovery engine for hybrid infrastructures. It gives full access to rich contexts for AI/ML models. This means being able to ‘see’ the devices, and how they are being deployed for deeper troubleshooting.
For example, understanding all aspects of a switch (model, location, firmware) is key, but so is the broader context. If it’s connected to an Amazon EC2 instance, knowing the application, owner, and environment (production or lab) is vital for management.
The result: Faster problem-solving and IT efficiency
This convergence brings substantial business benefits. It speeds up troubleshooting during critical issues (P1 situations) and allows more efficient models to compress alerts in real-time. This significantly enhances IT operations’ responsiveness and effectiveness.
Developing a winning AIOps strategy
The key to a successful AIOps strategy is aligning it with your business goals. Here’s how to get started:
- Realistic vision: Establish a two-year realistic vision with clear milestones. This allows for a focused strategy that can adapt to rapid technological changes and business needs.
- Prioritize use cases: Identify and prioritize the most important use cases. Understand your exact challenges and opportunities. Address them in order of business impact and need.
- Tool/skills gap analysis: Evaluate your existing tools and skills, and identify any gaps. Assess your current abilities for your chosen uses. Make any needed changes..
- Align with business goals: A winning AIOps strategy isn’t just about technology. It’s about ensuring it delivers tangible business value. Have regular touchpoints with the management team. This is to ensure that everyone is on the same page, using the same tools, data, and context.
This holistic approach promotes collaboration. It avoids the pitfalls of siloed operations, leading to a more cohesive and effective IT environment.
LogicMonitor: Your hybrid observability solution powered by AI
LogicMonitor integrates AIOps strategies into its platform. This transforms IT environment monitoring and management. Its agentless, lightweight technology aggregates diverse telemetry into a unified system. This streamlines administration and enhances operational efficiency.
The platform uses AIOps to offer deep insights, showing a comprehensive, anomaly-focused resource view for proactive management. This allows for the early detection of potential issues and furnishes predictive insights, leading to timely resolutions.
LogicMonitor’s innovative alert system provides contextual information, fostering team efficiency and a collective understanding of deployment scenarios. These advancements reduce outage risks, expedite incident responses, and shift focus from reactive to strategic, innovative IT operations.
Discover how LogicMonitor can help. Download the “AIOps for Monitoring” eBook, or email [email protected] to get started with a free demo.
Reacting to alerts can be a pain, however, there are ways to be proactive and decrease frustration concerning IT Alerting. Developing an alerting strategy saves IT Operations and Development teams time, money, and eliminates notifications from low priority alerts. Keep reading for more information on routing and escalation chains, fielding alerts, and how to communicate an alerting strategy to management.
Alert levels of severity
Most alerts have three levels of severity: warning, error, and critical, with warning alerts usually being the least severe. Severity levels vary from organization to organization, but most internal alerting has a variation of these three levels.
Warning: Warnings indicate that there is something to be aware of, that may or may not be a problem now, but can definitely become an error in the near future. Often, with proper proactive measurements in place, warnings can be fixed before they escalate further.
Error: Errors indicate that something is wrong, or isn’t behaving properly. These may need to be fixed quickly, and should be investigated.
Critical: Critical issues typically mean something has broken in a way that needs attention immediately and actions should be taken to remedy any critical issues ASAP.
Read more: What do different alert severities mean
Routing and escalation chains
Routing and escalation chains serve the purpose of capturing which alerts should be routed to which teams. They also determine the severity of those alerts and the corresponding levels of notifications for them.
The most simple escalation chain is sending warning-level alerts to emails or web-only systems. Too many warning-level alerts sent via text or phone can lead to alert fatigue and feeling overwhelmed by your alerts. The goal is to ensure that the problem is remediated, but you don’t want to take unnecessary action, such as waking someone up in the middle of the night for a system that can tolerate a short outage.
Error or critical alerts necessitate SMS or other live push-based notification systems. They can be escalated amongst multiple members of the team. This is dependent on who acknowledges the alert, which would then stop the escalation. Escalation chains can be used to stagger how people get notified. Other options are a “hail-mary” approach where you spam the entire team depending upon the severity of the alert.
Fielding alerts
Upon being notified of an alert, the person on-call to troubleshoot the issue should be able to quickly assess the severity of the alert based on its customer impact. Customer impact examines both customer and employee. If employees are being distracted by alerts with no customer impact, that alert’s settings might need some adjustments. There should be a consistent process in place to field alerts and resolve the issue.
Acknowledging an alert is critical to either stop the escalation of that alert or immediately escalate it to the next team who can provide support. It’s important to continue diagnosing the issue, even after it’s resolved. A critical step is to go back and evaluate whether the alert could be tuned in any way to improve its effectiveness. A good question to ask would be, “Is the alert customer-facing?” If the answer is yes, then respond immediately. If not, examine how urgent the alert truly is.

How to communicate alerting strategy to management
With a more efficient alerting system, companies are able to save money and reallocate it to other areas of their business. IT teams are also able to free up more of their time by avoiding alert fatigue and unnecessary distractions from priority work. Identifying the time and money saved, along with any other relevant data, is the best way to communicate an alerting strategy to management. Numbers go a long way and show the strategic value of making a change. Remember to include your team members in these discussions, because if you are making their job easier you will likely have their full support.
When taking a close look at your team’s current alerting practices, note that no system is perfect. However, working to improve IT Alerting escalation policies with LogicMonitor’s guidance is a step to bettering the function of IT Infrastructure.
Originally published July 14, 2020. Updated November 2022
Outages remain widespread

2020 and 2021 cyberattacks
An overwhelming 88% of MSPs say their customers have been affected by cyberattacks in the last two years. And as concerns about cyberattacks continue to increase, MSPs are not confident they have the tools to effectively manage security challenges on behalf of their enterprise customers.


Cyberattack risk reduction strategies
MSPs have wised up to the growing threat of cyberattacks and are now implementing new strategies and safeguards to better protect their customers from these incidents, including through increased levels of monitoring and automation.

If you’d like to explore how LogicMonitor can help automate and streamline your operations, find out how we can provide insight into your infrastructure, to your logs and applications to make better business decisions on logicmonitor.com/msp.
METHODOLOGY: In October 2021, LogicMonitor commissioned an independent research firm to survey 600 senior global employees working for IT Managed Service Providers (MSPs) in nine countries. The goal of LogicMonitor’s research was to understand the state of MSPs in 2022 and beyond, provide key insights into their strategic goals, and offer up recommendations on how to accelerate transformation to attain those goals
We all know that systems fail. We plan for this with failover partners and system backups. But can you really trust your backups? If you are using Azure monitoring, your backup and site recovery can be complicated. LogicMonitor provides clarity. Our Azure Backup monitoring service provides simple, secure, and cost-effective solutions for backing up and recovering your data using the Azure cloud. It allows recovery services for on-premise, Azure VMs, Azure File Shares, SQL Server, and SAP HANA databases in Azure VMs. Keep reading for a breakdown of which Azure backup and replication jobs you should keep tabs on.

Monitoring Backup Jobs
Monitoring your backups should be as easy as looking at a dashboard. LM Cloud will detect your recovery services vaults and show you their metadata so that you can monitor your backup and replication jobs. LogicMonitor now shows the status of the latest backup and replication jobs and time since the last successful jobs for your Azure resources. This allows you to have a quick understanding of the health of your backup services.
As a best practice, we recommend keeping tabs on the following for backup jobs:
- Status: This shows the status of your last backup attempt. It can be shown as a single big number or as a graph to track multiple resources. We recommend using a warning at 4 and an error at 5.
- Duration: This metric is reported in milliseconds. This can be shown as a single large number or as a graph of numbers that represent each of your resources. We recommend determining a threshold based on how frequent you have the backups set to run.
You can similarly see your replication jobs on a dashboard.

Monitoring Replication Jobs
As a best practice, we recommend keeping tabs on the following for replication jobs:
- State: This gives a numeric value that maps the result of the last replication attempt. It can be shown as a single big number or as a graph to track multiple resources. We recommend alerting if the state was 7 – Failed.
- Time Since Start: This shows the time elapsed since the last job was started. We recommend determining a threshold based on how frequent you have the backups set to run.
- Error Count: This metric lets you know there was an error in the last attempted replication job. We recommend alerting if the value is greater than 0.
Following these guidelines, you can move forward with confidence and know that your backup and recovery in Azure is working. Another benefit is that the time previously spent on this can now be allocated to other important tasks. Be secure in your cloud and on-premises monitoring with LogicMonitor’s insight into the performance of your environment. You can try it free, or book a free demo today.
We live in a digital world, and it’s becoming more and more apparent every day. We rely on our smartphones to give us directions to where we need to go. We rely on email to share information with our colleagues, family and friends. We access our medical records through online portals. We even hail a rideshare through an app that connects us to drivers in locations across the globe.
In this digital world, amidst the buzzwordy “digital transformation,” availability has become our most valuable commodity. However, availability is also difficult to maintain, even for the world’s largest enterprises. A glance at the headlines shows that high-profile outages and brownouts happen all the time, and no organization is exempt.
You may have been one of the shoppers at Target on a recent Saturday when a point-of-sale outage meant customers couldn’t complete purchases for more than two hours, causing lines around the stores. Or perhaps you were one of the British Airways customers who was unable to check-in for your flight due to a recent IT outage, resulting in long lines and flight disruptions at many major airports. Or maybe it’s as simple as not being able to keep up with your networks on your favorite social media channels – like Facebook and Twitter – due to IT outages.
The reality is, the more reliant we are on technology in our daily lives, the more impactful IT outages become, affecting much more than just an organization’s bottom line. To dig deeper into the impact of downtime for today’s businesses, LogicMonitor surveyed 300 global IT decision makers at organizations with 2,500 or more employees.

Here’s what we learned:
Availability Matters
And it matters not only to an organization’s customers, but also to the IT decision makers who are leading the charge. In fact, 80% of respondents indicated that performance and availability are important issues, ranking above security and cost-effectiveness. After all, it doesn’t matter if your IT infrastructure is secure or saving your organization money if it’s not up and running the way it needs to be.

Downtime is Rampant
Despite the clear importance of availability, 96% of IT decision makers surveyed across the globe had experienced at least one outage in the past three years, showing that downtime issues reach far and wide regardless of company size, vertical or location.These IT decision makers also said that 51% of outages – when an organization’s services are systems are unavailable – are avoidable. Further, 53% of brownouts – when an organization’s services remain available but aren’t operating at an optimal level – are avoidable. This means that organizations don’t have the means necessary – whether that’s tools, teams or other resources – to avoid these catastrophic issues, even when more than half of them could have been avoided.
 Downtime is Expensive
When an organization experiences frequent outages, it impacts more than just the bottom line. Our survey found that organizations experiencing frequent outages and brownouts had up to 16x higher costs than companies who have fewer instances of downtime. Beyond the financial impact, these organizations also require nearly 2x the number of team members to troubleshoot problems, and it takes them an average of 2x as long to troubleshoot problems. So the already overburdened IT teams are using valuable time and resources to combat this prevalent issue.

Now that we know the many impacts downtime has for organizations, how can they identify the causes and work to reduce these occurrences? Well to start, a comprehensive monitoring platform like LogicMonitor can allow organizations to view their IT infrastructure through a single pane of glass, meaning potential causes of downtime are more easily identified and resolved before they can impact the business. This type of visibility is invaluable, allowing organizations to focus less on problem-solving and more on optimization and innovation.
Check out the full findings of the 2019-2020 IT Outage Impact Study to learn more about how downtime is impacting organizations, and how it can be avoided in the future.
So, if you are in marketing, or know someone in marketing – you probably heard that Marketo had an outage this week, and it was all over the twitter-verse. The issue was that Marketo failed to renew their DNS domain. Which is unfortunate, but entirely understandable. We sympathize. Things happen. People are imperfect, and make mistakes.

That is why you should always have monitoring for things that people are in charge of. That whole “trust, but verify” principle. Or, think of the monitoring as a safety net. If someone forgets to renew your domain – it would be much better to have an alert trigger and remind them, than have your domain fail to resolve, thus breaking your product’s functionality, and incurring the wrath (and humor) of the internet.
To be honest, domain expiration wasn’t something that LogicMonitor monitored. But, as we note in Part 2 of our “Datacenter monitoring mistakes”, “No issue should be considered resolved if monitoring will not detect its recurrence.” And they don’t have to be your own issues – you (and we) can learn from the public mistakes of others. So, in that spirit, one of our Datasource Engineering team (the awesome Jon Davis) whipped out a quick check to measure the days to expiry of top level domains, and alert you if the domain is expiring within 7 days.
So now you can take advantage of this enhancement to LogicMonitor to avoid your domains expiring. To do so, import this datasource from the LogicMonitor Exchange, using locator HCZPGR.
Note: currently this datasource doesn’t support domains in country TLDs (like google.co.uk); only the regular top level domains like .com, .net, etc. This is why it’s a community standard datasource, and not in our core repository – it still needs a little work.
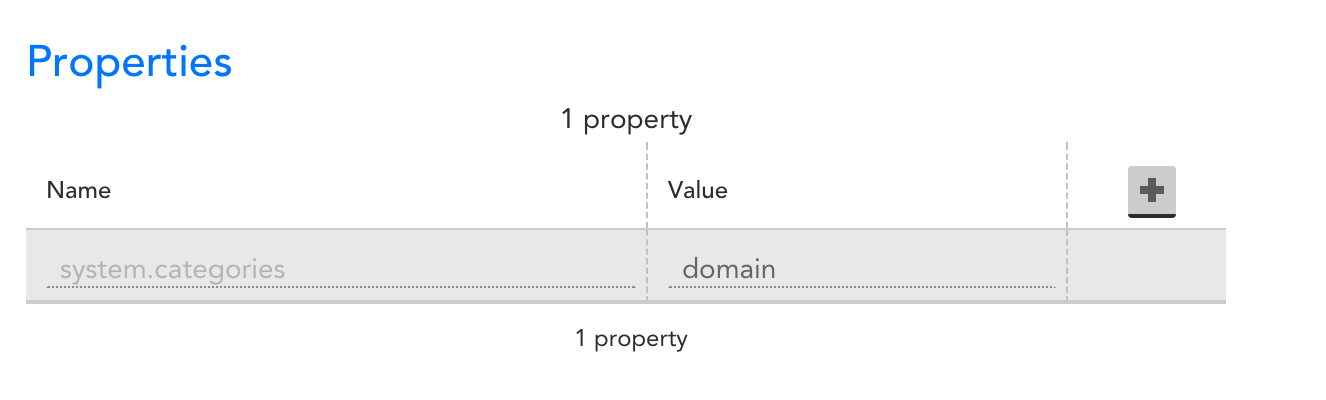
Once you have the datasource imported, you need to associate it with some device, by setting the property system.categories to include the tag “domain”.
We recommend you add a device specifically for domain monitoring (e.g. add a device “yourdomain.com”, and set the system.categories tag on it.)
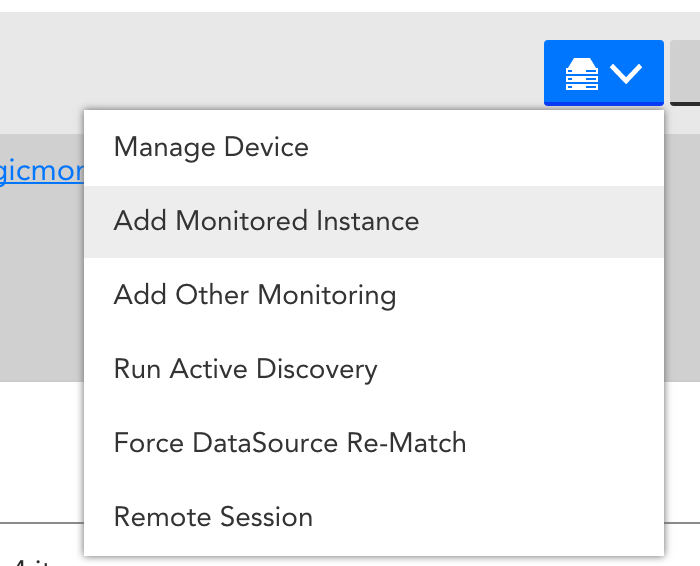
This won’t immediately trigger any monitoring, but will associate the datasource with the device, allowing you to add instances to monitor for domain expiration:
Select “Add monitored instances” from the Manage drop down:
then enter the top level domain that you wish to monitor:
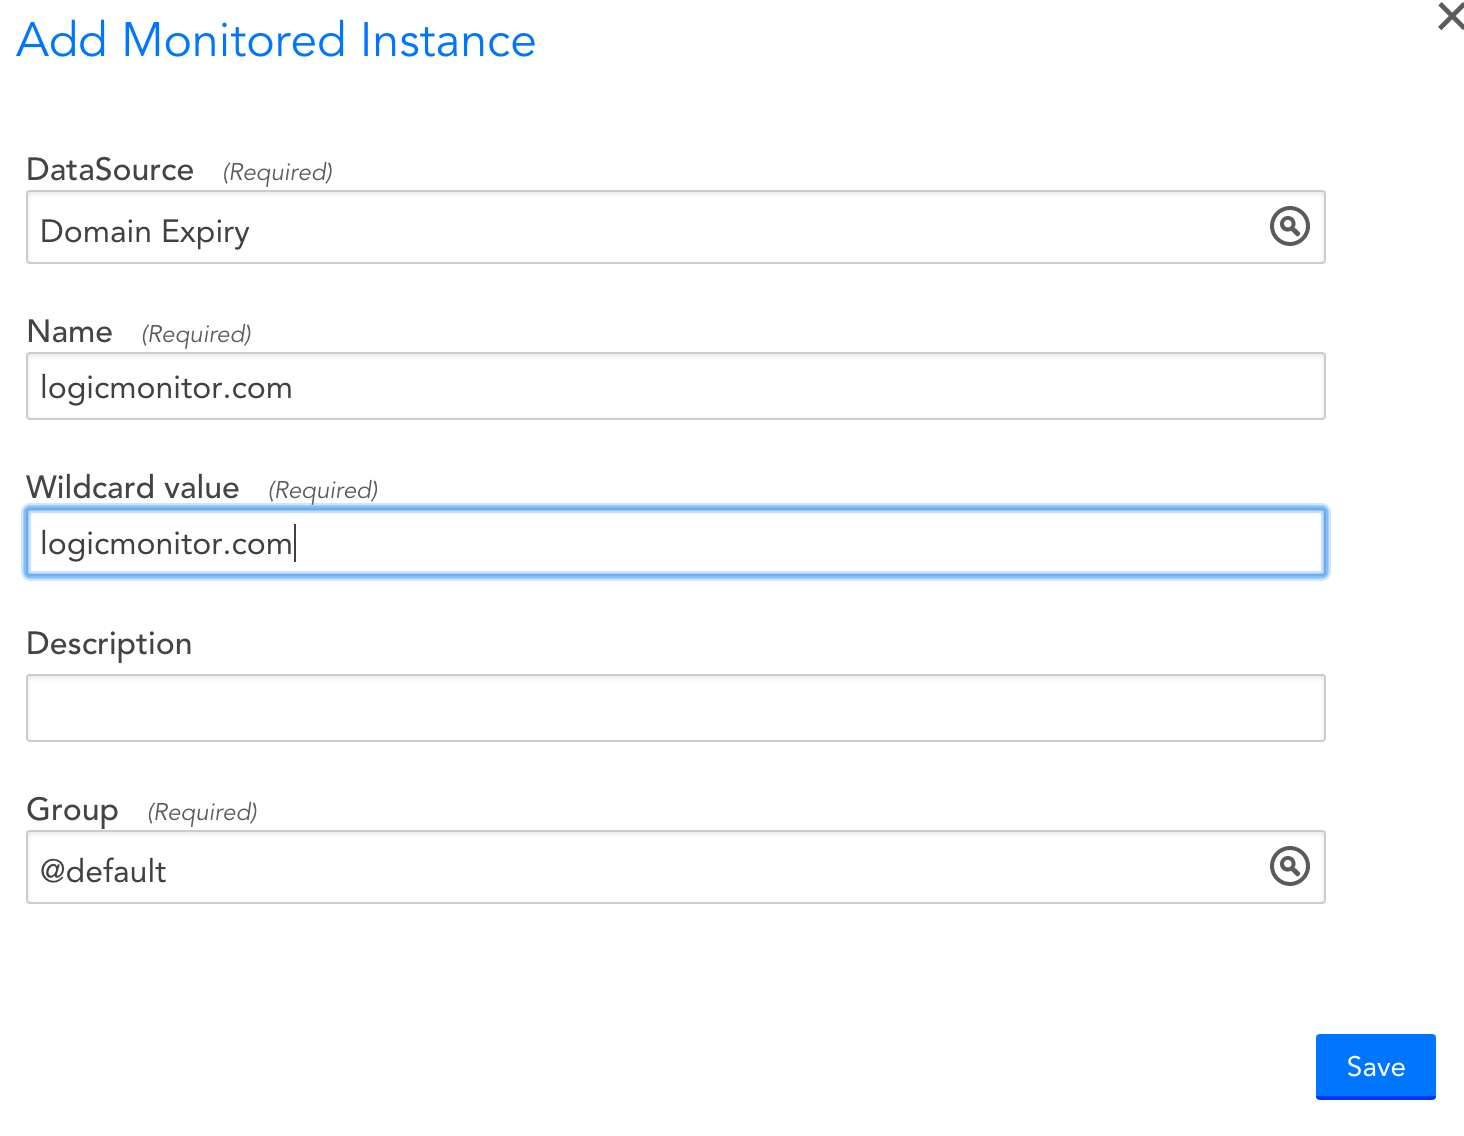
Note: only use the top level domain (like “logicmonitor.com”), not a subdomain (like “logicmonitor.com”)
You’ll now get graphs showing the days until the domain registration expires. In the graph below, you can see Marketo renewed their domain for 7 years:
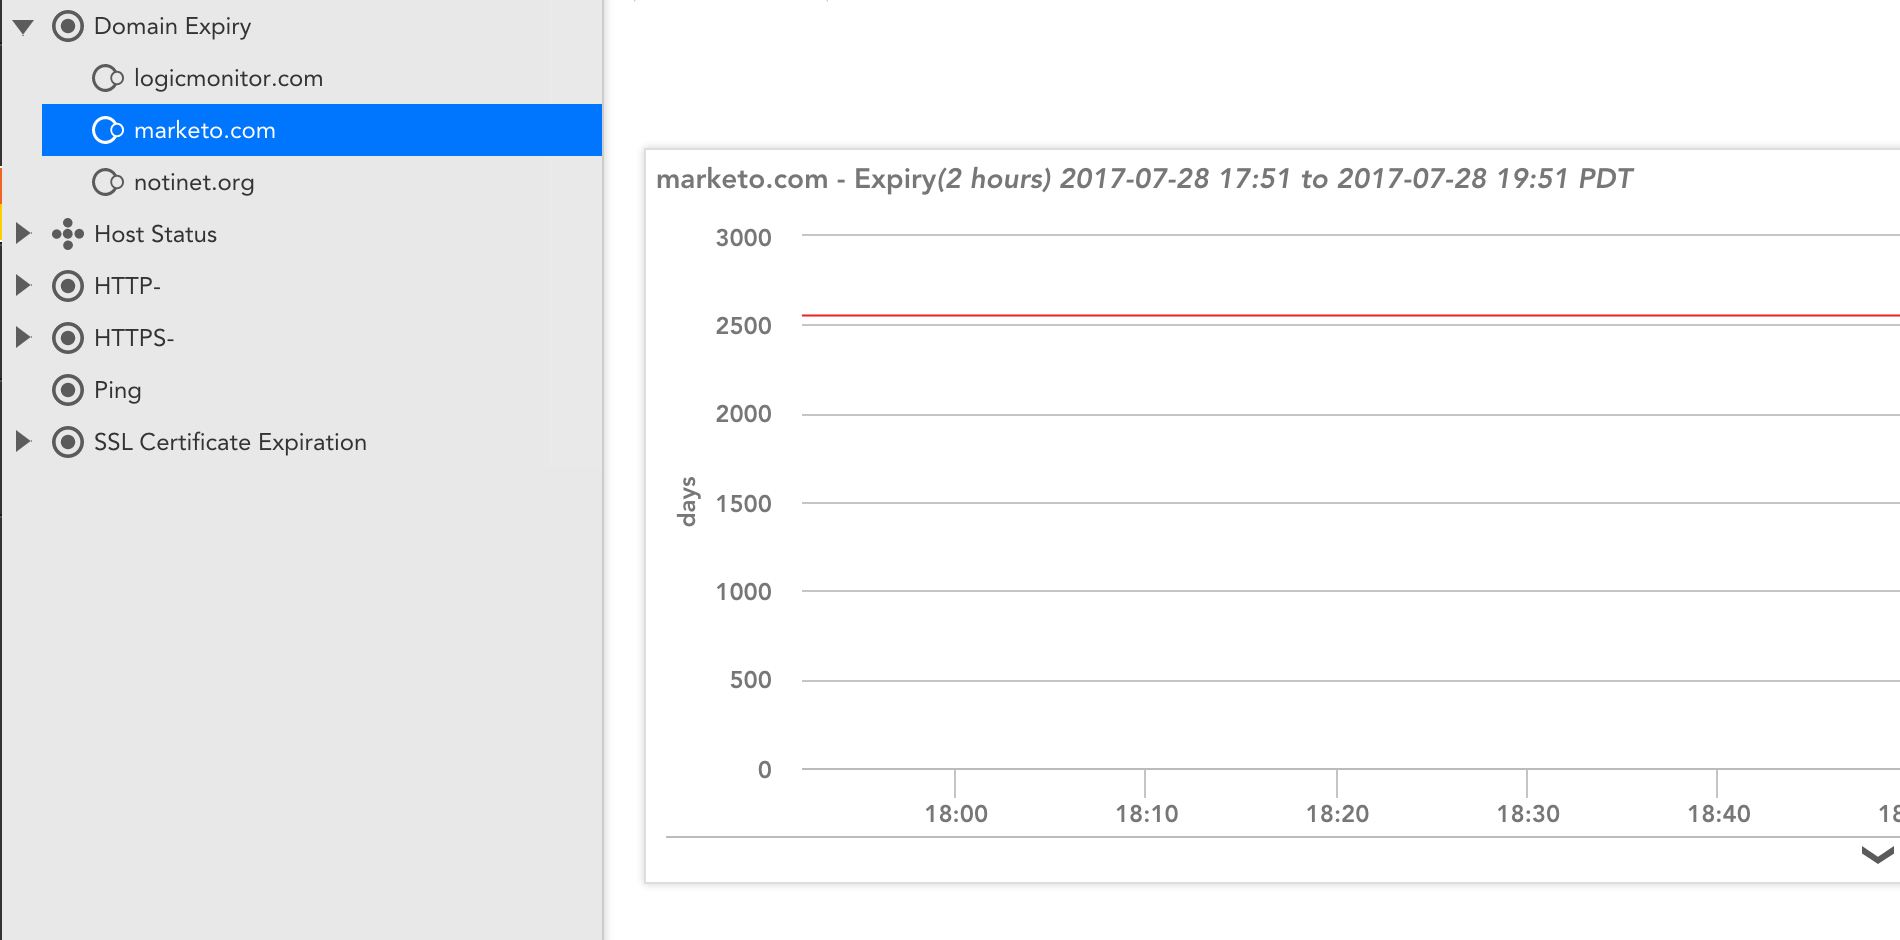
So Marketo is safe from another domain registration failure for awhile – at least for that domain. But we might suggest they look at some flexible SaaS based Enterprise IT Monitoring to ensure the availability of their other domains. And perhaps you should too.
No one likes to talk about outages. They’re horrible to experience as an employee and they take a heavy toll in customer confidence and future revenue. But they do happen. Even publicly traded tech powerhouses, such as eBay and Microsoft, who have more technical resources than you’ll ever have, fall prey to outages. And when they do, they are closed for business, much to the chagrin of their shareholders and executive teams.
It’s not so much a question of whether an outage will occur in your company but when. The secret to surviving them is to get better at handling them and learning from the mistakes of others. Nobody is perfect all the time (my current employer, LogicMonitor, included) but I hope by talking about these mistakes, we can all begin the hard work required to avoid them in the future.
4 Massive Mistakes Companies Make Handling Outages:
- Not having a tried-and-true outage response planDoes this sound familiar?An outage occurs. A barrage of emails is fired to the Tech Ops team from Customer Support. Executives begin demanding updates every five minutes. Tech team members all run to their separate monitoring tools to see what data they can dredge up, often only seeing a part of the problem. Mass confusion ensues as groups point their fingers at each other and Sys Admins are unsure whether to respond to the text from their boss demanding an update or to continue to troubleshoot and apply a possible fix. Marketing (“We’re getting trashed on social media! We need to send a mass email and do a blog post telling people what is happening!”) and Legal (“Don’t admit liability!”) jump in to help craft a public-facing response. Cats begin mating with dogs and the world explodes.
OK, that last part may not happen. But if the rest sounds familiar, your company might be making Mistake #1.
A well-formed process for handling outages must define who is accountable for resolving issues, who is in the escalation path and who is responsible for communicating about issues. It includes a post-mortem process for analyzing the root cause behind the outage and addressing any gaps, which can range from building redundancy into systems to changing monitoring settings so that issues can be caught and resolved before an outage might reoccur in the future. - Lack of communication about the outage with impacted customersIn the heat of trying to get your company back online, it’s easy to “go dark.” Unfortunately, not communicating with customers often causes a host of negative consequences, including a flood of support calls, longer hold times, and poor customer experience, and it can produce a perception that your company is unresponsive, untrustworthy or not in control.The fault often lies in poor or missing lines of communication between customer-facing groups and your Tech Ops team. Not having systems (blogs, forums, mass email, RSS feeds, etc) with which to notify customers of issues can be a big problem. Or companies don’t communicate about the outage based on the mistaken belief that customers might not notice the issue (customers will notice) and that damage will somehow be minimized (lack of communication only makes it worse.)Tip: Ensure you have a defined communication process in place with clearly assigned responsibilities for during and after the outage. Make sure everyone involved is familiar with it. Don’t just store it on your company’s web site, because that may not be accessible during the outage.
- Playing the blame game
Blaming a partner or vendor is a tactic companies sometimes employ in responding to outages. It rarely proves successful, in part, because customers see it as abdicating responsibility for a decision the company ultimately made. (Who chose to depend on that vendor or partner? You did.) By not accepting responsibility, the company is also not taking steps to prevent recurrence of the problem, which is unlikely to be a crowd pleaser. Taking broader responsibility and instituting a review of vendors involved, setting up redundancy or reviewing processes that might have contributed to the issue are all better options. - Not knowing they are having an outage in the first place.The worst way to hear about an outage is to have your customers tell you (or possibly having your boss tell you). Having your monitoring infrastructure in the datacenter being monitored is an excellent way to have outages that you don’t get an alert about – because monitoring is off-line too. Even if your datacenter is Amazon, which is what happened to Loggly during an extended outage a few years ago.The best way: to get an alert from a unified SaaS-based platform like LogicMonitor that tells you if your whole datacenter is down. Your monitoring platform should provide a complete view of websites (including performing synthetic transaction checks), applications, databases, network, servers, virtualization and the Cloud (wherever your IT infrastructure is housed), so that you can proactively fix issues before customer experience is impacted.Below is an example of what an outage looks like in LogicMonitor graphs using SiteMonitor™, which is free with every LogicMonitor account. (Note: eBay is not currently a LogicMonitor customer.)

Improving management of outage incidents can produce better outcomes for your company’s employees, customers and shareholders. It won’t be easy. But it will be worth it. And it all starts with avoiding some basic mistakes that others have made before you.
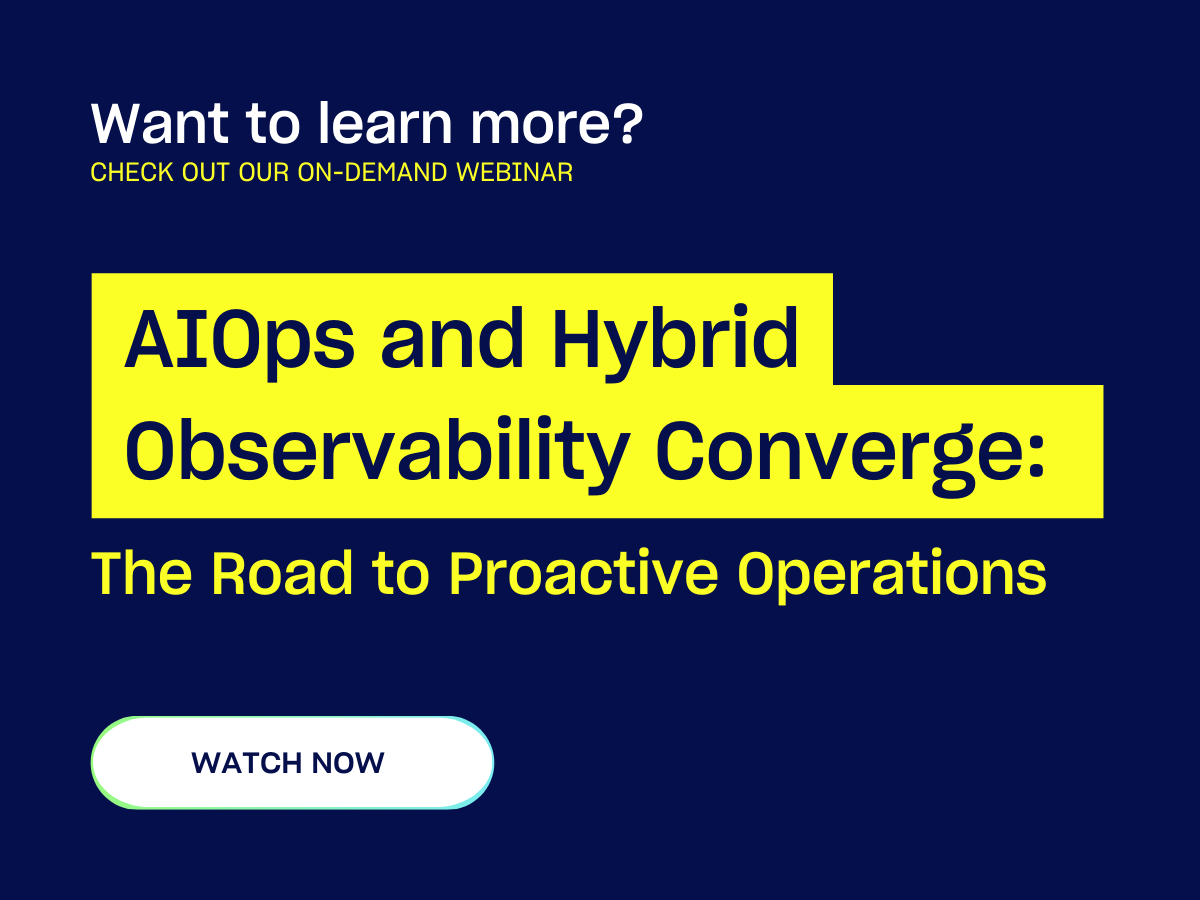
Want more on this topic? Watch the webinar
The Top 10 Mistakes Companies Make Handling Outages and How to Avoid Them All
Did you like this post? Feel free to share or like this post. Enter your comments below.