Multitenancy is one of the core concepts of cloud computing. As organizations continue to move more and more of their tech stacks to the cloud, understanding multitenancy, or how architecture is able to share environments together, is one of the most crucial topics to learn. This article will break down the intricacies of multitenancy, how it stacks up against other tenancy models, and its benefits.
Contents
- What Is Multitenancy?
- Single Tenancy vs. Multitenancy
- Why the Shift to Multitenancy?
- Multitenant Databases
- Access Control for Multitenant Environments
- Benefits of Multitenancy
- The Future of Multitenancy
What Is Multitenancy?
Multitenancy is an architectural pattern that enables multiple users to share one or more application instances at the same time. Each user is referred to as a tenant; this can be an individual user but is more commonly a group of users, such as a customer company. Each tenant’s data is isolated and invisible to other tenants but runs on the same server.
Single Tenancy vs. Multitenancy
Single tenancy involves a single application instance dedicated to a single customer. The difference between single tenancy and multitenancy can be explained in a real-estate format. Single tenancy can be viewed as a customer buying a single house of their own and customizing it to their needs as they see fit. Multitenancy can be likened to an apartment building with several isolated apartments leased out to individual customers, all sharing the same resources.
Generally, multitenant architecture is preferred because it’s significantly more cost-effective compared to single tenancy. While single tenancy was historically able to offer more control of configuration, increased isolation, and associated security, SaaS-based multi-tenant architecture has now outpaced single tenancy with almost all of these advantages as well.
Why the Shift to Multitenancy?
Traditionally, organizations have maintained on-premise servers with single tenancy. As the landscape has shifted naturally much more into the cloud, multitenancy is now the norm most organizations follow. Cloud-based platforms offer more flexibility, savings on hardware maintenance, and access to cloud technologies, becoming the obvious choice for most options.
There are three major types of cloud computing used by businesses: Software as a Service (SaaS), Platform as a Service (PaaS), and Infrastructure as a Service (IaaS).
Of these, SaaS is the most popular among businesses, and because its core architecture is multi-tenant, the shift to multitenancy has been inevitable for most organizations. In addition, in most cases, cloud-based applications require multitenancy.
Multitenant Databases
When choosing a database for multi-tenant applications, there are a few criteria developers must consider, and they include:
- Scalability, involving number of tenants, storage, and workload
- Development and operational complexity
- Tenant isolation
Outlined below are three major approaches to multitenant database patterns, each with varying levels of complexity and cost.

Single Shared Database and Schema
This is the simplest approach in the initial stages of development. Tenants share the same application instance and database, and each tenant has a table in the shared schema. It allows for easier scaling and larger numbers of tenants, but troubleshooting individual tenants can be difficult. Additionally, it provides very low tenant isolation. When the number of tenants increases exponentially, it will become more difficult to operate the database.
Shared Database, Separate Schemas
Here, there is a single database, but one schema per tenant. This approach is valuable when data from different tenants needs to be treated differently, for example, if it goes through different geographical regulations. It’s also more secure than the single schema approach. However, it doesn’t comply with PCI/HIPAA/FedRAMP regulations.
Separate Database, Separate Schemas
In this approach, computing resources and application code are shared among tenants on a single server, but each tenant has their own set of data that remains logically separated from other tenants’ data. It provides the highest level of tenant and data isolation but is also the costliest approach.
Access Control for Multitenant Environments
The difficulties in access control management in multitenancy lie in:
- Controlling different data and application resources
- Providing different tenants with access to the resources
- Designing an access control mechanism with many authorization rules across conflicting policy domains for a large number of users
The most common access control measure applied in multitenancy is Role-Based Access Control (RBAC). RBAC provides fine-grained authorization to users and builds trust among tenants.

Benefits of Multitenancy
There are quite a number of benefits that have made multitenancy the standard among organizations, and they include the following:
- It is highly cost-effective since cost for the multitenancy environment and resources are shared among tenants.
- It’s low-maintenance for tenants, as the duty of server upgrades and maintenance updates usually fall on the SaaS vendor and, because a single server is serving many tenants, updates can be rolled out more easily at once.
- It offers high scalability that is available on-demand for clients. There are also fewer infrastructure implications because new users get access to the same already existing basic software.
- It’s easy to add new tenants to servers, as the process of signing up and configuration of new domains/subdomains is automated, and integrations with other applications are made easier through the use of APIs.
The Future of Multitenancy
Although businesses are constantly looking for ways to capitalize on the benefits of both single tenancy and multitenancy through avenues like multi-cloud tenancy and hybrid tenancy, multitenancy remains at the forefront of cloud computing. It offers organizations boundless opportunities for horizontal expansion and would be the ideal tool for a business looking to move from on-premise servers to cloud services.
The workflow of IT teams is ever-changing. Businesses must adapt quickly and use safeguards to prevent operation interruptions.
An IT business continuity program ensures normal business functions after a disaster or other disruptive event. Given society’s dependence on IT for daily needs, making sure that your IT infrastructure and systems operate without disruption is crucial in the face of disaster. Without a plan in place, companies risk financial losses, reputational damage, and long recovery times.
How confident are you that your IT department can maintain continuous uptime and availability during a crisis with minimal disruptions? This guide will help IT operatives identify those solutions as they begin developing or strengthening their IT business continuity plans.
What is an IT business continuity plan and why is it essential?
An IT business continuity plan (IT BCP) is a specialized strategy that makes sure IT systems, infrastructure, and data remain resilient during and after major disruptions like natural disasters or cyberattacks. Unlike general business continuity plans that address broader areas like supply chain management, an IT BCP focuses on keeping an organization’s technical systems safe, including networks, servers, cloud services, and applications.
A strong IT BCP is able to:
- Protect mission-critical IT infrastructure: Ensure uninterrupted access to key systems that keep business operations running
- Support operational stability: Minimize downtime and maintain productivity during disruptions
- Prevent financial and reputational risks: Reduce the potential for costly downtime, regulatory fines, and damage to customer trust
IT BCPs protect organizations from risks such as:
- Cyberattacks: Ransomware and data breaches can lock users out of IT systems, causing widespread disruptions and expensive recovery processes.
- Natural disasters: Events like hurricanes or earthquakes can damage data centers, making IT systems inaccessible.
- System failures: Aging hardware, software bugs, or misconfigurations can bring operations to a halt.
An IT BCP also ensures regulatory compliance, such as GDPR, HIPAA, and SOX, which have strict continuity measures. Non-compliance can lead to significant penalties and legal challenges.
For example, the 2024 CrowdStrike outage disrupted 8.5 million Windows devices, causing Fortune 500 companies to collectively incur an estimated $5.4 billion in uninsured damages. This highlights the need for a strong IT BCP to protect systems, maintain compliance, and prevent costly incidents.
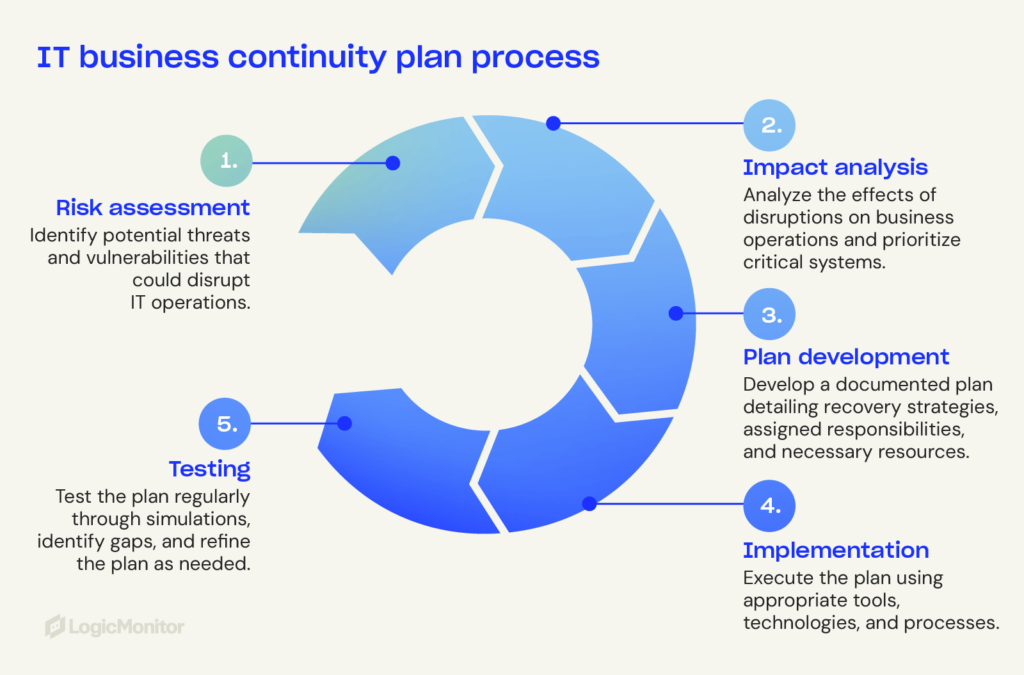
Key IT business continuity plan components
An effective IT BCP focuses on key components that strengthen systems and continue operations during disruptions.
Risk assessment
Audits and risk protocols help organizations anticipate disruptions and allocate resources. Risk assessment identifies vulnerabilities like outdated hardware, weak security, and single points of failure.
Dependency mapping
Dependency mapping identifies relationships between IT systems, applications, and processes. For example, replicating databases is critical if failure disrupts multiple services. Understanding IT interconnections helps organizations identify critical dependencies and blind spots so they can plan recovery procedures.
Backup and disaster recovery
Data backup and recovery are crucial for keeping information safe and quickly resuming operations after a significant disruption. Data recovery best practices include:
- Regular backups: Automate and schedule frequent backups to keep the latest data secure.
- Off-site storage: Use secure cloud solutions or off-site data centers in other locations to prevent data loss in localized disasters.
- Testing recovery plans: Periodically test disaster recovery processes to restore backups quickly and without errors.
Failover systems
Failover systems maintain operations by automatically switching to backups during hardware or software failures. Examples of failover systems include:
- Additional servers or storage systems for critical applications
- Secondary internet connections for minimal disruptions during outages
- Load balancers to distribute traffic evenly so there’s no single point of failure
Communication plans
Effective communication allows organizations to respond to an IT crisis. Strong IT BCPs include:
- Crisis roles: Assign clear responsibilities to team members during disruptions.
- Stakeholder communication: Prepare email templates, internal communication playbooks, and chat channels to quickly inform stakeholders, customers, and employees.
- Incident reporting tools: For real-time updates and task tracking, use centralized platforms like Slack, Microsoft Teams, or ServiceNow.
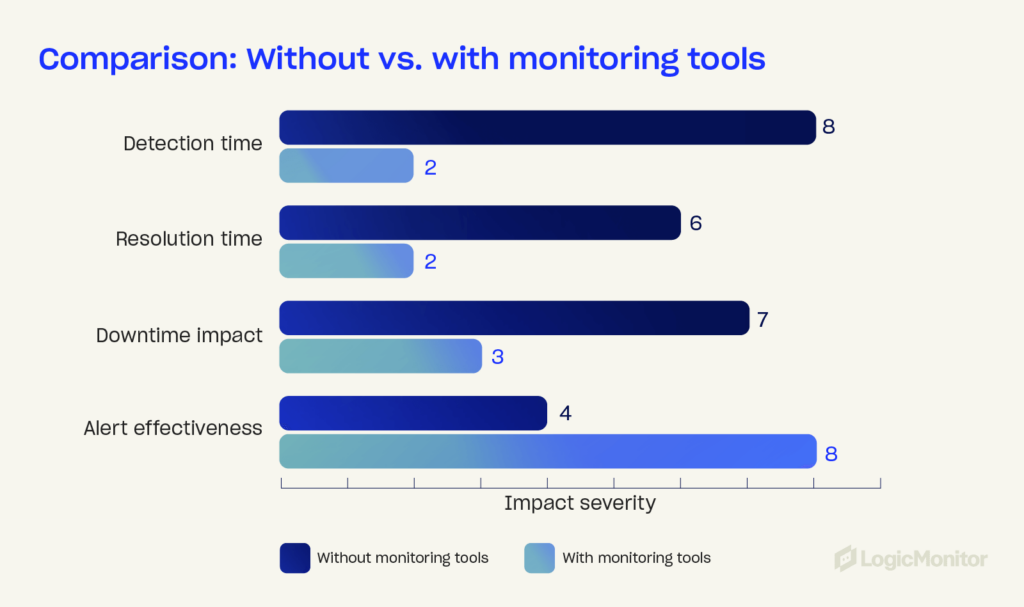
Continuous monitoring and testing
Tools that provide real-time insights and proactive alerts on system performance will find potential disruptions before they escalate. Routine simulation drills prepare employees for worst-case scenarios.
Cybersecurity measures
The rise in cyberattacks makes strong cybersecurity key to an IT BCP. Multi-factor authentication, firewalls, and endpoint protections guard systems against breaches, while incident response plans minimize attack damage.
Steps to develop an IT business continuity plan
Protect critical systems and ensure fast disruption recovery with these steps.
1. Assess risks and conduct a business impact analysis
Conduct a business impact analysis (BIA) to evaluate how potential IT risks can affect your operations, finances, and reputation. Key BIA activities include:
- Identifying single points of failure in systems or networks
- Evaluating the impact of downtime on various business functions
- Quantifying the costs of outages to justify investments in continuity plans
Example: A financial services firm simulates a Distributed Denial-of-Service (DDoS) attack on its customer portal and identifies that its firewall rules need adjustment to prevent prolonged outages.
2. Define critical IT assets and prioritize systems
Not all IT systems and assets are equally important. Identify and prioritize systems that are vital in maintaining key business operations, including:
- Core infrastructure components like servers, cloud platforms, and networks
- Applications that support customer transactions or internal workflows
- Databases that hold sensitive or important operational information
Example: A retail company classifies its payment processing systems as a Tier 1 priority, ensuring that redundant servers and cloud-based failovers are always operational.
3. Develop a recovery strategy
Establish clear recovery time objectives (RTO) and recovery point objectives (RPO) to guide your strategy:
- RTO: Defines the maximum acceptable downtime for restoring systems or services
- RPO: Specifies the acceptable amount of data loss measured in seconds, minutes, or hours
Example: A healthcare provider sets an RTO of 15 minutes for its electronic medical records system and configures AWS cross-region replication for failover.
4. Obtain necessary tools
Equip your organization with tools that support continuity and recovery efforts, including:
- Monitoring platforms: Provide real-time insights into system health and performance
- Data backup solutions: Ensure secure storage and rapid data restoration
- Failover mechanisms: Automate transitions to backup systems during outages
- Communication tools: Facilitate seamless crisis coordination across teams
Example: A logistics company integrates Prometheus monitoring with an auto-remediation tool that reboots faulty servers when CPU spikes exceed a threshold.
Hypothetical case study: IT BCP in action
Scenario
An e-commerce company faces a ransomware attack that encrypts critical customer data.
Pre-BCP implementation challenges
- Single data center with no geo-redundancy.
- No air-gapped or immutable backups, making ransomware recovery difficult.
- No automated failover system, leading to prolonged downtime.
Post-BCP implementation
- Risk Assessment: The company identifies ransomware as a high-priority risk.
- System Prioritization: Customer databases and payment gateways are flagged as mission-critical.
Recovery strategy
- Immutable backups stored in AWS Glacier with multi-factor authentication.
- Cloud-based disaster recovery ensures failover to a secondary data center.
Monitoring and response
- AI-based anomaly detection alerts IT teams about unusual encryption activities.
- Automated playbooks in ServiceNow isolate infected systems within 10 seconds of detection.
Outcome
The company recovers operations within 30 minutes, preventing major revenue loss and reputational damage.
IT business continuity tools and technologies
Building an effective IT BCP requires advanced tools and technologies that ensure stability.
Monitoring systems
Modern infrastructure monitoring platforms are vital for detecting and eliminating disruptions. Tools such as AIOps-powered solutions offer:
- Real-time insights into system performance, helping teams to identify and resolve issues quickly
- Root-cause analysis (RCA) to determine why harmful events occur, improving response times
- Anomaly detection to catch irregular activities or performance bottlenecks and correct them
Cloud-based backup and disaster recovery
Cloud solutions offer flexibility and scalability for IT continuity planning. Key benefits include:
- Secure data backups: Backups stored in other geographic locations protect against localized disasters.
- Rapid disaster recovery: Multi-cloud strategies can restore systems quickly.
- Remote accessibility: Employees and IT teams can access critical resources anywhere, speeding up recovery times.
Failover and resource scaling automation tools
Automation streamlines recovery processes and ensures IT infrastructure stays agile during crises. Examples include:
- Automated failover systems: Switch operations to backup servers or connections during outages.
- Resource scaling: Adjust server capacity and network bandwidth to meet changing demands.
- Load balancing: Distribute traffic to prevent overloading and single points of failure.
Cybersecurity solutions to protect IT systems
Robust cybersecurity is essential to IT continuity. Protect your systems with:
- Multi-factor authentication (MFA) to secure user access
- Firewalls and endpoint protection to defend against threats
- Incident response plans to minimize the impact of breaches or ransomware attacks
Common IT business continuity planning challenges
Even well-designed IT BCPs face obstacles. Understanding these common pitfalls will help you proactively address vulnerabilities and maintain operational strength.
Lack of testing and updates
Outdated or untested IT BCPs risk gaps or ineffective processes during a crisis. Regular updates will help you adapt to threats.
Third-party dependencies
Modern IT systems rely heavily on external services like cloud providers, data centers, and software vendors. Failing to account for these dependencies can lead to significant disruptions during third-party outages or delays.
Human error
Even the most advanced IT systems require human intervention during a crisis. Human factors, such as unclear communication protocols and insufficient training, can compromise the execution of an IT BCP. Strategies for reducing human error include:
- Training and refreshers: Make sure employees are familiar with their responsibilities in your IT BCP during a crisis. Include role-specific training and regular simulations to reinforce their knowledge.
- Documentation: Develop quick-reference guides and checklists for team members to easily access during an incident.
- Communication protocols: Establish clear communication channels and use tools like incident response platforms to provide real-time updates and coordinate teams.
- Post-incident reviews: After each drill or real-world incident, evaluate team performance and identify areas for improvement.
Budget constraints
Financial limitations can keep organizations from creating effective continuity measures, like failover systems, backup solutions, or regular testing protocols. To address budget constraints:
- Invest in critical areas with the highest potential impact
- Explore cost-effective solutions, like open-source tools or scalable cloud platforms
- Quantify potential losses resulting from downtime
Complex multi-cloud and hybrid environments
As organizations adopt hybrid and multi-cloud systems, uninterrupted operations become a challenge. Issues like inconsistent configurations and siloed data can prolong disruptions and slow recovery. Regular audits, dependency mapping, and unified monitoring tools simplify crisis management and strengthen continuity.
Lack of executive buy-in
Without support from leadership, BCP efforts can lack funding, strategic alignment, or organizational priority. Secure executive support by:
- Demonstrating the ROI of continuity planning
- Presenting real-world examples of downtime costs and successful recoveries
- Highlighting compliance obligations
Best practices for maintaining IT business continuity
A strong IT BCP requires ongoing effort to remain effective against evolving threats. These practices ensure your plan stays effective during any crisis.
Test and refine
Regular tests can identify weaknesses in your IT BCP. Continuously improve processes to align with your current infrastructure and objectives. Testing methods include:
- Tabletop exercises: Simulate hypothetical scenarios to review decision-making and coordination
- Live drills: Engage teams in real-time responses to assess readiness and identify bottlenecks
- Post-test reviews: Use results to refine workflows and address gaps
Train staff on their crisis roles
Regular training with clear responsibilities ensures team members understand their duties and can act quickly during disruptions.
- Provide training for IT, operations, and leadership teams
- Develop playbooks or quick-reference guides for crisis scenarios
- Regularly update and refresh knowledge to account for staff turnover
Use RTO and RPO metrics to measure success
Set measurable goals to evaluate your strategy’s effectiveness. Track performance against these benchmarks to ensure your plan meets its objectives:
- Recovery Time Objective (RTO): Define how quickly IT systems must be restored after a disruption to minimize downtime.
- Recovery Point Objective (RPO): Specify the maximum acceptable data loss, measured in time, to guide backup frequency.
Collaborate with cross-functional teams
An effective IT BCP must align with organizational goals. By working with teams across departments, you can:
- Ensure all relevant teams understand your IT BCP
- Identify dependencies between IT systems and other functions
- Develop response strategies that integrate with company-wide plans
Leverage technology to automate processes
Automation enhances the speed and efficiency of IT continuity efforts. Tools like monitoring platforms, automated failover systems, and AI-driven analytics reduce manual workloads and allow proactive problem-solving.
Continuously monitor and assess risks
The threat landscape is constantly evolving. Regular risk assessments and real-time monitoring help identify emerging weaknesses before they escalate into major problems.
Emerging Trends in IT Business Continuity Planning
Key trends shaping IT BCP include:
1. AI and Machine Learning
- Predictive Analytics: Identifies potential failures before they occur.
- Automated Incident Response: Triggers failovers and restores backups autonomously.
- AI-Based Risk Assessments: Continuously refines risk models.
2. Cloud-Native Solutions
- Scalability & Redundancy: Cloud solutions offer flexibility and geographic backups.
- Faster Recovery: Minimized downtime with rapid disaster recovery.
3. Compliance and Regulations
Stricter standards like GDPR, CCPA, and supply chain mandates require robust continuity plans.
4. Zero Trust Architecture
Emphasizes restricted access, continuous authentication, and network segmentation to combat cyber threats.
5. Automated Disaster Recovery
- Self-Healing Systems: Auto-reconfigures after failures.
- Blockchain: Ensures data integrity.
- AI Compliance Monitoring: Tracks and reports in real time.
Final thoughts: Strengthening IT resilience
An effective IT BCP is a strategic investment in your organization’s future. Identifying weaknesses, prioritizing critical systems, and using proactive measures reduce risks and maintain operations during disruptions.
Continuity planning isn’t a one-time task, however. As challenges like cyberattacks, regulatory changes, and shifting business needs evolve, an effective plan must adapt. Regular updates, testing, and cross-functional collaboration ensure your plan grows with your organization.
Ultimately, an effective IT BCP supports business success by protecting revenue, maintaining customer trust, and enabling operational stability. Taking these steps will prepare your organization to navigate future challenges confidently.
If you’re working with Kubernetes and the thought of searching for each new term you come across seems exhausting, you’ve come to the right place! This glossary is a comprehensive list of Kubernetes terminology in alphabetical order.
Jump to:
A | C | D | E | F |G | H | I | J | K | L | M | N | O | P | Q | R | S | T | U | V | W
Admission controller – A security feature native to Kubernetes that allows users to configure the objects allowed on a cluster. Admission controllers regulate how each cluster gets used. An admission controller quickly checks each request with the Kubernetes server prior to letting any objects run.
Affinity – A set of rules hinting at the placement of pods. There are two types:
- Node
- Pod-to-pod
Depending on how strict a scheduler must perform, these rules can be either preferred or required.
Aggregation Layer – an aggregation layer lets you extend Kubernetes with other APIs in addition to what’s available in basic Kubernetes APIs. You can use APIs that are tailored and ready-made, like service-catalog, or you can use APIs you’ve developed yourself.
AKS – Azure Kubernetes Service (AKS) is an open-source, fully managed container planning service that debuted in 2018. AKS is offered in the public Microsoft Azure cloud and can be used for deployment, scaling, and management of Docker containers and other containerized apps working in clusters. For all resources, AKS provides as required or on-demand:
- Provisioning
- Scaling
- Upgrading
You’ll see no cluster downtime and you don’t need a deep understanding of container organization to work with AKS.
Amazon EKS (EKS) – Amazon’s Elastic Kubernetes Service, or EKS, lets you run Kubernetes on Amazon Web Service (AWS) without the need for installation, operation, or maintenance of your own control plane/nodes.
Annotation – A value assigned to the metadata of an object.
API group – A group of related paths within the Kubernetes API.
API server – Part of the control plane that reveals the Kubernetes API. The front end of the control plane. This lightweight application allows you to create and extract API data from other data without needing customized development procedures.
Applications – The layer where containerized apps run. Applications are containerized solutions.
cgroup – container group – A group of processes native to Linux that have optional isolation of resources, accounting, and/or limits. A kernel feature limiting, accounting for, or isolating resource use for a specific set of processes. cgroups let you allocate various resources such as:
- System memory
- Bandwidth
- CPU time
- A combination of the above
cgroups also let you allocate these resources amongst any task groups or processes running within the system that have been user-defined. You can also:
- Monitor any cgroups you’ve configured.
- Deny certain resource access to specific cgroups.
- Dynamically reconfigure specific cgroups.
CIDR – Classless Inter-Domain Routing (CIDR) is a mask for IP addresses. Also referred to as supernetting, CIDR assigns IP addresses to improve address distribution efficiency, replacing the earlier system that was based on Class A, B, and C networks.
Cloud-controller manager – A cloud controller is a storage tool that moves data from a physical, on-premises storage location to a cloud location. Cloud controllers use either hard drives, SSDs, or a combination for on-premises storage. The cloud-controller manager is a control plane element that allows you to embed specific control logic into the cloud. This tool is structured with a plugin allowing various cloud service providers to integrate, or link up with, Kubernetes.
Cluster – Kubernetes clusters are sets of node machines that run containerized apps. In other words, if you’re using Kubernetes, you’re using clusters. At the bare minimum, clusters contain the control plane and at least one computing machine, or node. The nodes are responsible for running the apps and workloads.
ConfigMap – A dictionary of your configuration settings. A ConfigMap has strings of key-value pairs. The key-value pairs act as instructions that Kubernetes then provides to your containers. Like other Kubernetes dictionaries, you can see and set the value of the configuration. You can use ConfigMap to keep the application code separate from the configuration. It’s a crucial aspect of 12-factor apps used in creating software-as-a-service applications.
Container – Lightweight, executable image containing software and its dependencies. Containers are software packages that come ready to use. Everything needed to run an app is located in the container, such as:
- The code
- Runtime
- App libraries
- System libraries
- Default values for vital settings
Containerd – Concept of kernel features providing relatively high-level interfaces. Other software can use containerd for running and managing containers and images.
Container environment variables – “Name equals value” pairs that offer insight into the containers that run within a pod. Container environment variables provide application-specific, required information to each container about such resources as:
- System details
- Container information
- Service endpoints
Container network interface (CNI) – a project by the Cloud Native Computing Foundation, a CNI is comprised of libraries and specifications regarding the writing of plugins that configure the network interfaces within Linux containers. In Kubernetes, CNI acts as the interface between a network provider and networking pods.
Container runtime – The software that’s responsible for running the containers. This software executes each container and manages it on a node. Container runtime interface, or CRI, lets Kubernetes use several types of container runtimes without having to recompile. Theoretically, Kubernetes can use any given container runtime that uses CRI to manage its pods, containers, and images.
Container runtime interface (CRI) – A container runtime API that joins with kubelet on a node.
Container storage interface (CSI) – Offers a standardized interface between containers and storage systems, enabling customized storage plugins to cooperate with Kubernetes without the need to add each storage system to the Kubernetes repository.
Control plane – The layer in which container deployment, definition, and management occur. Some of the components of the control plane include etcd, Scheduler, and Controller Manager.
Controller – Loops that oversee the cluster’s state, making and requesting changes as necessary to move the cluster’s current state closer to the cluster’s most desired state. Some controller’s loops may run within the control plane if they are necessary for operations. For instance, the namespace controller runs inside kube-controller-manager.
CRI-O – CRI-O is an operation in Kubernetes’ container runtime interface (CRI) that lets you enable compatible runtimes that use Open Container Initiative, or OCI. If Docker, Moby, and rkt aren’t as lightweight as you need, CRI-O is a good alternative. It lets you use any runtime as the Kubernetes runtime to run pods. It also supports runc and other container runtimes that are OCI-compliant. CRIO sustains any OCI image and it can draw from all container registries as directed.
Custom controller – In some instances, Kubernetes’ core controllers may not provide the necessary control. A custom controller allows the user to extend Kubernetes core functionalities without having to change core code.
CustomResourceDefinition (CRD) – The customized code for a custom controller, used when the Kubernetes core controllers don’t provide the necessary functionality.
DaemonSet – The system’s daemons (log collectors, monitoring agents, etc.) usually must run on each node. A DaemonSet makes sure a Pod copy is functional across a group of nodes within a cluster.
Data plane – The layer that holds such working aspects as the CPU, memory, and storage for the containers to run. The data plane helps containers connect to a specific network.
Deployment – An API resource object providing updates to various applications. The deployment manages pod scheduling, management, updates, rollbacks, horizontal scaling, and lifecycles.
Device plugin – Run on nodes providing pods access to various resources. Specific setups or initializations for vendor-specific applications use device plugins to operate. A device plugin can be deployed as a DaemonSet or installed directly on each necessary node.
Disruption – An event that causes a pod (or multiple pods) to go out of service. This can have negative consequences on deployment and other resources necessary for workloads as it affects the pods required.
Docker – The software technology, Docker, or Docker Engine, provides virtualization at the operating system level in the form of containers.
Dockershim – a legacy term that is allows a Kubelet to communicate with Docker. Dockershim was removed from Kubernetes as of v.1.24.
Dynamic volume provisioning – Using the StorageClass API object, users can automatically provision storage volumes rather than needing pre-provisioned volumes. You can create storage volumes on-demand with dynamic volume provisioning. Without this tool, a cluster administrator must manually call the cloud to create a new storage volume, afterward creating PersistentVolume objects that represent those calls in Kubernetes. Dynamic provisioning eliminates pre-provisioning requirements. It simply provisions storage automatically as requested.
Endpoints – Endpoints are objects to which individual pod IP addresses are assigned. The endpoint’s object is then referenced by Kubernetes so there’s a record of all internal IP addresses for all pods so that communication can occur.
Endpoint slice – Released with Kubernetes Version 1.16. Endpoint slicing lets you group endpoints within the group using Kubernetes resources. The endpoint houses all pods matching a specific service. If there are hundreds of pods within a service and you make any changes, endpoint objects can become large. Prior to the release of endpoint slicing, every change made altered every object, passing that change to all nodes within the cluster, which caused critical performance and stability issues. Endpoint slicing lets you group similar endpoints, therefore no disruptions occur when changing multiple endpoints.
Ephemeral container – A type of container that can be run temporarily within a pod. If a pod shows signs of an issue, running an ephemeral container allows the user to diagnose the problem without affecting the entire workload. An important note is that this type of container has no resource or schedule guarantee and should not be used to run the actual workload.
Etcd – A storage configuration management tool, etcd is crucial to Kubernetes execution. It must always be consistent and available so services are scheduled and operate properly. Etcd data is critical, so having a cluster backup is highly recommended.
Event – a report of an event within a cluster normally showing a chance in a system’s state. Events have a limited retention time and K8s events should be used as supplemental data only.
Extensions – Software elements that “extend”, deeply integrating with the Kubernetes platform in support of new hardware types. Cluster admins can install one or more extensions rather than authoring a brand-new instance.
Finalizer – A key used to inform Kubernetes to wait to delete a specific marked resource until specific conditions are met. Finalizers can be used to clean up resources or infrastructure during the garbage collection process.
Garbage Collection – Garbage collection is used across multiple technologies. For Kubernetes it entails cleaning up resources, including unused containers, pods, completed jobs, and resources that have failed, amongst others.
Google Kubernetes Engine (GKE) – GKE offers a managed environment to deploy, manage, and scale containerized apps using Google’s infrastructure. This environment has several machines, such as Compute Engine that, grouped together, form a cluster.
Helm Chart – Helm Charts are YAML manifests that are combined into one package that can be presented to Kubernetes clusters. After packaging, placing a Helm Chart within your cluster is as simple as executing a helm install. The purpose of a Helm Chart is to simplify the deployment of any containerized apps. Read more about Helm.
Horizontal pod autoscaler – Also known as HPA, a horizontal pod autoscaler automatically scales the number of replica pods. Rather than using CPU power or memory thresholds to control the amount of replicated pods, the autoscaler does so. HPA can also be set for custom thresholds.
Host aliases – If a pod host file is specified, this optional mapping can be input into the host file. It is an optional map between an IP address and a hostname. Host aliases will only work in an non-host network pod.
Image – A stored container instance holding a software set that’s required for an application to run. An image is a packaging method for software allowing it to be stored in the container’s registry, sourced by a local system, and executed as an application. Metadata offers information regarding what to run, who built the application, and other information.
Ingress – This API object exposes both secure and non-secure routes (HTTPS and HTTP, respectively) beginning outside a cluster to the services running inside the cluster. An ingress provides external access to internal services. Types of ingresses include single service and load balancing, among others.
Init container – An initialization, or init container is comparable to a regular container, but an init container must run through to completion prior to another container having the ability to start. An init container must run in sequence with all other init containers before the next container may begin.
Istio – Istio, a service mesh, is a modern networking layer for transparent, language-independent automation applications for network functions. This service mesh sustains microservice communications and allows for data sharing.
Job – A Kubernetes Job object is a basic function or instruction for pod creation and termination. As Jobs are created, a Job controller then creates the pods necessary and makes sure pods are terminated successfully. As each pod terminates, the Job controller tracks the number of successfully completed pod tasks.
Kubeadm – This tool helps you dictate to Kubernetes that kubeadm init and kubeadm join are the best pathways to create Kubernetes clusters. Kubeadm takes care of the necessary actions to get a viable cluster working. Kubeadm was designed to only care about bootstrapping, not machine provisioning.
Kube-controller-manager – A component of the Control Plane running controller processes. To ease complexities, each process is rolled into one binary and run as one.
kube-apiserver – See API server.
kubectl – Command line tool that creates, inspects, updates, and deletes objects by communicating with the Kubernetes API server.
Kube-scheduler – One of the components of the Control Plane responsible for cluster management. Kube-scheduler looks for pods that have yet to be scheduled, assigning them to nodes by certain specifications, such as resource availability. As pods are assigned to nodes, each node’s kubelet gets triggered, creating the pod and its containers.
Kubelet – A mini application running on every node within a cluster. It requires a set of instructions, or PodSpecs, and uses these specifications to ensure each container is working properly. Kubelets execute the actions sent to each container from the master node.
kube-proxy – This is the network proxy for Kubernetes. This service runs on each node, handling request forwarding. kube-proxy’s main role is creating rules for iptables. Pods don’t have the same IP addresses, but with kube-proxy, the user can connect to any specific pod in Kubernetes. This is especially crucial for such actions as loan balancing enablement.
Kubernetes API – The app serving Kubernetes functionality. It operates in a RESTful interface, storing the cluster state. In other words, all Kubernetes resources and intent records get stored as objects and then modified according to RESTful orders to the API. The Kubernetes API lets the user declare management configuration. The user can interact with the API directly or with a tool such as kubectl. The Kubernetes API’s core is flexible and allows for extension into custom resources.
Kubernetes Operations (Kops) – Kops is a fast, easy, open-source method of setting up clusters. Technically, it’s the “kubectl” cluster setup method. Kops lets you deploy available clusters on Amazon Web Service (AWS) and Google clouds (GCP).
Label – Assigns meaningful, relevant identifying attributes to objects. Labels organize objects and select subsets.
Limit range – Assigned within namespace, the limit range allows resource consumption of containers and pods to be constrained, or limited. If only a certain number of object types are needed, limit range limits the number of resources that a container or pod within the namespace can request or consume.
Load Balancing – Load balancing is the process of distributing traffic across multiple servers to prevent specific servers from overloading.
Logging – The recording of events within a cluster or application. System and app logs help the user understand what happens within a cluster. Logs are especially useful in monitoring activity within clusters and debugging problems.
Manifest – A plan for the desired state of a specific object. When the user applies the manifest, Kubernetes maintains that desired object state. Every configuration file can hold several manifests. A manifest in Kubernetes illustrates all resources, you wish to create, such as:
- Deployments
- Services
- Pods
The manifest also lets you dictate how those resources should run within a cluster.
Master node – As the name suggests, this node holds Kubernetes objects in control of the cluster, its data on cluster state, and its configuration. Kubernetes objects in the Master Node include etcd, kube-controller-manager, kube-apiserver, kube-scheduler, and cloud-controller manager.
minikube – Allows users to run Kubernetes locally. A single-node cluster within a virtual memory file on the user’s computer. minikube allows you to run a cluster with just one node on your own PC, whether you’re running, Windows, macOS, or Linux. minikube is perfect for users and developers who simply want to take Kubernetes for a spin or to perform daily developmental work.
Mirror pod – An object used by a kubelet that represents a static pod. If kubelet finds static pods within the configuration, it attempts to create a pod object for it in the Kubernetes API server. The user will be able to see the pod on the API server but will not be able to control it there.
Name – A user-provided string referring to a specific object within a URL. No two objects of the same type can have the same name at the same time. If the user deletes the object, however, a new object using that name can be created.
Namespace – An abstract placeholder name Kubernetes uses to support several virtual clusters atop the same physical cluster. This helps organize cluster objects and lets the user divide that cluster’s resources. Resource names must be unique within a specific namespace in a cluster but can be used in other namespaces.
Network policy – Kubernetes pods have the ability to communicate with other pods and get traffic and information from other sources by default. This Kubernetes resource indicates how groups of pods can communicate with other pods and network endpoints. With the use of labels, pods are chosen and allowable traffic configured.
Node – A worker machine. Nodes can be either virtual or physical, depending on the individual cluster. Nodes have local daemons needed to run the pods. Nodes are managed on the Control Plane. Daemons on nodes include:
- kubelet
- kube-proxy
- Container runtime
Node Pressure Eviction – If a node appears to be failing, node-pressure eviction lets the kubelet terminate pods beforehand so as to reclaim needed node resources. If a workload resource, like StatefulSet, Deployment, or others) manages your pods and checks for pods that need replacing, your control plane (or kube controller manager) will create a new pod for each evicted pod.
Object – A system entity. The entities represent the cluster’s state. Objects are records of intent. Once a user creates an object, the Control Plane ensures the existence of the actual item the object represents. Objects represent to the system what your cluster’s workload should look like or the desired state of the cluster.
Persistent Volume (PV) – A cluster storage resource. Kubernetes doesn’t only manage containers that run an app; it also manages cluster application data. Persistent Volume (PV) abstracts data storage from existing storage infrastructure and can actually outlive the pod itself. Due to this feature, PV can create stateful pods.
Persistent volume claim (PVC) – A request for storage access. PVCs get mounted within a container and specify the storage amount required, how it can be accessed, and how to reclaim the resource.
Pod – The smallest object in Kubernetes representing a set of containers running on a cluster. Typically, a pod runs one primary container, but sidecar containers can also be added for additional features, such as logging. These objects are usually managed by a deployment.
Pod disruption – Pod disruption occurs in one of two ways:
- A user or controller destroys a pod
- There’s been an inevitable hardware, software, or system error
The inevitable, or unavoidable, types of pod disruption are called involuntary disruptions. A few examples of involuntary disruptions include:
- Hardware failure within the actual, physical machine that backs the node.
- A cluster administrator accidentally deletes an instance.
- A failure at the cloud provider occurs.
- A panicked kernel.
- A cluster network partition causes a node to disappear.
- A node runs out of resources and evicts a pod.
Aside from the last example, most users are probably familiar with the other examples. They do not occur only in Kubernetes.
Other disruptions are known as voluntary, and they include actions that can be started by an app’s owner and those started by a cluster admin. Some typical voluntary disruptions include:
- Deleting a deployment or another controller managing the pod.
- Updating the template for a deployment pod, which causes a restart.
- Simply deleting a pod.
Pod disruption budget (PDB) – Lets the user configure how many disruptions a class of pods can tolerate so there is always the correct number available even if a disruption event occurs. When a pod disruption causes a cluster to drop below budget, the operation gets paused till the budget is maintained.
Pod lifecycle – A pod has five distinct phases:
- Pending
- Running
- Succeeded
- Failed
- Unknown
The lifecycle of a pod is the order of these states throughout the pod’s existence.
Pod phase – A high-level summation of the point at which a pod is in its lifecycle. The five potential pod phases defined are:
- Pending: Accepted but waiting for the requisite amount of container images.
- Running: All containers are created, and the pod is attached to a node. One container at minimum is running, working toward starting, or is restarting.
- Succeeded: Each container within the pod has terminated successfully and will not restart.
- Failed: Each container within the pod has terminated, but one or more failed. Exits in non-zero status or system termination.
- Unknown: Pod state cannot be determined. Usually a failure to communicate with the host pod.
Pod priority – In production loads, some pods have a higher level of importance. Pod priority allows a user to give certain pods preference over others with less importance.
Pod preset – An API object that allows the user to put information in pods at the time of creation. Presets are then managed by an Admission Controller. The Admission Controller applies the preset at the time of creation request. Some of the most typical presets include:
- Secrets
- Volumes
- Mounts
- Environmental variables
Pod Security Policy – Pod Security Policies are cluster-level resources controlling sensitive aspects of a pod’s specifications. A PodSecurityPolicy object defines a specific set of conditions that a certain pod must be running for the system to accept it, in addition to defaults for other related fields.
Preemption – Pods are put in a queue after creation. Pod Priority and Preemption are turned on. As the scheduler grabs pods from this queue, it attempts to schedule them to a node within the cluster. If the pod can’t be scheduled, the scheduler uses the preemption logic to temporarily stop low-priority pods and allow the pending pod to be scheduled.
Proxy – The kube-proxy is the network proxy running on every node within a cluster that implements a piece of the Kubernetes Service model. Kube-proxy supports the network rules within each node. Network rules let the network communicate with your pods, whether the network session is in your cluster or not.
Quality of Service (QoS) Class – A concept that helps Kubernetes determine pod priority in terms of scheduling or eviction. These classes are assigned at the time of pod creation and determined by their resource requests and limitations. The three Quality of Service classes that can be assigned are:
- Guaranteed
- Burstable
- BestEffort
RBAC – Through Kubernetes API, RBAC manages authorization decisions. This allows users at the admin level to configure dynamic access policies by role. Roles contain permission rules. Role bindings grant each defined permission to a specific set of users.
ReplicaSet – A core Kubernetes controller that is used to ensure that the right amount of replicas are running.
ReplicationController – Controls the number of exact pod copies that should be allowed to run in a cluster. After the admin defines the number of replicas allowed, the Control Plane maintains cluster compliance even if pods fail, get deleted, or if too many started at deployment.
Resource quotas – Places a limitation on how many objects can be created, by type, within a namespace. Also ensures that the amount of computing resources allowed within a project is not exceeded.
Secrets – Security account credentials. Secrets are objects containing small packets of sensitive data. As the name suggests, Secrets in Kubernetes is a tool that allows you to store and manage information of a sensitive nature, such as:
- Login information
- OAuth tokens
- SSH keys
In the absence of Secrets, this sensitive data might be placed in a pod spec or image.
Security Context – A pod or container’s security context outlines the privileges and access controls. Discretionary Access Control restricts access permissions to certain objects, such as files, and is based on a user’s ID and/or group ID. Security context can be set to run as either with or without privileges.
Selector – Lets users filter lists of resources by labels. A selector in Kubernetes lets you choose resources based on their label values and assigned resource fields. Think of it like the filter you apply when using Excel spreadsheets. Selector lets you filter just the details you want to see of objects with similar labels.
Service – A conceptual method of exposing applications running on pod sets as a network service. Pod sets targeted by services are (normally) chosen by a selector. If the user adds or removes pods, the pod set that matches the selector changes. The service ensures that the network traffic gets directed to the right pod set.
Service Account – Gives an identity to processes running within a pod. Pod processes accessing the cluster are validated by the server as a specific service account, such as “default”. When a user creates a pod, if a particular service account is not specified, it automatically gets assigned as “default” within that namespace.
Service Catalog – This API extension allows apps that run on Kubernetes clusters to use externally managed software, such as datastore services provided by cloud providers. Service Catalog helps users with listing, provisioning, and binding to externally managed services without having to understand how each specific service is managed or was created.
Shuffle sharding – A technique to assign queue requests. Shuffle sharding is a nimble technique that does a better job isolating low-intensity flows from high-intensity flows than hashing the number of queues.
Sidecar container – A support extension for a main container. A sidecar container can be paired with as many main containers as necessary, enhancing the capabilities of the main containers. For instance, a sidecar container is a good addition to a main container to assist in processing or monitoring system logs.
Stateful – A process that saves data and tracks historical sessions and transactions.
StatefulSet – A Kubernetes controller that manages deployment and scaling for a pod set. Pods managed by this controller are provided unique identities. This identity is used if pods need to be rescheduled.
Stateless – A process that does NOT save data or track historical sessions and transactions.
Static pod – Similar to regular pods, static pods are managed on a node directly by kubelet, instead of on the server. The kube-scheduler ignores static pods, meaning they won’t be terminated or evicted if the node fails.
StorageClass – A way for admins to describe various options available for storage. Important fields in StorageClass specs are:
- Provisioner
- Parameters
- ReclaimPolicy
- VolumeBindingMode
If a Persistent Volume needs dynamic provisioning, these StorageClass terms can be used.
Systcl – A way for admins to modify or change kernel attributes or settings. sysctl, short for ‘system control’, is a utility in some operating systems that can read and/or modify system kernel attributes, such as:
- Version number
- Max limits
- Security settings
In compiled programs, it’s available as both a system call and administrator command. Sysctl can be used interactively or for scripting.
Taint – Core Kubernetes object. Consists of three necessary properties:
- Key
- Value
- Effect
Taint prevents pods from getting scheduled on nodes or on node groups. Specifically useful when nodes with special hardware are reserved, are not licensed for software already running within the cluster, and other reasons. Taints alert the scheduler that these nodes aren’t available for scheduling. Taints and Tolerations work together for better control over pod-to-node scheduling.
Toleration – Core Kubernetes object. Consists of three necessary properties:
- Key
- Value
- Effect
Opposite of Taints, Tolerations allow pod scheduling on nodes or on node groups. Tolerations allow pods to ignore Taints and are housed within PodSpec.
UID – A string generated by the Kubernetes system for object identification. A unique identifier.
Vertical Pod Autoscaler – This tool adjusts the CPU and memory reserves of your pods so that each application is exactly the right size. These adjustments help clusters use resources more appropriately and also frees up CPU processing and memory for your other pods.
Volume – A data directory. The volume can be accessed by containers within a pod. Volumes have a lifespan as long as its pod. As a result, volumes outlive containers running in the pod, and the data is preserved throughout container restarts.
Worker node – A Kubernetes node. See node. Kubernetes clusters consist of a worker machine set, also known as nodes. These nodes run the containerized apps. There’s at least one worker node in every cluster. Worker nodes contain the application’s workload pods. The mods and worker nodes in each cluster are managed by the control plane.
Workload – An app that runs on Kubernetes is a workload. It doesn’t matter whether the workload is just one or many components working together. Kubernetes runs the workload within a pod set. A pod is the set of containers running within the cluster. All your clusters represent the workload.
Last updated August 29, 2022
Modern businesses require increasingly complicated tech stacks to keep their teams up and running. What’s more, as businesses try to stay on top of the latest advancements, they wind up with interconnected layers of apps, hardware, and systems that become more and more interdependent on one another. Often, mission-critical technology ends up dependent on various connections, services, and infrastructure components.
This interweaving is difficult to avoid, but what matters most is that businesses take strides to understand it. With application dependency mapping, businesses can recognize how a seemingly simple change in one area could potentially have a ripple effect on the rest of their tech stack, helping them avoid unwanted downtime and complications.
Of course, there’s more than one way to go about application dependency mapping. So, let’s take a closer look at what it is, how to approach it, and where businesses should be looking to go from there.
What Is Application Dependency Mapping?
The purpose of application dependency mapping is to help businesses understand the complex connections between their various hardware, software, and system components. With more businesses using a hybrid collection of local and cloud-based services, finding the right way to approach application dependency mapping is crucial to maintaining uptime, functionality, and ease of use for internal teams.
The benefits of application dependency mapping are far-reaching, but it starts with the improved visibility and observability that these maps create. As a result of the right approach, businesses can unlock real-time notifications when network changes and problems occur, helping them react quickly. They can also speed up problem-solving by easing root cause analysis and other diagnostic processes.
Overall, application dependency mapping helps IT teams save time and money while improving project planning and execution. As a result, entire businesses benefit from reduced downtime and fewer instances of apps and services not functioning as planned. To unlock all of these benefits, you just need to find the right method for your tech stack.
What Are the Four Methods of Application Dependency Mapping?
As with most modern business challenges, there is more than one way to go about application dependency mapping. These four methods are considered the most widely used for Application Discovery and Dependency Mapping (ADDM), so let’s dive into how each one works along with the pros and cons they hold.
1. Sweep and Poll
Sweep and poll is considered the oldest method of application dependency mapping, and it’s fairly lightweight, meaning it won’t put a lot of strain on your IT resources to complete. This method begins with a “sweep” of your company network in which all IP addresses will be pinged. The automated process will work to gather as much information as possible on all devices pinged on the network, helping you understand what server those devices are operating on, along with information about the applications connected to it.
As you can imagine, the sweep and ping method is one of the fastest ways to generate a blueprint of all the devices your company needs to map together. It can also help you start to identify the interdependencies and get the hierarchy and connections in place. The biggest advantage of this method is that it’s so simple, but that’s also its biggest downfall. While you can get a headstart by pinging IPs, you’ll find that this method becomes less and less reliable in more complex environments.
In almost all cases, businesses using the sweep and poll method will want to go back and manually validate the interdependencies (and expand upon them) to ensure that their application dependency map is truly accurate and reliable.
2. Network Monitoring
Another way to start the application dependency mapping process is to analyze the network traffic patterns at the flow level or by capturing packets. This method is ideal for beginning to understand an unexplored system since it does not take any sort of pre-defined blueprint. However, it can be difficult to scale up. You’ll also need to watch for duplicate records.
One of the primary advantages of this method is that the network is monitored in real-time. As a result, you can track changes to your network as they occur, which can help you begin to see how certain applications are dependent on other components of your tech stack. Of course, this requires your IT team to monitor the results or review reports later on, both of which take substantial time and resources for complex environments.
3. Agent on Server
If the idea of monitoring traffic for real-time analysis appeals to you, another method you may pursue involves placing agents at every relevant app, server, or other connected technology. The purpose of these agents is to monitor the inflow and outflow of traffic, helping them identify when changes occur and, therefore, map dependencies across your tech stack.
The primary benefit of this method is that you can easily identify when multiple apps are being used by the same IP address, helping to improve the accuracy of your mapping efforts. However, because you will need to place multiple agents, the cost can quickly increase for more complicated environments.
4. Automated ADDM
For a done-for-you solution that minimizes the burden on your IT team, you might consider relying on an automated ADDM platform. These managed solutions offer a suite of tools that can speed up the discovery of tech stack components and map them together quickly, giving you a full blueprint without straining your internal team.
For businesses big and small, the best feature of ADDM is its ability to save you time and resources. However, there is an added and ongoing cost that comes along with using one of these platforms. Still, with the ability to schedule additional scans periodically, an ADDM platform can put you on the fast track to mapping dependencies and making sure your map remains accurate and up-to-date as changes occur to your infrastructure.
Application Mapping vs. Application Dependency Mapping
While most businesses recognize the need for application dependency mapping, many consider it one and the same as application mapping. However, these processes ultimately have different goals.
Application mapping is often the first step in application dependency mapping as it requires you to discover all applications on your network and the underlying infrastructure. The resulting application map helps you visualize your network along with a simple hierarchy (e.g., this app runs on this server, etc.).
Application dependency mapping takes the process even further. Once you have discovered all components of your tech stack, an application dependency map tasks your business with showing how they all connect. This means discovering the interdependencies that will demonstrate why changing the available resources in this database could negatively impact the functionality of a specific system.
Overall, if you’re looking to better understand your tech stack, reduce downtime, improve functionality, and prepare your team to effectively plan out successful projects without causing unexpected issues on your network, you are looking for an application dependency mapping solution.
Best Practices for ADDM
No matter which of the four methods you choose to utilize to complete your Application Discovery and Dependency Mapping (ADDM) project, it’s critical that you keep these best practices in mind to ensure the accuracy, efficiency, and reliability of your efforts.
Recognize All Types of Dependencies
Before diving into an ADDM project, your team must recognize that you won’t be able to discover all dependencies within the systems themselves, even if you devote endless time and energy trying to do so. This is because there are many types of dependencies that exist in business, including those relating to business cost and culture.
If you fail to recognize these “unseen” dependencies, your application dependency map (no matter how complete it is otherwise) will lead you astray the next time you go to plan a project or make a major change to business infrastructure. For that reason, all tech and non-tech dependencies need to be understood and considered going forward.
Actively Avoid Dependencies When Possible
By far, one of the easiest ways to simplify the application dependency mapping process is to actively work to avoid dependencies. While you will never be able to create an environment that’s void of dependencies, getting in the habit of thinking twice before creating additional dependencies is a smart practice.
As you go about this, remember that you should also choose the lesser of two evils. In other words, when dependency cannot be avoided, take strides to avoid a proprietary dependency that might lock you in with a specific vendor. Additionally, try to write agnostic, durable code when possible to avoid getting tied to a specific operating system or having to rework everything a few versions from now.
While all of this is certainly easier said than done, these are the habits you should begin to get your IT and development teams to follow as you move forward with application dependency mapping (and management).
Strive To Test Everything
Testing all dependencies and the underlying infrastructure is a necessary step to fully understanding how dependencies work and how you might alleviate some of them. Testing is also crucial to gaining insight into the performance of your environment, which can help you simplify, improve, and troubleshoot down the road.
The biggest challenge with testing everything is that third-party applications, such as cloud-based SaaS solutions, often limit what you can see and do when it comes to the underlying infrastructure. Identifying these limitations is yet another important step to help you decide where things should be changed or improved in the future.
Periodically Update Your Map
The single biggest mistake any business can make with application dependency mapping is treating it as an event instead of an ongoing activity. Things change fast in modern business environments. Failing to set up monitoring tools and schedule re-checks will mean that an application dependency map that took so long to create and perfect will rapidly deteriorate.
In general, the more complex your environment is, the more often you should plan to re-check your application dependency map and look for new components and dependencies on your network. You should also make an effort to do so after each new addition, such as when you implement a new application.
While it will take time and resources to maintain your application dependency map, doing so will allow you to unlock and uphold all of the key benefits of this process, like better observability, performance improvements, smoother IT project planning, and reduced downtime across the board.
Conclusion
Application dependency mapping is an ongoing investment of time and resources, but your business has some flexibility when it comes to choosing the path forward. With four methods to pick from, including the option to invest in an automated platform that can do most of the legwork for you, your company can easily get on the path to observability and reap all of the rewards that come along with it.
What matters most as you pursue an application dependency map is that you follow some established best practices. Namely, that means understanding the many technical and non-technical dependencies that will impact your map and how you use it. Additionally, you should seek to improve your processes going forward to help minimize new dependencies and phase out those that currently exist.
All in all, pursuing an application dependency map is practically a must-do for modern businesses to understand their increasingly complex environments. Now, it’s just a matter of deciding where to start.
There are many types of data compatible with SQL Server, and it’s important to understand what they are to avoid issues with non-compatible data types. Understanding the compatible data types is also fundamental to understanding the data type precedence, which determines what type of data will result when working with objects of two different types.
In this guide, we’ll go through all of the data types SQL Server supports, along with the process of defining custom data types using Transact-SQL or the Microsoft .NET Framework.
Contents
- What Is SQL Server?
- Why Are Data Types Important?
- What Are the Different Data Categories?
- Defining Custom Data Types
- Choosing the Right Data Type
What Is SQL Server?
Before we dive into the many data types SQL Server supports, here’s a quick recap on what SQL Server is. Microsoft developed SQL Server to serve as a relational database management system (RDBMS). SQL Server utilizes SQL, the standard language for using relational databases of all kinds.
Microsoft’s SQL Server is no longer exclusive to the Windows environment and is now available on Linux, which is great news for those interested in using SQL Server. Additionally, Microsoft’s cloud platform, known as Azure, supports SQL Server. So, if you need a place to host it, there’s no better place to look than the native solution.
Microsoft markets it as “the cloud that knows SQL Server best,” and Azure SQL Server indeed benefits from seamless integration, simplicity, and reliability since both the server and cloud infrastructure are developed and maintained by the same company.
Regardless of where you host SQL Server, though, it’s critical to note SQL Server uses a slightly different SQL language. Microsoft has developed Transact-SQL (T-SQL), which is very similar to standard SQL but defines a set of proprietary concepts necessary to program SQL Server.
If you are familiar with SQL, using Transact-SQL will not be difficult, and you’ll be able to utilize SQL Server with ease. But another critical aspect of effectively using SQL Server is understanding all of the data types it supports.
Why Are Data Types Important?
The wrong data type can lead to issues with database performance, query optimization, and data truncation. These problems are often first realized by the development team as they are the ones tracking speed and performance. Still, problems can trickle down to the entire organization, causing data integrity issues and other serious challenges.
If you’re new to SQL Server, the sheer number of data types may be overwhelming. However, they are neatly organized and well-documented, making it a bit easier to find what you need as long as you understand what type of data you are planning to store. Of course, while you can reference as you go along, gaining knowledge of SQL Server data types is paramount to efficiency and optimization in the long haul. Once you dive in, you’ll see that there is some overlap, and knowing when to choose float point over decimal or opt for variable-length over fixed is only possible if you fully understand all of your options.
What Are the Different Data Categories?
Below is a look at each category of data within SQL Server, along with all of the data types that fit within each one.
Exact Numerics
When using an exact numeric data type, it’s important to understand your options so that you can select the smallest data type suitable for your use case. It’s also necessary to choose the data type corresponding to the kind of numeral you’re storing—like money or smallmoney for currencies.
- tinyint: The smallest integer storage type, capable of storing numbers between 0 and 255.
- smallint: Integer storage type with twice the size, up to 2 bytes.
- int: Integer storage type with up to 4 bytes of storage.
- bigint: The largest integer storage type capable of holding up to 8 bytes of data.
- decimal and numeric: These synonymous terms refer to the same data type, which is characterized by its fixed scale and precision.
- bit: This data type always has a value of 1, 0, or NULL. You can convert true/false data to a bit, where 1 equals True, and 0 equals False.
- smallmoney: This data type represents monetary values and allows up to two decimals.
- money: This is another monetary data type but allows up to four decimals.
Unicode Character Strings
If you’re unfamiliar with Unicode, it is a universal standard that assigns a unique number to every character, allowing written text to be encoded and represented consistently. For example, “hey” in Unicode would be broken down as follows: U+0048 (“H”), U+0065 (“E”), and U+0059 (“Y”).
SQL Server supports the full range of Unicode character data using these character strings. They can be fixed or variable.
- nchar: Fixed in size, recommended for use when the data sizes in a column are consistent.
- nvarchar: Variable in size, recommended for use when data sizes in a column vary considerably.
- ntext: Scheduled for removal in future versions of SQL Server, designed as a variable-length data type for Unicode. Microsoft recommends nvarchar(max) instead.
Approximate Numerics
When numeric data cannot be represented exactly, it is referred to as “floating point” numeric data, and you would use approximate-number data types to store it. With floating-point data types, the number is written using scientific notation, so 825,000 would be stored as 8.5 x 10⁵.
Floating-point numbers can be incredibly large or incredibly small. Both floating-point and decimal data types can store a number with a decimal—the difference is that floats require less storage space while decimals are more precise. SQL Server supports two kinds of approximate numerics with the float and real data types.
- float: Double precision floating number, which equates to 8 bytes or 64 bits.
real: Single precision floating number, which equates to 4 bytes or 32 bits.
Character Strings
Character strings have a self-explanatory name: These data types are used to store characters. They can be fixed or variable in size.
- char: Fixed-size string data that uses a static memory location. Ideal when you know the length of the string and all strings in a column will be the same
- varchar: Variable-sized string data that uses a dynamic memory location. Use if you are unsure of the length of the string or when the length of strings in a column will vary considerably.
- text: Scheduled for removal in future versions of SQL Server, designed as a variable-length data type for non-Unicode data. Microsoft recommends replacing it with varchar (max).
Binary Strings
Binary data types support either fixed or variable strings of data. The difference between character strings and binary strings is the data they contain: Character strings typically store text but could also store numbers or symbols. Binary strings typically store non-traditional data in the form of bytes, such as pictures.
- binary: Fixed length, ideal to use when the data sizes in a column are consistent.
- varbinary: Variable length is ideal when data sizes in a column vary considerably.
- image: Scheduled for removal in future versions of SQL Server, designed to store variable-length binary data. Microsoft recommends replacing it with varbinary (max).
Date and Time
These data types are explicitly designed for storing dates and times. Some support timezone awareness and others do not. When dealing with dates and times, it’s crucial to choose a data type that keeps entries consistent in format and select a data type that’s flexible enough to support the level of detail you need (i.e., time of day, timezone, etc.).
- date: Defines the date. The default format is YYYY-MM-DD but can be formatted in over 20 different ways, including DMY, DYM, and YMD.
- datetimeoffset: Defines a date and time of day. This data type is timezone aware.
- datetime2: Extension of the above data type with an optional fractional seconds precision.
- datetime: Similar to datetime2 but with less fractional seconds precision.
- smalldatetime: Defines a date and time of day, but seconds are always zero.
- time: Defines a time of day but without timezone awareness.
Other Data Types
Additional data types exist in SQL Server, but they don’t quite fit into any of the above categories. For that reason, these data types simply exist under “other.” The other data types include the following:
- rowversion: Used for version stamping rows within a table. A simple incrementing number that does not preserve date or time.
- hierarchyid: Variable length system data type used to represent the position in a hierarchy.
- uniqueidentifier: A globally unique identifier (GUID) capable of storing up to 16 bytes.
- sql_variant: Stores various data types supported by SQL. The most important part of sql_variant is that it is variable. For example, one sql_variant column could contain an int in one row and a binary value in another. In order for arithmetic operations, like SUM or PRODUCT to be applied, the type must be first cast to something that works with that operation.
- xml: Stores XML data.
- Spatial Geometry Types: Represents data in a flat coordinate system.
- Spatial Geography Types: Represents data in a round-earth coordinate system.
- table: Special data type used to store a result for processing at some point later.
Defining Custom Data Types
In the event that you have a custom data type that is not specific in any of the above categories, you can still bring it onto SQL Server, so long as you set it up in advance. Using either Transact-SQL or the Microsoft .NET Framework, developers can define custom data types for their projects.
While creating a custom data type, SQL Server’s interface has some tools to help you generate Transact-SQL. The fields you’ll need to specify are schema, name, underlying data type, length, allowing nulls, the size in bytes, optional fields in a default value, and any rules the data type must follow. For example, an email field would likely use a varchar underlying type and must contain an @ and a ., alongside a list of disallowed characters. You’d then set a max length that suits your needs, and the number of bytes would be automatically populated in the interface.
Microsoft offers more information if you need to create your own data type.
Choosing the Right Data Type
When working with SQL Server, it’s crucial that you choose the correct data type for any data you are working with. Failing to do so could lead to data quality issues or data loss, like in instances where you use a data type to store date and time when it is not intended to do so. The wrong data type can also negatively impact querying and performance.
For instance, if you need to store integers, you might assume you can’t go wrong by simply choosing an exact number data type. However, unnecessarily using the bigint type to store a small, simple number like age will lead to wasted resources.
Most would tell you to choose from smallint, integer, bigint, or decimal any time you’re working with numeric data. If you’re dealing with very big numbers, they might suggest decfloat or float. But, this advice is too simplistic and general when you’re dealing with specific use cases.
For instance, you might be working with an inventory system that requires four-digit values and leading zeros. Or, you might be storing Social Security numbers, which need to be properly formatted with hyphens as XXX-XX-XXXX. As you can imagine, there are many complex applications for SQL Server where general guidelines aren’t good enough for choosing the right data type. For that reason, knowing all of the data types available is the first step in choosing the best data type for any information you need to store. Fortunately, you don’t have to memorize all of the data types and their range of information. Microsoft has excellent documentation that takes you through every data type discussed here if you ever need more detailed information in the future.
LogicMonitor currently provides a solution for monitoring groups of nodes with the same functionality, which we call services. With companies moving towards more auto-scalable and transient architecture, LogicMonitor is able to continually monitor these services, which are always changing. We also needed a way of determining if these nodes are being used effectively. It can become an unnecessary cost if there are multiple underutilized nodes. So we decided to take a look at a statistical solution for determining how well a service’s nodes are being used. This led to looking into using outlier detection as well as research into ways of determining a service’s overall balance thus allowing LogicMonitor to provide additional metrics that can be utilized alongside anomaly detection to find discrepancies in node utilization over time.
In this article, we will cover:
- What Is an Outlier?
- What Is an Unbalanced Service?
- Why Use Unbalanced Service Detection Over Outlier Detection for Aggregated Metrics?
- How To Use Anomaly Detection for an Unbalanced Service
- How Does LogicMonitor Use Unbalanced Metrics?
What Is an Outlier?
Outliers are defined as data points that are significantly different from other points in a dataset. Usually, outliers determine some kind of anomaly or error in a group of collected data. Outliers usually cause issues with statistical analysis leading to false conclusions especially when a calculation depends on the data’s mean or standard deviation. Usually detecting an outlier is done using the Tukey’s Fences method where any values that exceed the calculated upper and lower bounds are considered outliers. Most people see these examples visualized using a box plot showing the three quartiles and the upper and lower limits.
What Is an Unbalanced Service?
An unbalanced service refers to a group of instances that on some metric are not being utilized evenly. With the increased usage of microservice architecture, there is a need to make sure that every resource is being used efficiently and effectively. Otherwise, money is being wasted and there was no need to expand horizontally in the first place. In load balancing, usually, a round-robin strategy is taken but there can be a case where a node may be getting the smaller tasks while another is receiving larger, more complex requests. This is where we would need to see unbalanced metrics so that there is insight into these issues.
Why Use Unbalanced Service Detection Over Outlier Detection for Aggregated Metrics?
Using outlier detection to find irregular nodes while relying on aggregated metric collection can show promise depending on the user’s needs. In metrics, such as request count and HTTPS calls, there are opportunities to see larger differences in data points that in cases where other nodes are not being used or some are being overused, we would see these differences as outliers. As for other cases (CPU, memory, other percentile measurements), it is very difficult to calculate an outlier due to the set bounds for percentages (0-100). This is where an unbalance detection algorithm would be much more effective.
An Example of How Outlier Detection Does Not Work
If you have ten services with nine having 10% CPU utilization and one having 90%, here we have an outlier but let us say if we have five nodes with 90% and the five have 10%. In this case, the nodes certainly are not being used efficiently all around but if we relied on outlier detection there wouldn’t be any indication of an issue. Another difficulty with using outlier detection is that it requires both a larger dataset and must contain some extreme value(s) while statistically determining an unbalance can be used on any amount of nodes and the smallest differences are found.
How To Use Anomaly Detection for an Unbalanced Service

Figure 1: Adding the unbalanced aggregation to your service.

Figure 2: Reviewing the data points for the new unbalanced aggregation function.

Figure 3: Showing related data points for each instance within the service.

Figure 4: Here we set up dynamic alerting which is determined based on anomaly detection.

Figure 5: Setting up static alerting for when users know how unbalanced their service can get before needing to be notified.
How Does LogicMonitor Use Unbalanced Metrics?
At LogicMonitor, we use our own product to monitor our services. This allows us to take full advantage of the unbalanced metric to determine how well our services are being utilized and be able to take necessary actions to have better performance.
How New Version Deployment Impacted Our Own Service?
An example of a service that we are currently monitoring is the Collector Adapter that has multiple services across pods that in cases where there are large customers, we have noticed nodes not being used equally. This has been determined to be caused by our load management system that separates requests based on the customer so for larger customers, the request rate is much larger than smaller ones even though they all exist in the same pod.

Figure 6: Unbalanced metric being used to find inefficiencies in the Collector Adapter services’ rate requests.
Having this metric available allows us to find these issues earlier and makes it easier to pinpoint the services and nodes that need to be reviewed. We are able to take more in-depth views into other utilization metrics such as CPU and then we can spend the time researching solutions rather than trying to find the initial issue. In the case where we had recently deployed a new version of the Collector Adapter, we saw a huge change in CPU utilization which was also followed by the larger unbalanced index shown in Figure 6. This led us to determine that there was something to look into and we were able to find more information using the other aggregated metrics gathered and anomaly detection.

Figure 7: Service with Unbalanced index of 45% having CPU aggregation metrics with large differences between the max, min, and mean due to deployment.

Figure 8: Anomaly detection analysis showing a large drop in CPU utilization and a note stating the cause being a recent deployment.
Conclusion
After reviewing both options as possible solutions, we determined that our use case would be better handled using an unbalanced service detection algorithm rather than relying on finding outliers. It provided more usability for smaller services while still providing support for larger ones all without relying on extreme value scenarios.
Originally Published July 16, 2021. Updated December 2022.
The Windows Event log is an essential tool for administrators to investigate and diagnose potential system issues, but it can also be a daunting task to gain real value and separate useful log entries from noisy non-essential activity. Depending on the level of logging that can be useful, Windows events can span system issues, application-specific issues, and also dive into security type issues around unauthorized access, login failures, and unusual behavior. Administrators must understand the concept of channels, logging levels, and the lens through which to view the data to make this data useful in day-to-day troubleshooting and root cause analysis.
For today’s discussion, we are going to apply the lens of a Windows system administrator using the Windows Event logs to identify the root cause for system failures, performance issues, configuration issues that lead to outages, or service disruptions.
Noise vs. Value
The comment I hear most often around the subject of noise vs. value is that 99% of logs are never searched or used. I suppose this is mostly true but also reinforced because of how people typically use logs, which is avoiding them until there is a problem or outage and then the logs become a necessary evil. As most logging vendors bill based on ingest, log consumers go to great lengths to filter out the repetitive, audit success events, or even drop all information level logs and only keep warning, critical, and error logs. All of which reduce ingest and cost, but also reduce visibility into the dark spot of configuration changes. Configuration changes have been linked to 40% of all outages in IT today and are mostly written as information level in their various log sources. Windows is no exception, with a great deal of these “noisy” events being written to the information channel (more on channels to come).
One could argue that if you could leverage AI, machine learning, and anomaly detection you could increase the value of 99% of the logs that are never searched until a problem arises. Using anomaly detection to scan configuration change logs or information level logs could show real insight around new behaviors that can be addressed or known about. This could help avoid outages in the first place and also resolve things more quickly when there are service disruptions. If you are only ingesting and holding error, warning, and critical level logs you are missing out on the proactive value that can be gained from the 99%.
Centralize and Aggregate
The first step in any Windows Event management strategy is to centralize and aggregate these logs from across the environment into a single location. While retention times can vary based on use cases, having them central and searchable is key to success.
Windows Events are located locally at each windows server which means there can be a fairly large degree of non-value-added engineering time involved just to get the right server at the right time. Non-value added engineering time is the amount of time a tech or admin will spend connecting to systems, downloading log files, searching, or parsing any tasks required before analysis and triage can be done. There are a variety of means to consolidate but for purposes of our discussion, we will assume that log ingestion means are in place and we can move the conversation into noise vs. value and what kind of logs to consume.
What Are Event Channels?
Channels are essentially buckets that classify event types. Putting them into categories makes them easier to collect, search, and view. Many Windows-based applications are written to be configured to log into one of Microsoft’s pre-defined channels, but we also see applications creating their own channel as well. For purposes of monitoring Windows Event log through the eyes of a system administrator and troubleshooting, the best practice approach is to ingest logs from the application, system, and security channels. However, there could be many additional channels based on the functions and other applications installed on the system. A quick PowerShell command from the administrator PowerShell prompt can show you a quick list of available channels on the system in question.
Enter the following command into PowerShell:
# to see channels listed in the standard order
Get-WinEvent -ListLog *

# to sort more active channels to the top of the list
Get-WinEvent -ListLog * | sort RecordCount -Descending

# to see channels present on a remote computer
Get-WinEvent -ListLog * -ComputerName <hostname>
The output will include a list of channels, along with the number of event records currently in those channels:
LogMode   MaximumSizeInBytes RecordCount LogName
-------   ------------------ ----------- -------
Circular            20971520       59847 Application
Circular            20000000       29339 Microsoft-Windows-Store/Operational
Circular            20971520       21903 Security
Circular             4194304       10098 Microsoft-Windows-GroupPolicy/Operational
Circular             5242880        9568 Microsoft-Windows-StateRepository/Operational
Circular            15728640        7066 Windows PowerShell
Circular             5242880        4644 Microsoft-Windows-AppXDeploymentServer/Operational
Circular             8388608        4114 Microsoft-Windows-SmbClient/Connectivity
Circular             1052672        2843 Microsoft-Windows-EapHost/Operational
Circular             1052672        2496 Microsoft-Client-Licensing-Platform/Admin
Event Types
Now that we’ve defined channels, it’s time to discuss the Event Types that are pre-set by Microsoft and apply them to each channel. Microsoft has categorized the Event Types as Information, Error, Warning, Critical, Security Audit Success, and Security Audit Failure. The first thing of note here is that event types Security Audit Success and Security Audit Failure only apply to the Security Channel and are only present in the Security Channel. Another important item to point out is that not all security events are written into the Security Channel. Security-related events could also be written to the System or Application channel or any of the other function-specific channels that could reside on a system.
Windows Events for Ops vs. SIEM
Traditionally, the SIEM requests any and all logs and log types with the exception of debug level logging. This could work in a perfect world where cost is not a prohibitive factor, but most companies don’t have unlimited funds and they make exclusions. As mentioned above, security-type events can be written across channels. The SIEM typically needs to grab logs from all of these channels, but often times will exclude information level alerts as a cost-savings method.
The typical stance from an operational perspective is that the security channel is often excluded from ingestion. As we’ve mentioned above, information level alerts can be highly valuable to operations staff, especially if the idea of anomaly detection is applied.
Best Practices
While the usual approach outlined above will offer value, LogicMonitor’s best practice approach goes a little further in capturing additional value from these logs. We recommend grabbing any channel, but certainly starting with the application, system, and security channels, even for operations teams. The key channel here is the security channel. It is essential to define the event types we want to ingest and our recommended approach is to accept the information level log events and higher for any channel. This means we want to bring in the following event types: Information, Warning, Error, and Critical events for all channels, including the security channel. Let’s go a little deeper into why we might grab any security events for the operations team and how we can tune out some of the audit success noise.
The security channel is hands down the largest event volume and highest talker. When we investigate further, we know it is overwhelmingly the security audit success event type. Security audit successes are extremely chatty and essentially give us a record of who logged in where/when, what they accessed, and expected behavior. This level of logs may come in handy for a security analytics investigation but is rarely helpful or used in a break/fix type of triage. This leads us to the security audit failure and the other side of the coin. Security audit failures show us failed access, or login failures, and can indicate suspicious activity which could be the first indicators of an attack or hacker activity. Any or all of the above can lead to larger issues affecting both operations and security teams.
One additional thought here to wrap up event types and best practices is debug level logs. Debug level logging could be useful if a specific use case comes up and could be turned on temporarily to assist in the deep dive triage. It should only be used during these ad hoc cases.
Become More Proactive Than Reactive With LM Logs
LogicMonitor’s LM Logs capabilities combined with our best practices approach give customers a winning and sensible approach to aggregate Windows event logs quickly and efficiently into a single, searchable pane of glass. Collect the right level of log to help focus Windows administrators for better MTTR, use root cause analysis during triage of an issue, and use anomaly detection to drive proactive use of the logs to catch unusual behavior or changes that could lead to larger issues down the road. These are just a few features of LM Logs that address some of the Windows Event Log challenges:
- Easy to ingest with LM Logs via WMI using existing LogicMonitor monitoring infrastructure and collectors already in place.
- Combine logs with server metrics for more in-depth views in a single pane of glass.
- Daily, weekly, or monthly anomaly review sessions help gain valuable insight into unusual behavior.
- Intuitive and simple means to define channels using the LM Logs DataSource and applying properties at either the individual server or server group levels.
- Trigger Alerts on specific conditions with keywords, eventIDs, or Regex.
- Use data source properties to quickly filter out repetitive events by EventID, Event Type, or Message String.
Check out our on-demand webinar to learn more about how LM Logs can help your teams decrease troubleshooting, streamline IT workflows, and increase control to reduce risk.
A JSON Web Token (JWT) is a URL-safe method of transferring claims between two parties as a JSON object, the data structure used to represent data in a human-readable and machine-parseable format called JavaScript Object Notation (JSON). As JWTs gain popularity with frameworks like OAuth 2.0 and standards like OpenID Connect, they become a more trusted solution for secure data exchange.
JWTs include three components: header, payload, and signature. An encrypted or signed token with a message authentication code (MAC) is known as a JSON web signature (JWS), while an encrypted token is a JWE or JSON web encryption.
For the sake of verbal communication, many developers have taken to pronouncing JWT as “jot” or “jawt”. Continuing that theme, I propose the pronunciation of JWS as “jaws” and JWE as “jawa.”
The JWT is formed by concatenating the header JSON and the payload JSON with a “.” and optionally appending the signature. The whole string is then base64 URL encoded.
This article covers the basics of JWT tokens, offers examples of JSON Web Token usage, and answers questions about best practices.
Table of contents:
- What are JSON Web Tokens?
- Example of JSON Web Tokens
- When to use JWT
- Is JWT secure?
- Best practices when implementing JWTs
- JWT Tokens vs. session tokens
- Use cases for JSON Web Tokens
- Conclusion
- FAQs about JSON Web Tokens
Example of JSON Web Tokens
JWT Example
eyJ0eXAiOiJKV1QiLCJhbGciOiJIUzI1NiJ9.eyJpc3MiOiJMTSIsImlhdCI6MTYxOTQ3MDY4MiwiZXhwIjoxNjE5NDcxODg2LCJhdWQiOiJsb2dpY21vbml0b3IuY29tIiwic3ViIjoiTmVkIn0.mqWsk4fUZ5WAPYoY9bJHI7gD8Zwdtg9DUoCll-jXCMgDecoded Header
{
  "typ": "JWT",
  "alg": "HS256"
}
Decoded Payload
{
  "iss": "LM",
  "iat": 1619470682,
  "exp": 1619471886,
  "aud": "logicmonitor.com",
  "sub": "Ned"
}
Signature
mqWsk4fUZ5WAPYoY9bJHI7gD8Zwdtg9DUoCll-jXCMgWhen to use JWT tokens
JWTs offer practical ways for maintaining HTTP request states in stateless authentication situations. Common uses include RESTful APIs and Single Sign-On (SSO) authentication. A JWT provides state information to servers for each request. This is especially helpful for secured RESTful web services that require client authentication and authorization control.
When not to use a JWT: Do not use a JWT when a session token will do. Session tokens are a well-established method of managing client access, and their potential to introduce vulnerabilities is low.
LogicMonitor’s article about Adding and Managing Web Services provides insights on integrating JWTs with web services.
Security considerations for JWTs
The most common vulnerabilities of a JWT or JWS are created during implementation. As JWS does not inherently provide security, proper implementation combined with secure server monitoring with tools like Silver Peak is key to avoiding security pitfalls like the following:
- Algorithm confusion: Avoid allowing JWT headers to dictate validation algorithms, which can lead to vulnerabilities if an attacker sets the “alg” header to “none.”
- Weak secrets: Use strong, complex secrets to prevent token forgery.
- Token sidejacking: Prevent sidejacking by incorporating user context and expiration times and securely storing tokens.
Real-life comparison of encryption algorithms: HMAC vs. RSA
HMAC (hash-based message authentication code) uses a shared secret key to form and validate a signature. RSA, an asymmetric algorithm, uses a private key to form a signature and a public key to validate the digital signature.
A system using the RSA algorithm would sign with the private key and validate with the public key. If a JWT is signed using an HMAC algorithm and a public RSA key as input, then the receiving system could be fooled into using the public RSA key it knows to validate the signature using the HMAC algorithm.
This attack works when a receiving system allows a JWT header to drive token authentication. In this case, the attacker declared the public key of the asymmetric scheme to be the shared secret key of the symmetric signature scheme.
Best practices for implementing JWT tokens
To maximize the security and effectiveness of JWTs, these best practices should be followed during implementation.
- Proper authentication control: Don’t allow JWT headers to drive token authentication; use a predefined list of allowed algorithms.
- Token secrets: Avoid weak token secrets that allow attackers to generate valid tokens.
- User context: To prevent token sidejacking, add user context to tokens; random strings are provided during client authentication and kept in hardened cookies.
- Secure storage: Use hardened cookies to ensure secure storage.
- Expiration times: Set reasonable limitations on token validation dates and consider other methods for revocation for tokens that need to remain valid for extended periods.
- Scope of authorization: Issue JWTs with narrow scopes of access to secured resources.
- Require claims: Enforce limits on access points so that claims made beyond the scope limit will be rejected regardless of signature validity.
- Privileged data: Never store privileged data in a JWT or JWS, which do not hide stored data in headers or payloads.
JWT tokens vs. session tokens
JWT differs from traditional session tokens in several ways:
Stateless
JWTs are stateless and don’t require server-side storage. All information is stored within the token itself, eliminating the need for server storage and reducing web app requirements. To manage states, session tokens require server storage, so scaling these applications becomes more difficult.
Decentralization
JWTs allow for decentralized authentication. Once a user is issued a JWT, any service with the correct secret key can validate the token without contacting a central server. With session tokens, the user typically must validate their credentials with the stored session data on the server.
Flexibility
JWT can carry more information than session tokens. It can include user roles, permissions, token information, and metadata. Session data typically only contains an identifier, with the rest stored on the server.
Security
JWTs require different security considerations because sensitive data is stored on user machines. It requires encryption, proper signing, and proper handling of secret keys. Much of a session token’s security relies on server data management.
Performance
JWTs can improve web application performance by reducing server operations. For example, they may reduce the number of database lookups, improving the performance of high-bandwidth applications. Session tokens may require lookups for each request, which may make scaling more complicated.
Use cases for JSON Web Tokens
JWTs are versatile and applicable in various scenarios, such as:
Microservices
JWTs can facilitate communication between microservices. Since JWTs can authenticate with any server with secret keys, they help decentralize applications and ensure secure inter-service communication. They also help carry user context between servers, maintaining a consistent user state without a shared database.
Mobile applications
JWTs can help manage user authentication and sessions in mobile apps. This is especially important for apps that require persistent authentication in areas with intermittent connectivity. JWTs are stored securely on a device, allowing some level of offline access with cached resources while maintaining user information, permissions, and other information.
APIs and web applications
JWTs make building APIs and web applications simpler by enabling stateless authorization and rich user information. They are useful for authentication API access without server-side sessions. They simplify authentication by directly including user roles and permissions in the token, as you can see with the Zoom application authentication.
“JWTs are essential for modern applications, enabling secure, efficient communication across platforms.”
Conclusion
JWTs provide a lightweight method for managing and securing authentication and data exchange. JWT might be a good fit for organizations that require specific security measures and scalable resources.
Visit LogicMonitor’s support section or join LM’s community discussions to learn more about JWT implementation and security best practices.
FAQs about JSON Web Tokens
What is the role of JWTs in microservices architectures?
JWTs enable secure and efficient communication between microservices by allowing stateless authentication and authorization.
How can JWTs enhance mobile application security?
JWTs allow mobile apps to authenticate users securely by carrying encrypted user data and permissions, reducing the need for server-side session storage and improving performance.
What are the potential security pitfalls of JWT implementations?
Common pitfalls include algorithm confusion, weak secrets, insecure client-side storage, and improper token validation, all of which can compromise security if not addressed.
How do JWTs differ from other token types like OAuth?
JWT is a token format, while OAuth is an authorization framework. JWTs are often used as tokens within OAuth implementations.
What are the best practices for managing JWT expiration and renewal?
Implement token refresh mechanisms and set appropriate expiration times, such as short-lived access tokens and long-lived refresh tokens, to obtain new access tokens, ensuring continuous access while maintaining security.
Manual instrumentation provides enhanced insight into the operations of distributed systems. By instrumenting your Java applications manually, you gain greater control over the data you collect, leading to improved visibility across your distributed architecture.
In this blog series, we are covering application instrumentation steps for distributed tracing with OpenTelemetry standards across multiple languages. Earlier, we covered Golang Application Instrumentation for Distributed Traces and DotNet Application Instrumentation for Distributed Traces. Here we are going to cover the instrumentation for Java.
Exploring OpenTelemetry concepts
OpenTelemetry is a set of libraries, APIs, agents, and tools designed to capture, process, and export telemetry data—specifically traces, logs, and metrics—from distributed systems. It’s vendor-neutral and open-source, which means your business has interoperability and freedom of choice to implement observability systems across a wide range of services and technologies.
You can break OpenTelemetry down into a few main concepts: signals, APIs, context and propagation, and resources and semantic conventions.
Signals
Signals in OpenTelemetry are traces, metrics, and logs. Traces represent the end-to-end latency in your operation across services. They are composed of spans, which are named individual units of work with start and end timestamps and contextual attributes.
Metrics are the qualitative measurements over time (CPU usage, memory usage, disc usage) that help you understand the overall performance of your application. Logs, on the other hand, are records of events that occur on systems that provide insights into errors and other events.
APIs
OpenTelemetry defines a language-agnostic API that helps teams create code that implements the API to collect and process data and export it to their chosen backends. The API allows anyone to collect the same data, whether using custom software or an out-of-the-box monitoring solution, allowing them to process data on their own terms and tailor a monitoring solution based on their needs.
Context and propagation
Context is a concept used to share data (like span context) between code and networks. Context propagation ensures that distributed traces stay connected as requests travel across networks through different services—helping teams get a holistic view across the entire infrastructure.
Resources and semantic conventions
A resource is what provides information about the entity producing data. It contains information like the host name, device environment, and host details. Semantic conventions are the standardized attributes and naming conventions that make telemetry data more consistent and allow any environment to uniformly interpret the data without worrying about variations in data output.
Understanding these concepts will help you decipher telemetry output and get started with your OpenTelemetry projects. So, let’s start by setting up a new project.
Custom instrumentation and attributes
Custom instrumentation in Java applications allows developers to capture more granular telemetry data beyond what automatic instrumentation provides. By manually defining spans and adding attributes, teams can gain deeper insights into specific application behaviors and business logic within a distributed system.
Adding attributes to spans
Attributes are key-value pairs attached to spans, providing contextual metadata about an operation. These attributes can include details such as user IDs, transaction types, HTTP request details, or database queries. By adding relevant attributes, developers can enhance traceability, making it easier to filter and analyze performance data based on meaningful application-specific insights.
Creating Multi-Span Attributes
Multi-span attributes allow developers to maintain consistency across spans by propagating key metadata across multiple operations. This is especially useful when tracking a request across services, ensuring that relevant information, such as correlation IDs or session details, remains linked throughout the trace.
Initialize New Project
To begin, create a new Java project and add the below dependencies that are required for OpenTelemetry manual instrumentation.
Maven
<project>
  <dependencyManagement>
    <dependencies>
      <dependency>
        <groupId>io.opentelemetry</groupId>
        <artifactId>opentelemetry-bom</artifactId>
        <version>1.2.0</version>
        <type>pom</type>
        <scope>import</scope>
      </dependency>
    </dependencies>
  </dependencyManagement>
  <dependencies>
    <dependency>
      <groupId>io.opentelemetry</groupId>
      <artifactId>opentelemetry-api</artifactId>
    </dependency>
    <dependency>
      <groupId>io.opentelemetry</groupId>
      <artifactId>opentelemetry-sdk</artifactId>
    </dependency>
    <dependency>
      <groupId>io.opentelemetry</groupId>
      <artifactId>opentelemetry-exporter-otlp</artifactId>
    </dependency>
    <dependency>
      <groupId>io.opentelemetry</groupId>
      <artifactId>opentelemetry-semconv</artifactId>
      <version>1.5.0-alpha</version>
    </dependency>
    <dependency>
      <groupId>io.grpc</groupId>
      <artifactId>grpc-netty-shaded</artifactId>
      <version>1.39.0</version>
    </dependency>
  </dependencies>
</project>
Gradle
dependencies {
  implementation platform("io.opentelemetry:opentelemetry-bom:1.2.0")
  implementation('io.opentelemetry:opentelemetry-api')
  implementation('io.opentelemetry:opentelemetry-sdk')
  implementation('io.opentelemetry:opentelemetry-exporter-otlp')
  implementation('io.opentelemetry:opentelemetry-semconv:1.5.0-alpha')
  implementation('io.grpc:grpc-netty-shaded:1.39.0')
}
It is recommended to use OpenTelemetry BOM to keep the version of the various components in sync.
If you are developing a library that is going to be used by some other final application, then your code will have dependency only on opentelemetry-api.
Create Resource Detectors
The resource describes the object that generated the Telemetry signals. Essentially, it must be the name of the service or application. OpenTelemetry has defined the standards to describe the service execution env, viz. hostname, hostType (cloud, container, serverless), namespace, cloud-resource-id, etc. These attributes are defined under Resource Semantic Conventions or semconv.
Here we will be creating a resource with some environmental attributes.
| Attribute | Description | Required |
| service.name | It is the logical name of the service. | Yes |
| service.namespace | It is used to group the services.For example, you can use service.namespace to distinguish services across environments like QA,UAT,PROD. | No |
| host.name | Name of the host where the service is running. | No |
//Create Resource
AttributesBuilder attrBuilders = Attributes.builder()
   .put(ResourceAttributes.SERVICE_NAME, SERVICE_NAME)
   .put(ResourceAttributes.SERVICE_NAMESPACE, "US-West-1")
   .put(ResourceAttributes.HOST_NAME, "prodsvc.us-west-1.example.com");

Resource serviceResource = Resource
   .create(attrBuilders.build());
Init Span Exporter
The exporter is the component in SDK responsible for exporting the Telemetry signal (trace) out of the application to a remote backend, log to a file, stream to stdout., etc.
Consider how distributed tracing impacts system performance. Proper trace sampling can help balance the need for detailed traces with overall system efficiency, preventing performance slowdowns or data overload.
In this example, we are creating a gRPC exporter to send out traces to an OTLP receiver backend running on localhost:55680. Possibly an OTEL Collector.
//Create Span Exporter
OtlpGrpcSpanExporter spanExporter = OtlpGrpcSpanExporter.builder()
   .setEndpoint("http://localhost:55680")
   .build();
Construct TracerProvider and Configure SDK
Using TracerProvider you can access Tracer, a key component in Java performance monitoring, that is used to create spans and track performance metrics.
//Create SdkTracerProvider
SdkTracerProvider sdkTracerProvider = SdkTracerProvider.builder()
   .addSpanProcessor(BatchSpanProcessor.builder(spanExporter)
       .setScheduleDelay(100, TimeUnit.MILLISECONDS).build())
   .setResource(serviceResource)
   .build();

//This Instance can be used to get tracer if it is not configured as global
OpenTelemetry openTelemetry = OpenTelemetrySdk.builder()
   .setTracerProvider(sdkTracerProvider)
   .buildAndRegisterGlobal();
You need to configure the SDK and create the tracer as a first step in your application.
With the right configuration in place, developers can monitor their application’s performance in real-time. This enables quick adjustments and optimization, allowing you to address issues or enhance performance as soon as they arise.
Create Tracer
Tracer tracer= GlobalOpenTelemetry.getTracer("auth-Service-instrumentation");
//Tracer tracer= GlobalOpenTelemetry.getTracer("auth-Service-instrumentation","1.0.0");

//OR use the OpenTelemetry instance from previous step to get tracer
//openTelemetry.getTracer("auth-Service-instrumentation");
You can use GlobalOpenTelemetry only If your OpenTelemery instance is registered as global in the previous step or else you can use the OpenTelemetry instance returned by SDK builder.
The getTracer method requires an instrumentation library name as a parameter, which must not be null.
Using GlobalOpenTelemetry is essential for tracing intricate processes across multiple services. By enabling this, you streamline the tracing of multi-step workflows and boost overall operational efficiency, ensuring smooth and optimized system performance.
Creating and managing spans
Creating and managing spans efficiently is the next step after setting up your OpenTelemetry instrumentation. Properly defining, structuring, and annoying spans will help you understand how your operations flow through your system and help when troubleshooting problems.
A few things help make good spans: span attributes, child spans, and events.
- Span attributes: Span attributes help assign meaning to your spans. They distinguish one operation from another and provide valuable metadata for downstream analysis tools. Use attributes to represent business priorities, environmental details, and user information. Remember to standardize attributes across environments using semantic conventions to ensure service consistency.
- Child spans: More complex workflows require multiple steps and dependencies, which are hard to represent in a single span. Child spans allow you to break a single operation into sub-operations, making it easier to find delays and errors. Use these to create parent-child relationships, giving you a structured view of your data for faster troubleshooting.
- Event logging: Events and logs allow you to record time-stamped data points or device internal state changes. Embedding events and logs means you don’t rely solely on external logging solutions and ensures all contextual information is tied directly to the specific operation within your trace data. This data will prove invaluable when diagnosing problems since it provides immediate context to performance and anomalies.
There are also a few best practices to consider to get the most out of your telemetry, some of which include:
- Implement status and error handling (StatusCode.OK, StatusCode.ERROR) on spans to make it easier to identify problematic spans quickly
- Since not all requests require full instrumentation, optimize your sampling strategy to balance performance and observability
- Consider linking spans for spans that share a common relationship but aren’t necessarily a parent/child relationship to help correlate related but independently triggered spans
- Make use of OpenTelemetry’s Context and Scope management utilities to ensure spans are accessible in multi-threaded workflows where spans may not correctly propagate
Understanding these fundamentals will help your organization optimize your instrumentation to produce more meaningful telemetry. With that, let’s look at some examples of how to create and manage your spans effectively.
Troubleshooting common issues
Even with well-structured spans, OpenTelemetry instrumentation can sometimes present challenges. Some common troubleshooting techniques include:
- Ensuring proper span propagation: When spans don’t appear in the expected traces, verify that context propagation is correctly implemented across service boundaries.
- Checking exporter configurations: If traces are missing from your backend, confirm that your exporter settings are correctly configured, and ensure the application has network access to the telemetry endpoint.
- Managing high latency in trace data: If traces are delayed or missing, consider adjusting your sampling rate to balance performance and data volume.
- Handling incomplete spans: Ensure that spans are properly ended, especially in multi-threaded or asynchronous workflows, where spans may be lost due to improper scope management.
Alternative protocols for telemetry data transmission
By default, OpenTelemetry uses gRPC for exporting telemetry data. However, in some cases, HTTP-based transport methods can be a better alternative, especially when working with legacy systems, firewalls, or monitoring tools that do not support gRPC.
Create a Span and Define Span Attributes
The span is a single execution of an operation. It is identified by a set of attributes, which are sometimes referred to as span tags. Application owners are free to choose the attributes that can capture the required information for the spans. There is no limit to the number of span attributes per span.
In this example, we are defining two-span attributes for our sample applications.
Span parentSpan = tracer.spanBuilder("doLogin").startSpan();
parentSpan.setAttribute("priority", "business.priority");
parentSpan.setAttribute("prodEnv", true);
Create a Child Span
You can use the setParent method to correlate spans manually.
Span childSpan = tracer.spanBuilder("child")
   .setParent(Context.current().with(parentSpan))
   .startSpan();
The OpenTelemetry API also offers an automated way to propagate the parent span on the current thread.
Use the makeCurrent method to automatically propagate the parent span on the current thread.
try (Scope scope = parentSpan.makeCurrent()) {
   Thread.sleep(200);
   boolean isValid=isValidAuth(username,password);
   //Do login

} catch (Throwable t) {
   parentSpan.setStatus(StatusCode.ERROR, "Change it to your error message");
} finally {
   parentSpan
       .end(); // closing the scope does not end the span, this has to be done manually
}

//Child Method
private boolean isValidAuth(String username,String password){

   Span childSpan = tracer.spanBuilder("isValidAuth").startSpan();
   // NOTE: setParent(...) is not required;
   // `Span.current()` is automatically added as the parent
   childSpan.setAttribute("Username", username)
       .setAttribute("id", 101);
   //Auth code goes here
   try {
       Thread.sleep(200);
       childSpan.setStatus(StatusCode.OK);
   } catch (InterruptedException e) {
       childSpan.setStatus(StatusCode.ERROR, "Change it to your error message");
   }finally {
       childSpan.end();
   }
   return true;
}
Add Events/Logs to Spans
Spans can be enriched with some execution logs/events that happened during the execution of the span. This information will help provide contextual logs always tied up with the respective span.
Attributes eventAttributes = Attributes.builder().put("Username", username)
   .put("id", 101).build();
childSpan.addEvent("User Logged In", eventAttributes);
Putting It Together
TestApplication.java
package com.logicmonitor.example;

import io.opentelemetry.api.OpenTelemetry;
import io.opentelemetry.api.common.Attributes;
import io.opentelemetry.api.common.AttributesBuilder;
import io.opentelemetry.exporter.otlp.trace.OtlpGrpcSpanExporter;
import io.opentelemetry.sdk.OpenTelemetrySdk;
import io.opentelemetry.sdk.resources.Resource;
import io.opentelemetry.sdk.trace.SdkTracerProvider;
import io.opentelemetry.sdk.trace.export.BatchSpanProcessor;
import io.opentelemetry.semconv.resource.attributes.ResourceAttributes;
import java.util.concurrent.TimeUnit;

public class TestApplication {

   private static final String SERVICE_NAME = "Authentication-Service";
   static {
       //Create Resource
       AttributesBuilder attrBuilders = Attributes.builder()
           .put(ResourceAttributes.SERVICE_NAME, SERVICE_NAME)
           .put(ResourceAttributes.SERVICE_NAMESPACE, "US-West-1")
           .put(ResourceAttributes.HOST_NAME, "prodsvc.us-west-1.example.com");

       Resource serviceResource = Resource
           .create(attrBuilders.build());
       //Create Span Exporter
       OtlpGrpcSpanExporter spanExporter = OtlpGrpcSpanExporter.builder()
           .setEndpoint("http://localhost:55680")
           .build();

       //Create SdkTracerProvider
       SdkTracerProvider sdkTracerProvider = SdkTracerProvider.builder()
           .addSpanProcessor(BatchSpanProcessor.builder(spanExporter)
               .setScheduleDelay(100, TimeUnit.MILLISECONDS).build())
           .setResource(serviceResource)
           .build();

       //This Instance can be used to get tracer if it is not configured as global
       OpenTelemetry openTelemetry = OpenTelemetrySdk.builder()
           .setTracerProvider(sdkTracerProvider)
           .buildAndRegisterGlobal();
   }
   public static void main(String[] args) throws InterruptedException {
       Auth auth = new Auth();
       auth.doLogin("testUserName", "testPassword");
       Thread.sleep(1000);
   }
}
Auth.Java
package com.logicmonitor.example;

import io.opentelemetry.api.GlobalOpenTelemetry;
import io.opentelemetry.api.common.Attributes;
import io.opentelemetry.api.trace.Span;
import io.opentelemetry.api.trace.StatusCode;
import io.opentelemetry.api.trace.Tracer;
import io.opentelemetry.context.Scope;

public class Auth {

   Tracer tracer = GlobalOpenTelemetry.getTracer("auth-Service-instrumentation");

   //Tracer tracer= GlobalOpenTelemetry.getTracer("auth-Service-instrumentation","1.0.0");
   public void doLogin(String username, String password) {
       Span parentSpan = tracer.spanBuilder("doLogin").startSpan();
       parentSpan.setAttribute("priority", "business.priority");
       parentSpan.setAttribute("prodEnv", true);

       try (Scope scope = parentSpan.makeCurrent()) {
           Thread.sleep(200);
           boolean isValid = isValidAuth(username, password);
           //Do login

       } catch (Throwable t) {
           parentSpan.setStatus(StatusCode.ERROR, "Change it to your error message");
       } finally {
           parentSpan
               .end(); // closing the scope does not end the span, this has to be done manually
       }

   }

   private boolean isValidAuth(String username, String password) {

       Span childSpan = tracer.spanBuilder("isValidAuth").startSpan();
       // NOTE: setParent(...) is not required;
       // `Span.current()` is automatically added as the parent

       //Auth code goes here

       try {
           Thread.sleep(200);
           childSpan.setStatus(StatusCode.OK);
           Attributes eventAttributes = Attributes.builder().put("Username", username)
               .put("id", 101).build();
           childSpan.addEvent("User Logged In", eventAttributes);
       } catch (InterruptedException e) {
           childSpan.setStatus(StatusCode.ERROR, "Change it to your error message");
       } finally {
           childSpan.end();
       }
       return true;
   }
}
Run the Application
Run TestApplication.java.
Traces Received in the LogicMonitor Platform

Detailed View of the Trace
Parent Span:

Child Span:

Conclusion
Congratulations, you have just written a Java application emitting traces using the OpenTelemetry Protocol (OTLP) Specification. Feel free to use this code as a reference when you get started with instrumenting your business application with OTLP specifications. LogicMonitor APM specification is 100% OTLP compliant with no vendor lock-in. To receive and visualize traces of multiple services for troubleshooting with the LogicMonitor platform, sign up for a free trial account here. Check back for more blogs covering application instrumentation steps for distributed tracing with OpenTelemetry standards across multiple languages.
Distributed tracing plays a crucial role in maintaining system stability and minimizing service disruptions. By monitoring traces across various components, you can ensure more reliable operation and higher uptime, even in complex environments. Unlock the full potential of distributed tracing with LogicMonitor’s powerful monitoring platform.
The complexity of applications is continually increasing the need for good logs. This need is not just for debugging purposes but also for gathering insight about the performance and possible issues with an application.
The Python standard library is an extensive range of facilities and modules that provide most of the basic logging features. Python programmers are given access to system functionalities they would not otherwise be able to employ. When set up correctly, log messages can pull up a slew of useful information concerning the time and place a log was fired as well as the context of the log.
Python has a built-in logging module that is designed to provide critical visibility into applications without the need for a complicated setup. Whether an enterprise is just starting out or is already fully immersed with Python’s logging module, there is always something new and interesting to learn about configuring this module. Team members will be able to easily log all of the data they need, route it to the proper locations, and centralize all logs for a deeper insight into vital applications.
Contents
- What Is Python Logging?
- Why Printing Is Unsuitable
- Best Python Logging Practices According to Level
- Python Logging Module Advantages
- Python to File
- What Are Python Logging Levels?
- How to Configure Python Logging
- Python Logging Formatting
- String Formatting in Python
- Errors and Exceptions in Python Handling
- Conclusion
What Is Python Logging?
Logging is the way that IT teams track events that occur when software applications are run. Logging is an important part of software development, debugging, and smooth running of the completed program. Without an accurate log of the development stages, if the program crashes, there is a very slim chance that the cause of the problem can be detected.
If by some miracle the cause can be detected, it will be an arduous, time-consuming ordeal. With logging, a digital breadcrumb trail is left that can be easily followed back to the root of the problem.
Python is equipped with a logging module in the standard, yet extensive library that provides a flexible framework for putting out log messages from all Python programs. This Python logging module is used widely by libraries and has become the first go-to point for many developers when logging.
This indispensable module provides the best method for applications to configure a variety of log handlers and a way of routing the log messages to the correct handlers. This makes it possible for a highly flexible configuration capable of dealing with a wide range of different use cases.
Log levels relate to the “importance” of the log. For example, an “error” log is a top priority and should be considered more urgent than a “warn” log. A “debug” log is usually only useful when the application is being debugged.
Python has six log levels with each one assigned a specific integer indicating the severity of the log:
- NOTSET=0
- DEBUG=10
- INFO=20
- WARN=30
- ERROR=40
- CRITICAL=50
To emit a log message, the caller must first request a named logger. This name may be used by the application to configure various sets of rules for different loggers. The logger can then be used to send out simple formatted messages at different logging levels (such as DEBUG, INFO, ERROR), which the application in turn can use for handling messages of higher importance and different from those with a lower priority. Although this may sound quite complicated, it is really simple.
Behind the scenes, the message is transferred into a log record object and then routed over to a handler object that is registered specifically to this logger. The handler then uses a formatter to turn the log record into a string and send out that string.
Luckily, most of the time, developers do not have to be aware of the details. Everything happens seamlessly in the background.
Some developers choose to use the printing method to validate whether or not statements are executed correctly. However, printing is not the ideal solution. It may be able to solve issues on simple scripts, but when it comes to complex scripts, the printing approach is not adequate.
Why Printing Is Unsuitable
The main reason printing is not the ideal solution for logging is because printing does not provide a timestamp of when the error occurred.
Knowing exactly when the error occurred can prove to be an important factor while debugging an application. It might not be as critical for small packets of code that can be run and tested in real-time, but larger applications without an error timestamp will have some serious consequences. One option would be to add the datetime module for that extra information, but this creates a very messy codebase. Here are a few other reasons why you should avoid this method:
- Print messages can not be saved to every type of file.
- Print messages are first converted into text strings. Developers can use the file argument in print to save messages to a file. However, it must be an object with a write (string) method as it is not possible to write messages to binary files.
- Print statements are difficult to categorize.
Take, for example, a log file that contains a large variety of print statements. Once the application has gone through different stages of development and is put into production, categorizing and debugging these print statements is nearly impossible. The print statements may be modified to suit the different stages and provide additional information, but this would add a load of useless data to the codebase in an attempt to force that print to do something it is not suited or built to do.
Best Python Logging Practices According to Level
The standard library in Python includes a flexible logging module built right in, allowing developers to create different configurations for various logging needs. The functions contained in this module are designed to allow developers to log to different destinations. This is done by defining specific handlers and sending the log messages to the designated handlers.
Logging levels are the labels added to the log entries for the purpose of searching, filtering, and classifying log entries. This helps to manage the granularity of information. When log levels are set using the standard logging library, only events of that level or higher will be recorded.
It is important to always include a timestamp for each log entry. Knowing an event occurred without knowing when is not much better than not knowing about the event at all. This information is useful for troubleshooting, as well as for better insights for analytical uses.
Unfortunately, people don’t always agree on the format to use for timestamps. The first instinct would be to use the standard of the country of origin, but if the application is available worldwide, this can get very confusing. The recommended format is called ISO-8601. It’s an internationally recognized standard expressed as YYYY-MM-DD followed by the time, like this: 2021-07-14T14:00-02:00.
Python Logging Module Advantages
The Python logging module provides intelligent solutions for all of these problems.
The format of the messages that are logged can be easily controlled. The module is equipped with various useful attributes that can be included or left out of the log. This leaves a clean, informative log of the stages of development.
Messages can be logged with different levels of urgency or warning information to make categorization easier. Debugging an application is also easier when logs are categorized properly. Plus, the destination of logs can be set to anything, even sockets.
A well-organized Python application is most likely composed of more than one module. In some cases, the intention is for these modules to be used by other programs, but unless the developer deliberately designs reusable modules inside the application, it is likely that the user is using modules available from the Python Package Index and modules that the developer wrote specifically for a certain application.
Generally, a module will produce log messages only as a best practice and not configure how those messages are handled. The application is responsible for that part.
The only responsibility the modules should have is to make it simple for the application to route the log messages. This is the reason it is standard for each module to simply use a logger with the same name as the module itself. This way, it is easier for the application to route the different modules differently, but still, keep the log code inside the module simple. The module only requires two simple lines to set up logging and then use the logger named.
Python to File
Using the logging module to record the events in a file is simple and straightforward. The module is simply imported from the library. The logger can then be created and configured as desired. Several perimeters can be set, but it is important to pass the name of the file where the events are to be recorded.
This is where the format of the logger can also be set. The default is set to append mode, but if required, that can be changed to write mode. Additionally, the logger level can be set at this time. This will act as the threshold for tracking purposes, based on the values assigned to each level. Several attributes can be passed as parameters. A list of parameters is available in the Python Library. Attributes are chosen according to requirements.
One main advantage of logging to a file is that the application doesn’t necessarily need to account for the chance of encountering an error related to the network while streaming logs to an external destination. If any issues do arise when streaming logs over the network, access to those logs will not be lost because they are all stored locally on each server. Another advantage of logging to a file is the ability to create a completely customizable logging setup. Different types of logs can be routed to separate files and then tailed and centralized with a log monitoring service.
What Are Python Logging Levels?
The logging modules needed are already a part of the Python standard library. So the IT team just needs to import logging and everything is good to go. The default contains six standard logging levels that indicate the seriousness of an event. These are:
- Notset = 0: This is the initial default setting of a log when it is created. It is not really relevant and most developers will not even take notice of this category. In many circles, it has already become nonessential. The root log is usually created with level WARNING.
- Debug = 10: This level gives detailed information, useful only when a problem is being diagnosed.
- Info = 20: This is used to confirm that everything is working as it should.
- Warning = 30: This level indicates that something unexpected has happened or some problem is about to happen in the near future.
- Error = 40: As it implies, an error has occurred. The software was unable to perform some function.
- Critical = 50: A serious error has occurred. The program itself may shut down or not be able to continue running properly.
Developers can define their levels, but this is not a recommended practice. The levels in the module have been created through many years of practical experience and are designed to cover all the necessary bases. When a programmer does feel the need to create custom levels, great care should be exercised because the results could be less than ideal, especially when developing a library. This is because when multiple library authors define their custom levels the logging output will be nearly impossible for the developer using the library to control or understand because the numeric values can mean different things.
How to Configure Python Logging
The logging module developers need is already included in the Python standard library, which means they can implement the logging features immediately without the need to install anything. The quickest way to configure the logging feature the way the logger is supposed to behave is by using the logging module’s basicConfig() method. However, according to the Python documentation, creating a separate logger for each module in the application is recommended.
Configuring a separate logger for each module can be difficult with basicConfig() alone. That is why most applications will automatically use a system based on a file or a dictionary logging configuration instead.
The three main parameters of basicConfig() are:
- Level: The level determines the minimum priority level of messages to log. Messages will be logged in order of increasing severity: DEBUG is the least threatening, INFO is also not very threatening, WARNING needs attention, ERROR needs immediate attention, and CRITICAL means “drop everything and find out what’s wrong.” The default starting point is WARNING, which means that the logging module will automatically filter out any DEBUG or INFO messages.
- Handler: This parameter determines where to route the logs. Unless the destination is specifically identified, the logging library will instinctively use a StreamHandler to direct all logged messages to sys.stderr (usually the console).
- Format: The default setting for logging messages is: <LEVEL>:<LOGGER_NAME>:<MESSAGE>.
Since the logging module only captures WARNING and higher-level logs by default, there may be a lack of visibility concerning lower-priority logs that could be useful when a root cause analysis is required.
The main application should be able to configure the logs in the subsystem so that all log messages go to the correct location. The logging module in Python provides a large number of ways that this can be fine-tuned, but for nearly all of the applications, configurations are usually quite simple.
Generally speaking, a configuration will consist of the addition of a formatter and a handler to the root logger. Since this is such a common practice, the logging module is equipped with a standardized utility function called basicConfig that handles the majority of use cases.
The application should configure the logs as early in the process as possible. Preferably, this is the first thing the application does, so that log messages won’t get lost during the startup.
The applications should be designed to wrap a try and except block around the main application code telling it that any exceptions should be sent through the logging interface and not to stderr.
Python Logging Formatting
The Python logging formatter adds context information to enhance the log message. This is very useful when time sent, destination, file name, line number, method, and other information about the log are needed. Also adding the thread and process can be extremely helpful when debugging a multithreaded application.
Here is a simple example of what happens to the log “hello world” when it is sent through a log formatter:
“%(asctime)s — %(name)s — %(levelname)s — %(funcName)s:%(lineno)d — %(message)s”
turns into:
2018-02-07 19:47:41,864 – a.b.c – WARNING – <module>:1 – hello world
String Formatting in Python
With the Python logging formatter, string formatting is made easy.
The old Zen of Python states that there should be “one obvious way to do something in Python.” Now, there are four major ways to do string formatting in Python.
1) The “Old Style” Python String Formatting
Strings in Python are designed with a unique built-in operation that developers can access with the % operation. This allows for quick, simple positional formatting. Those familiar with a printf-style function in C will recognize immediately how this operation works.
For example:
>>> ‘Hello, %s’ % name
“Hello, Mike”
The %s format specifier tells Python that the value of the name should be substituted at this location and represented as a string.
Other format specifiers are available to give the programmer greater control of the output format. For instance, a designer may want to convert numbers to hexadecimal notations or add a little white space padding to create custom formatted tables and reports.
The “old-style” format of string format syntax changes in slight ways when the desire is to make multiple substitutions in one solitary string. Since the % operator only responds to one argument, a wrap in the right-hand side in a tuple is needed.
2) Python 3 Introduces “New Style” String Formatting
Python 3 introduced a new way of doing string formatting that was also later retrograded to Python 2.7. With this “new style” of string formatting, the special syntax % operator is no longer used and the syntax for string formatting is made more regular. The formatting on a string object is now handled by calling up .format().
The format() command can be used for simple positional tasks just like the ones with the “old style” of formatting or it can be referred to as variable substitutions designated by name and used in any desired order. People working in DevOps will agree that this is quite a powerful feature because it allows the order of display to be easily rearranged without changing the arguments passed to format():
>>> ‘Hey {name}, there is a 0x{errno:x} error!’.format(
… name=name, errno=errno)
‘Hey Mike, there is a 0xbadc0ffee error!’
This example also demonstrates that the syntax to format an int variable as a hexadecimal string has been altered. What is needed now is a format spec pass, which can be accomplished by adding a 😡 suffix. Instantly, the format string syntax becomes more powerful and the simpler use cases have not been made more complicated.
When using Python 3, the “new style” string formatting is highly recommended and should be preferred over the % style of formatting. Although the “old style” formatting is no longer emphasized as the be-all and end-all, it has not been deprecated. Python still supports this style in its latest versions.
According to experts in the field discussing this matter on the Python dev email list and the recent issue of the Python dev bug tracker, the “old” % formatting is not going to be leaving anytime soon. It will still be around for quite some time. Official Python 3 documentation doesn’t support this opinion or speak too highly of the “old style” formatting:
“The formatting operations described here exhibit a variety of quirks that lead to some common errors (such as failing to display tuples and dictionaries correctly). Using the newer formatted string literals or the str.format() interface helps avoid these errors. These alternatives also provide more powerful, flexible, and extensible approaches to formatting text.” Source: Python 3
This is why the majority of developers prefer to put their loyalties with the str.format for new code. Now, starting with Python 3.6, there is yet another innovative way to format strings.
3) String Interpolation
With the introduction of Python 3.6, a new way of string formatting was added. This one is called formatted string literals or simply “f-strings.” This new approach to formatting strings allows developers to use embedded Python expressions within string constants. This is a simple example of how this feature feels:
>>> f’Hello, {name}!’
‘Hello, Mike!’
It is plain to see that the string constant is prefixed with the letter “f” — that’s why it is called “f-strings.” This powerful new formatting syntax allows programmers to embed arbitrary Python expressions, including complicated math problems. The new formatted string literals created by Python are considered a unique parser feature created to convert f-strings into a series of string constants and expressions. They then get connected to build the final string.
Look at this greet() function containing an f-string:
>>> def greet(name, question):
… return f”Hello, {name}! How are you {question}?”
…
>>> greet(‘Mike’, ‘are you’)
“Hello, Mike! How are you?”
By disassembling the function and inspecting what is happening behind the scenes, it is easy to see that the f-string in the function is being transformed into something similar to what is shown here:
>>> def greet(name, question):
… return “Hello, ” + name + “! How are ” + question + “?”
The real implementation is slightly faster than that because it uses the BUILD_STRING opcode as an optimization. However, functionally speaking, the concept is the same.
4) Template Strings
One more exceptional tool for string formatting in Python is the template string method. This is a simpler, yet less powerful mechanism, but when it comes to functionality, it could be the answer developers are looking for. Look at this simple greeting:
>>> from string import Template
>>> t = Template(‘Hey, $name!’)
>>> t.substitute(name=name)
‘Hey, Mike!
The template class from Python’s built-in string module had to be imported. The template created this code quickly and easily. Template strings are not a core language feature, but they are supplied by the string module in the standard Python library.
Another factor that separates this format from the others is that template strings do not allow format specifiers. This means that for the previous error string example to work, the int error number will have to be manually transformed into a hex-string.
So, when is it a good idea to use template strings in a Python program? The best case when template strings should be used is when the situation calls for the handling of formatted strings that users of the program have generated. Since they are not very complicated, template strings are often a much safer choice when catering to a novice audience.
Errors and Exceptions in Python Handling
Syntax or parsing errors are the most common alerts. The parser will repeat the incorrect line and point to where the error was first detected. This can be easily fixed by simply inputting the missing data.
An exception occurs when an error is detected during execution. A statement may be syntactically correct, but the function was unable to be completed. This is not a fatal error and can therefore be handled easily. However, the program will not handle the problem automatically. The programmer will have to find the line with the mistake and solve it manually.
Alternatively, the program can be written to handle certain, predictable exceptions. The user will be asked to enter a valid integer. However, the user can interrupt the program with the Control-C command or the try statement.
This is how the try statement works:
- First, the “try clause” (which is the statement between the try and except keywords) is put into action.
- If an exception does not occur, the except clause is ignored and the execution part of the try clause is completed.
- If an exception does occur during the execution of the try clause, all other parts of the clause are skipped. If the type matches the named exception after the specified except keyword, then the except clause is put into action. The execution then continues after the try clause.
- In the event of an exception occurs which does not match the named exception in the except clause, then it is passed on over to an outer try statement. When a handler is not found, it becomes an unhandled exception and the execution phase stops, and an error message is displayed.
A try statement will often contain more than one except clause to better specify handlers for various exceptions. However, at the most, the execution process will only be for one handler. A handler will only handle the exceptions that occur within the corresponding try statement, not the exceptions occurring in other handlers of the same try statement. The except clause will often name multiple exceptions enclosed within as a parenthesized tuple.
Conclusion
Python is such a popular language because it is simple to use, extremely versatile, and offers a large ecosystem of third-party tools. It is versatile enough to accommodate a wide variety of case scenarios, from web applications to data science libraries, SysAdmin scripts, and many other types of programs.
Python logging is simple and well standardized, due to its powerful logging framework built right into the standard library.
Every module simply logs everything into a logger record for each module name. By doing this, it is easier for the application to route all of the log messages of the different modules to the right places.
The applications are then able to choose the best option for configuring the logs. However, in modern infrastructure, following best practices will greatly simplify the entire process.