At LogicMonitor, we build with the customer in mind. We continue to iterate on the design and development of our platform to deliver a modern and intelligent customer experience. With that in mind, did you catch the important announcement in the Looking Ahead section of the v.175 Release Notes? The note announced that “LogicMonitor is in the process of rolling out a new user experience (UX) for customer portals. The new UX is designed to streamline workflows, reduce clicks, and includes new features.”
As we roll out this notion, we are excited to announce the first phase and our latest enhancements to the Topology Mapping offering. For this release, LogicMonitor has overhauled the main Mapping page and added new network interface mapping features.
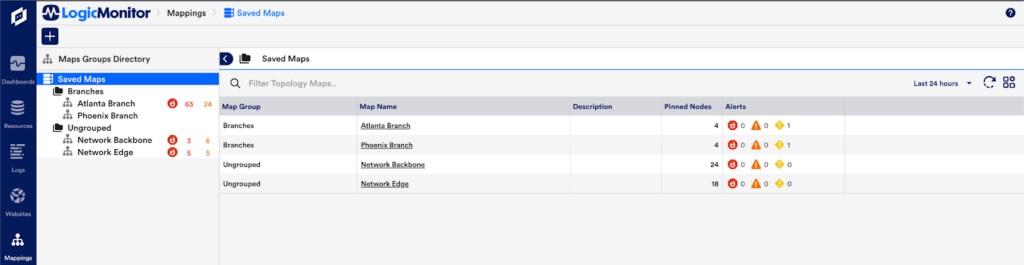
Saved Maps
The new experience makes it much easier to find and switch between your Saved Maps when troubleshooting. Just click on a map in the tree and it will load in the canvas. We’ll also summarize the alert counts in each saved map and show them on the main screen so network admins can prioritize where they need to go at a glance.
Interface Mapping
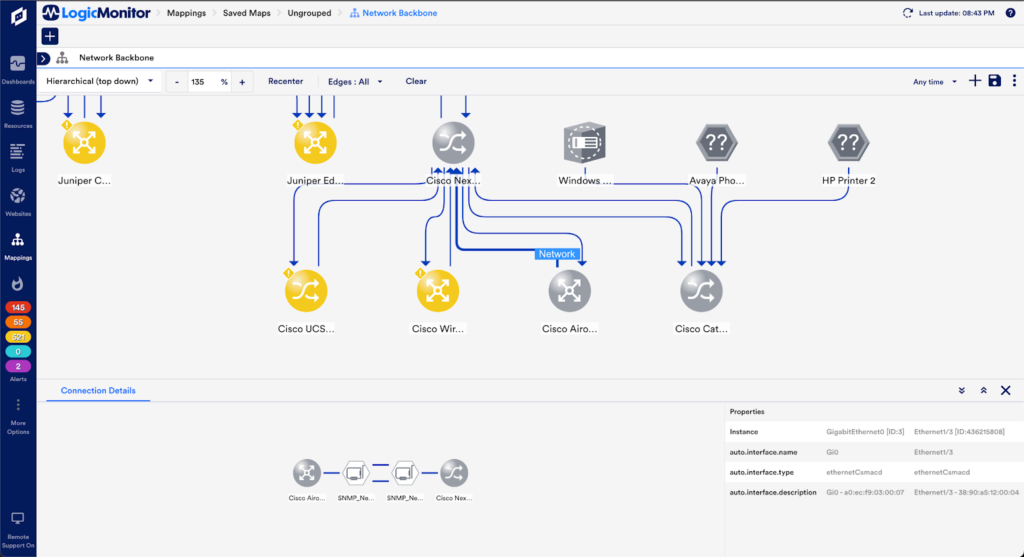
Once you’ve selected a map, you’ll notice the new network interface related features. When clicking on a “Network” or “Routing” type edge in the canvas, you’ll see a new “Connection Details” pane at the bottom:
As you can see above, we’ve selected a “Network” type edge between two Cisco devices. Our “Connection Details” pane opens up at the bottom to show us the details of which interfaces are at either end of this connection. Having this information at your fingertips when troubleshooting will help save you a click out to the Resources page, a session on a router console, or perhaps even a good old-fashioned trip to the wiring closet to trace a cable by hand. We’ve included other relevant interface information as well, including all other auto.interface properties when they’re available.
Explore Maps
On the subtler side, you’ll also notice that your context is preserved when clicking “Explore Maps” in the “Maps” tabs available in Resources and Alerts! If you’ve ever tried to jump from either of those pages to the Mapping page after making changes, you’ve likely been disappointed to find all of those changes blown away. With the new “context preservation” enhancements, you’ll be able to seamlessly troubleshoot your network visually regardless of your entrypoint (Mapping, Resources, or Alerts pages).
While that wraps it up for now, we have a list of great Topology enhancements coming in the near future, so stay tuned. In the meantime, get out there and explore some maps!
More Information
With LM Envision, we can bring together comprehensive monitoring capabilities and enable observability across your data centers, public/private clouds, and applications. LM Envision provides correlation, context, and clarity to understand the business impact and causes of complex IT incidents.
Learn more about how to set Interface mapping here and check out the documentation on the new Saved Maps Landing Page here.
Looking Ahead
Stay tuned as we continue to roll out updated features for LM Envision’s new and modern user interface, so you can focus on what matters most: innovating faster while improving the operational efficiency of the critical IT services you deliver.
Disclaimer: The views expressed on this blog are those of the author and do not necessarily reflect the views of LogicMonitor or its affiliates.