Guide to Monitoring Custom Metrics on AWS EC2 Instances


Proactively manage modern hybrid environments with predictive insights, intelligent automation, and full-stack observability.
Explore solutionsExplore our resource library for IT pros. Get expert guides, observability strategies, and real-world insights to power smarter, AI-driven operations.
Explore resourcesOur observability platform proactively delivers the insights and automation CIOs need to accelerate innovation.
About LogicMonitor
What is the process for monitoring custom metrics on your AWS EC2 (Amazon Elastic Cloud Compute) Linux instances? The easy way is to use a LogicMonitor collector to monitor your Linux servers, which will provide much more detail and metrics than AWS monitoring provides. Using a collector means its easy to write your own datasources to extend what is collected, using all sorts of mechanisms (JMX, snmp, WMI, database queries, JSON or other HTTP output, etc.) – although you probably won’t need to.
However, if you don’t want the complete suite of LogicMonitor monitoring on your devices, and just want the cloudwatch metrics to show in LogicMonitor, LogicMonitor’s AWS integration will automatically pull in all the standard Cloudwatch metrics. But if you want to extend the Cloudwatch metrics – we’re going to use custom EC2 Linux memory metrics as an example (one of the standard metrics the Collector would get automatically for you) – and pull them into LogicMonitor, this step by step guide will show you how to do it.
As background, the default metrics for each of your EC2 instances are comprised of CPU, Disk, Network and Status. AWS provides the option, for a price, to add custom EC2 metrics to CloudWatch. This requires some configuration on the EC2 instance, within AWS itself, and through adding new datapoints to the existing EC2 datasource in your LogicMonitor portal. If you add AWS tags to your EC2 instances that are defined as Linux, it will make it easier to apply multiple EC2 instances to the new datasource that will be created.
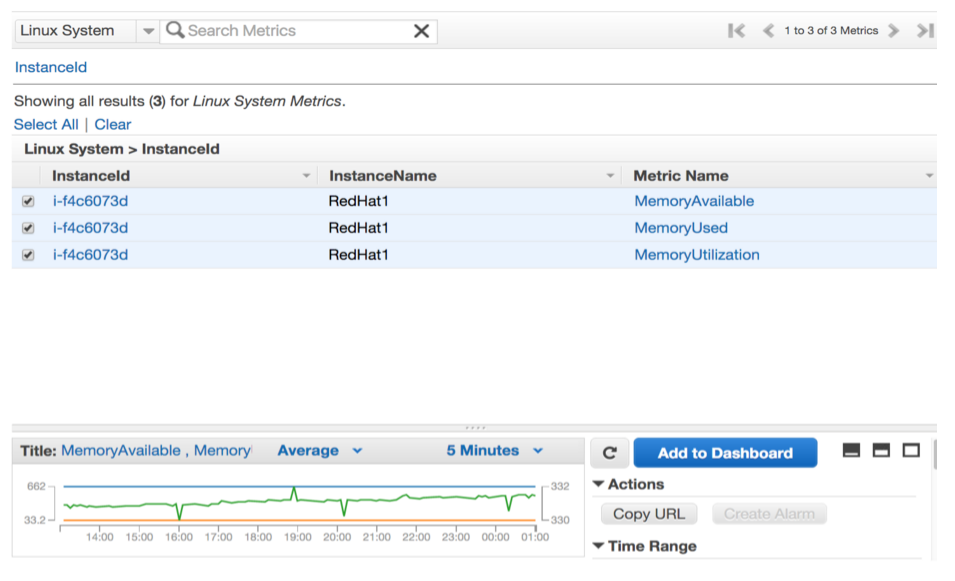
To note, this blog post assumes you have taken the time to set tags. For this example we have used the AWS tag, “system.aws.tag.OS,” and set it to “Linux”. Check out this AWS article to learn how to setup the custom metrics for memory on the AWS EC2 Linux, and verify that the new custom metrics are visible within cloudwatch (illustrated in the image below).
Step 1: Setup Your AWS Account in LogicMonitor
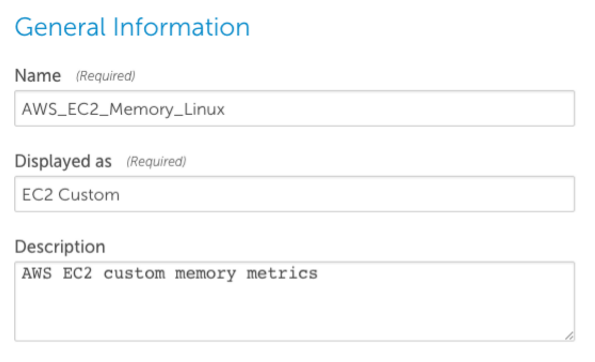
Step 2: Clone the AWS EC2 Datasource in LogicMonitor (see image below)
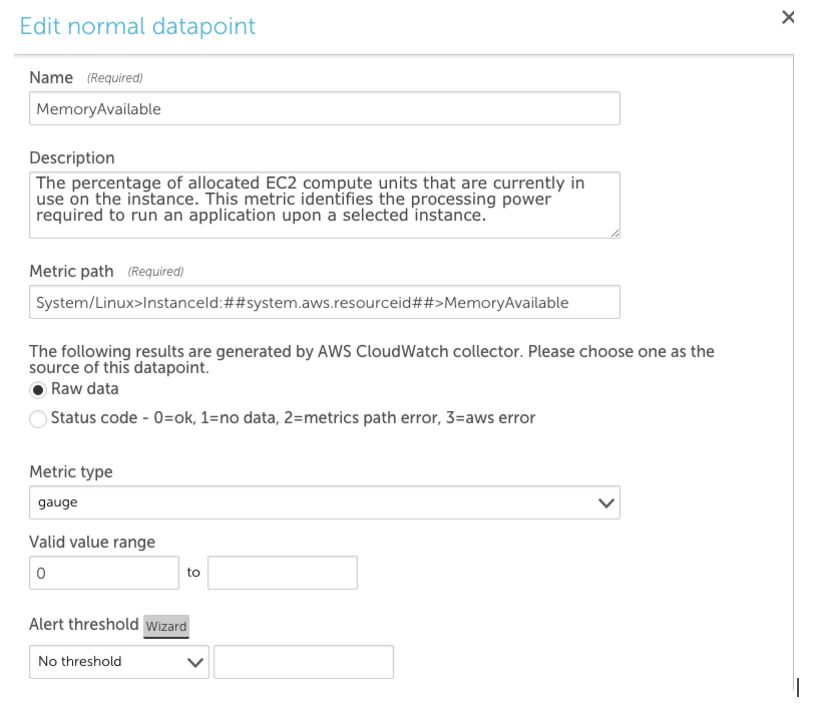
Step 3: Clone the CPU Utilization Datapoint and Change the Metric Path and Name (see image below)
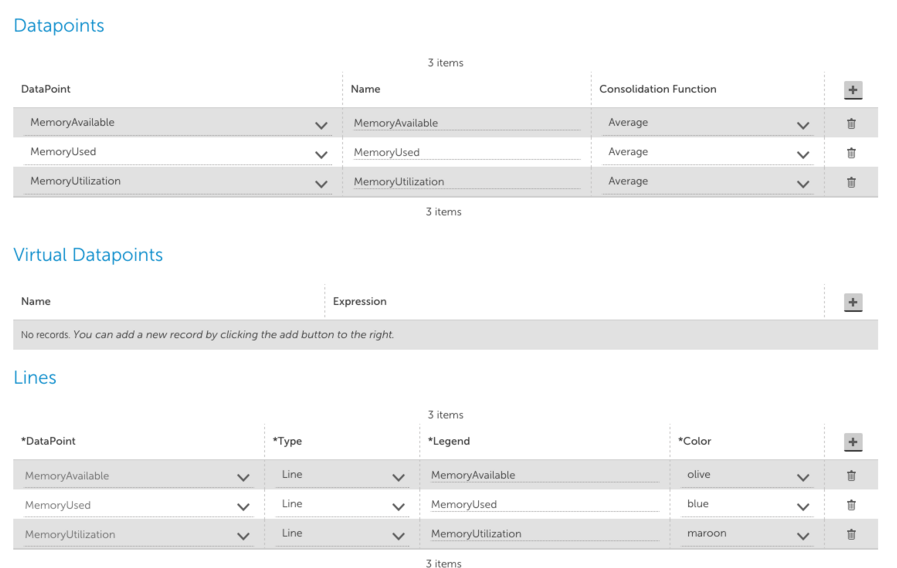
Step 4: Add a New Graph for Memory to the Datasource Showing New Values and Existing Graphs (see image below)
Step 5: Selecting EC2 Custom Instance in Devices Tab (see images below)
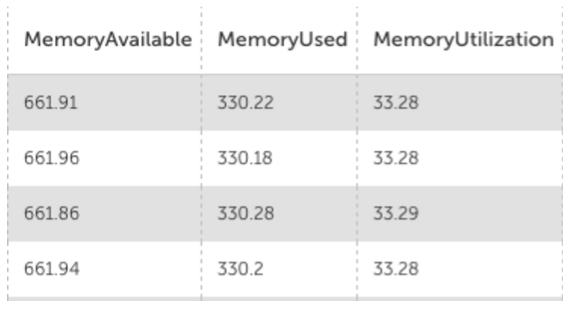
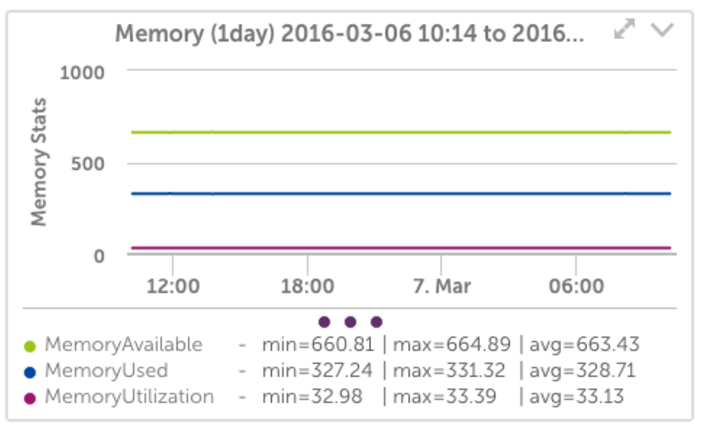
That’s it, enjoy your new EC2 memory custom metrics in LogicMonitor!
© LogicMonitor 2025 | All rights reserved. | All trademarks, trade names, service marks, and logos referenced herein belong to their respective companies.

