“Good afternoon, everyone. Thanks so much for joining us, as our recap of the Elevate community conference session here that I’m leading on application visibility.
And it’s an interactive session. It was live, and so I will make references to that. But for those of you who may or may not know me, I am a product architect here at LogicMonitor.
I curate our l m logs road map, and kind of, drive the direction in which we add new features and capabilities and also clean up some of the existing things we have. Additionally, I’m an advisor into some of our other areas of logic monitor as well. Things like service insights, web checks, and some of the other fringe components that kind of collectively are gonna make up the topics that we’re gonna group together in something that we call application visibility.
And we’re kind of directing this from the lens of application monitoring without needing to get into APM and tracing.
So welcome, and thank you for attending.
Just a quick disclaimer here. We are gonna be talking a little bit into the future, and this is a safe harbor. So what that means is we’re gonna be sharing some confidential and proprietary information based around our road map. These materials should not be distributed, should not be, you know, put outside of the context, of this session.
Okay. So this is kinda gonna drive the discussion today and where we’re gonna kinda walk through.
So today, we’ve got a lot of capabilities that are on the truck today, and that’s around the existing things that we can do with data source metrics, infrastructure monitoring, logging data that we can pull in for some of these things. So we’re gonna showcase what we have today, but then we’re gonna talk about where those challenges are, meeting those requirements that are specific to applications. And then we’re gonna talk, get into the future, what we’re trying to build, what we’ve workshopped with customers, had a lot of sessions, interactive sessions, and gathered these requirements.
And we’re gonna talk about what we’re looking to do with this so called application visibility for IT ops. What does that mean, and what does that roadmap kind of look like? And at the very end, we’re gonna show you, a dashboard example of the Zen world that we’re trying to create for you, to kind of fulfill this roadmap.
We’ll take a little q and a at the end.
But let’s move into, kind of the poll. And as we did these live sessions, we we kind of asked the audience, are you familiar with service insights today? Are you using it today? And and, you know, sort of almost as expected, only a few hands went up. People had awareness. They saw the icon and the navigation pane on the left hand side of their logic monitor screen, but they really weren’t using it. And if they were using it, it more than likely wasn’t necessarily being used for application type services.
It was maybe more around, like, network infrastructure type services, DNS services, things like that. So no surprise in the results there.
Second question was, are you using l m logs?
Again, only a splattering of hands went up across the room. That was kind of to to be expected.
And then, you know, that give us some insight, like, you know and if you are using l m logs, are you ingesting application logs? What we found is very, very small portion of the audience actually doing this. Most folks were collecting things like syslog from network devices, maybe Windows event log from some Windows servers, and a few folks were actually ingesting some application logs. So, again, awareness, but not really using it, in these specific sort of focused intent.
Last question, are you using l m web checks? Right? These web checks, kind of a synthetic light, if you will, end user monitoring type capability, that’s embedded in logic monitor today already available to customers, basically pointed at a website. And is that website up or down? I got quite a few hands on this one. So this told me that folks were using web checks for a variety of ways, web check checks or ping checks.
So these are were important to just kinda gauge the room. Like, do you have awareness of what we have today and what sort of, you know, things are available with the element vision platform?
So then we kinda move over here into, you know, what are these items that we do have available today because we do a lot of different things. The platform has grown exponentially over the past several years, adding things like Edwin and events intelligence.
But we’ve always had stuff like service insights that’s been around. Resource explorer is new, kinda tracking that here in the middle.
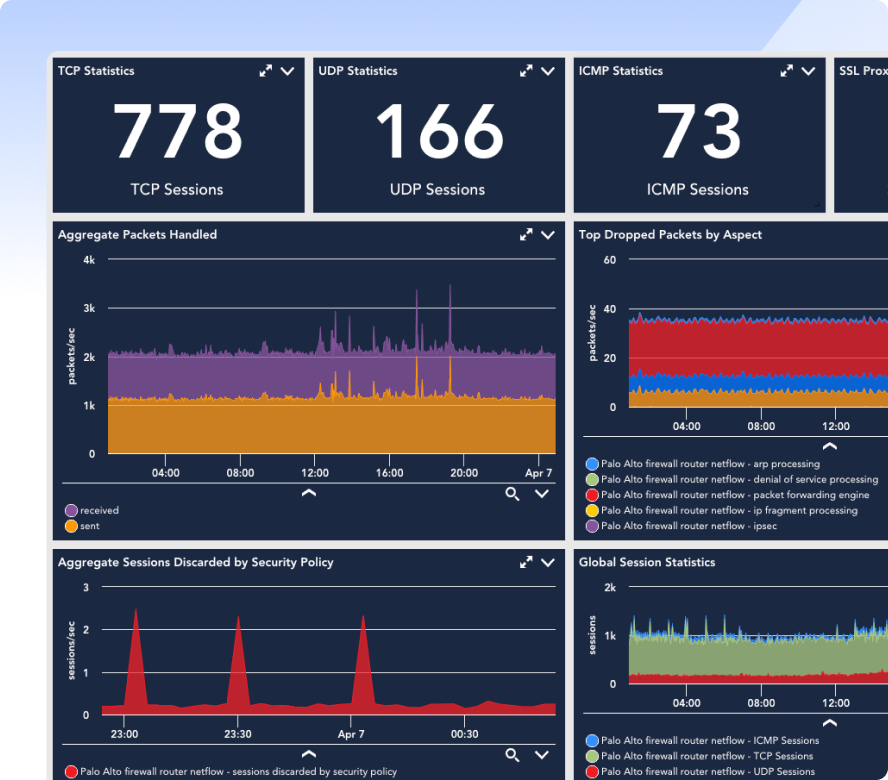
We’ve got dashboards and anomaly detection capabilities, a lot of great log capabilities, and we can narrow this in on an application server. I can tell you a lot about the health of that operating system, the application server. I can even use some custom data sources, maybe monitor some application specific services and metrics, do some alerting and triggering around that. And I can also ingest those application logs and then put a big bow around it by putting a web check-in front, in my up or down, and then wrapping that all inside of the service insights group so that I can wait and have more intelligent type alerts.
Right? Use KPIs to say, one web server’s down, but they’re not all down, and my app is still functioning. So that shouldn’t be a critical alert, but we’re gonna go investigate it and fix it. So these are the type of things that we can do today.
We also have APM and tracing capabilities, around certain types of applications. We can offer that as well. So we’ve got all of these bits and pieces and chunks and parts, but what we’re really sort of kind of missing is that capability of pulling it all together in that dashboard view that shows me every element of all of those different pieces that I just talked about of pulling it together into a singular view, that single pane of glass sort of flattening the view for everybody.
So that’s what we kinda uncovered when we, you know, had this discussion in the room. We said, okay. So you have awareness of some of these features.
However, you’re maybe not using them all. What are the reasons why? Like and and we could kind of dive into each and every one of these particular segments. So we ask specific, like, questions in the room.
Are you monitoring with APM tooling? A lot of people put up their hands. APM is an important part of critical tier one applications. Those most important, usually revenue generating customer facing applications, they’re the most critical portion of your business.
That’s usually where we find that APM is deployed, full tracing. There’s a series of vendors. There’s four or five core vendors, that kind of control and are the best in this space, and that’s usually the vendors that we see in place.
What about logging tools? We we all know that there’s a lot of logging companies out there.
So maybe I can’t I don’t have the expertise or maybe I don’t have the budget or the know how to put APM on all of my apps. So I may lean on logging tools like Splunk to dive a little bit deeper into my application logs, maybe turn those logs into some metrics and monitor my application that way. That sort of avoids the expertise need, the cost, and the APM tooling piece that’s required. So that’s another thing that we asked. The attendees in the in the audience, we were seeing a few more hands here.
Not as many as APM, but a little bit less hands, for sure. And then, well, last but not least, well, what about just basic monitoring? Right? Like, yes, it’s part of an application, environment in in infrastructure.
We can put that in a nice service, but am I just pinging it? Am I pulling it? Am I getting basic infrastructure metrics? All the hands come up here. So everybody’s monitoring these systems in some way, but just not holistically from its function to the business. We’re really looking at it from the lens of, is this one particular component up or down? It’s important to know that, but that’s not as important if the entire service is up or down.
So we kind of saw the results here, but then we started to say, okay. Well, so what are the what are the challenges here that we we’ve uncovered? So this comes from lots of workshopping with customers, interaction in the session as well, and that when the hands went up for the first question around APM tooling, right, that doesn’t mean everybody in the room was an APM expert. What that meant is that their company has people that have deployed APM, Usually, heavy professional services engagement requires a lot of expertise, but, boy, it gives you the deep level of visibility that you need.
You can absolutely pinpoint in on where those performance challenges are. So when I do have something that’s it’s not down, but it is experiencing slowness, this is the the the very best way in which to triage and diagnose right to the layer of code where my slowdown is occurring. But with that comes great cost. These are very, very expensive solutions.
This is why we tend to see them only on about twenty percent of applications in the typical enterprise. Some cases, far less. Maybe it’s only one, two, three, maybe four, or five applications. Right? So they may not go deeper into that next level set of applications.
They they just don’t have the time or the expertise.
But then we’ve got this secondary set. So what about those tier two apps?
I don’t wanna put APM on it because I don’t have enough people to deploy it and maintain it. I don’t have the right expertise. I don’t have budget to buy more APM tools.
And is there a way that maybe I could do this with just log level visibility? Maybe I can grab the so called red metrics, rate, error, and duration. Those are typically generated by APM tools, but you can also get that sort of data out of a log sometimes.
Also, other metric capabilities like eBPF, kernel level metrics. So maybe I can get some things here. So this we saw about thirty percent, of customers’ applications might fall into this bucket, and that’s how they’re kind of, covering that.
The last chunk, the bottom of the ice the iceberg, what’s underneath. So this is the lowest level component level monitoring.
This is really where logic monitor our strength and where we were kind of born and bred out of. This is what we’re very good at doing, discovering devices, monitoring them as individual components, telling you whether it’s up or down, collecting performance metrics, and giving you an idea. We’ve since added some login capabilities to now give you some root cause.
But, essentially, you know, we’re just telling you if that device is up or down. And that’s that’s the gap and the challenge is that I need to know how this one device, is important to the next device over, the next device over, and what service are they actually supporting.
Is this my my banking application? Right? How many web servers do I have? How many application tier servers do I have?
What does the back end database look like? And, of course, all of the network connectivity between that. Maybe some of these things live in the cloud, some are, physically on prem, and we’re talking about hybrid. And this is, again, where logic monitor really shines.
So we’ve got these three different ways in which we we’ve uncovered that customers are deploying various tool sets. And how can we start talking about maybe bridging this gap a little bit and moving that fifty percent needle up closer to what APM actually does?
So we start talking about the requirements, and this was a fun exercise in the room. We we like to ask customers, you know, what would be your requirements. Right? If we know that tracing does everything and and pinging and pulling and infrastructure monitoring with infrastructure metrics, does better than nothing, but it’s somewhere in the middle. Where could we find? And the the answer was customer said, we just need something that’s good enough.
It it will get deeper into what does good enough mean because that that’s that’s a very ambiguous term.
Easy to deploy. Right? I don’t want to have code level expertise and engineers and and developers required to deploy the solution or tons of professional services. And then when the the the the, the engagement is done, those architects, they leave, and now you’re left to kinda maintain that yourself.
But can we align this closer to the IT ops persona, not the dev persona? That’s where logic monitor usually sits in the data center and in the NOC. We’re much closer to IT ops personas. And so the this is our audience that we’re talking to here.
Can I get those red metrics, those reporting rate, error duration? Those are indicators of the health and the performance of my application.
Also, can I metricize logs? What does metricizing log mean? That’s really just a fancy word of I would like to take raw, ugly log data, turn it into a metric for the purposes of trend analysis, pretty pictures and dashboards, and can I deploy alerts against that? Can I say, hey?
If this value goes higher than normal, give me a trigger. If it goes lower than normal, give me a trigger. These are leading indicators that I’m having a performance issue. Of course, basic infrastructure metrics, that’s a given.
That’s where we shine. We’re excellent with those things.
As I mentioned, log data in context. So when I’m having a metric, CPU is high. I’d like to know why. That answer is in the logs.
We use anomaly detection, and we stitch that together. At the end of the day, you cannot break the bank. Right? This needs to be economical.
As I mentioned, tracing tools and APM tools can fulfill all of these requirements. However, they come with a very, very high cost, a high personnel cost, and a very long time to value. It takes a long time to deploy and roll these tools out.
So we’ve uncovered some of these. Here’s here’s our little word cloud. Right? So the when we kind of track this, the thing we kept resoundingly here over and over, you can see it pop to the front.
Good enough. Good enough. Good enough. Okay. So as a product architect, I need to uncover what what what product features, what things do I need to build and stitch together between the various areas of logic monitor to determine what is good enough.
So if we drill just a little bit past that and we start to talk about, okay, well, what is good enough?
Application logs and errors. Very important. Tells me my app is healthy or not healthy. Are my logs clean or dirty?
If I have dirty logs with lots of error codes, that’s an indicator that I’m either experiencing problems now or about to experience some problems. So very important. We uncovered that as something that everybody said was good enough. Application response time.
Not only are you up, but are you responding? Right? Can we can we pull that type of data back in?
Availability of the app service from various points of presence. So if we’re gonna do something like a web check, can I do it from lots of locations? Maybe it’s performing well in America, but in Europe or EMEA, we’re experiencing performance degradation issues from there. So I need to be able to track this application response time in service from various areas and points of presence globally.
Application metrics. Where are we kinda getting into the weeds here? We’re talking about, load balancer versus web server. Can I pull these things together in sort of like a service level view? I can see all of the components that make up that application being able to kinda pull and aggregate that together.
Then can I get service level alerts? I don’t just wanna know that CPU is high on box number one. What I want to know is what is the response, of of the application right now. Is box one being down impacting my service level or not? But then box two goes down. Okay. Now maybe that’s a more severe incident, and I need something that’s a more critical based service alert.
Consolidated dashboard views, I want pretty pictures to pull this all together, and be able to consume it in an easy way. I don’t wanna look at raw logs. I I don’t wanna look at thousands of alerts. I wanna come into work on a Monday, open up my dashboard of Acme app, and I wanna look at that and understand, am I good today? Am I not good?
So what else? Did I miss anything here? We kinda talked through these things. But the thing that stands out to me most about when we dove into good enough is I did not hear things like tracing. I did not hear that I need rum or real user monitoring.
I didn’t even hear the words eBPF in a lot of cases. Sometimes some of those kernel metrics came forth. So I looked at this set of, of of of good enough items and said, I can do all of these things in various areas of the product and platform, but how can I pull that together? So now I have a better picture of what I can do. So as we start to kinda analyze, I’ll kinda, you know, say where we’re gonna focus this idea of application visibility for IT ops. So this is what we’re trying to build now, is we’re trying to build an application monitoring solution that’s focused on the IT ops persona. You do not need to be a dev or an engineering level, person to deploy the solution.
We are not gonna focus on those tier one apps. That is APM world, APM land. We’re not gonna try to dive into that space. What we’re gonna focus is on that thirty percent where customers were trying to use a logging tool maybe to get some data, and then that other fifty percent where we’re only pinging, pulling, and grabbing basic infrastructure metrics.
That’s the space that we’re really trying to look at. Again, I don’t want you to be a dev or an engineer to have to be able to understand this, to deploy it, to maintain it, to make changes to the environment. We need this to be simple. And, again, I don’t wanna break your bank.
Right? So this is the, the the the goal and the outcome of what we’re trying to deliver with application visibility for IT ops.
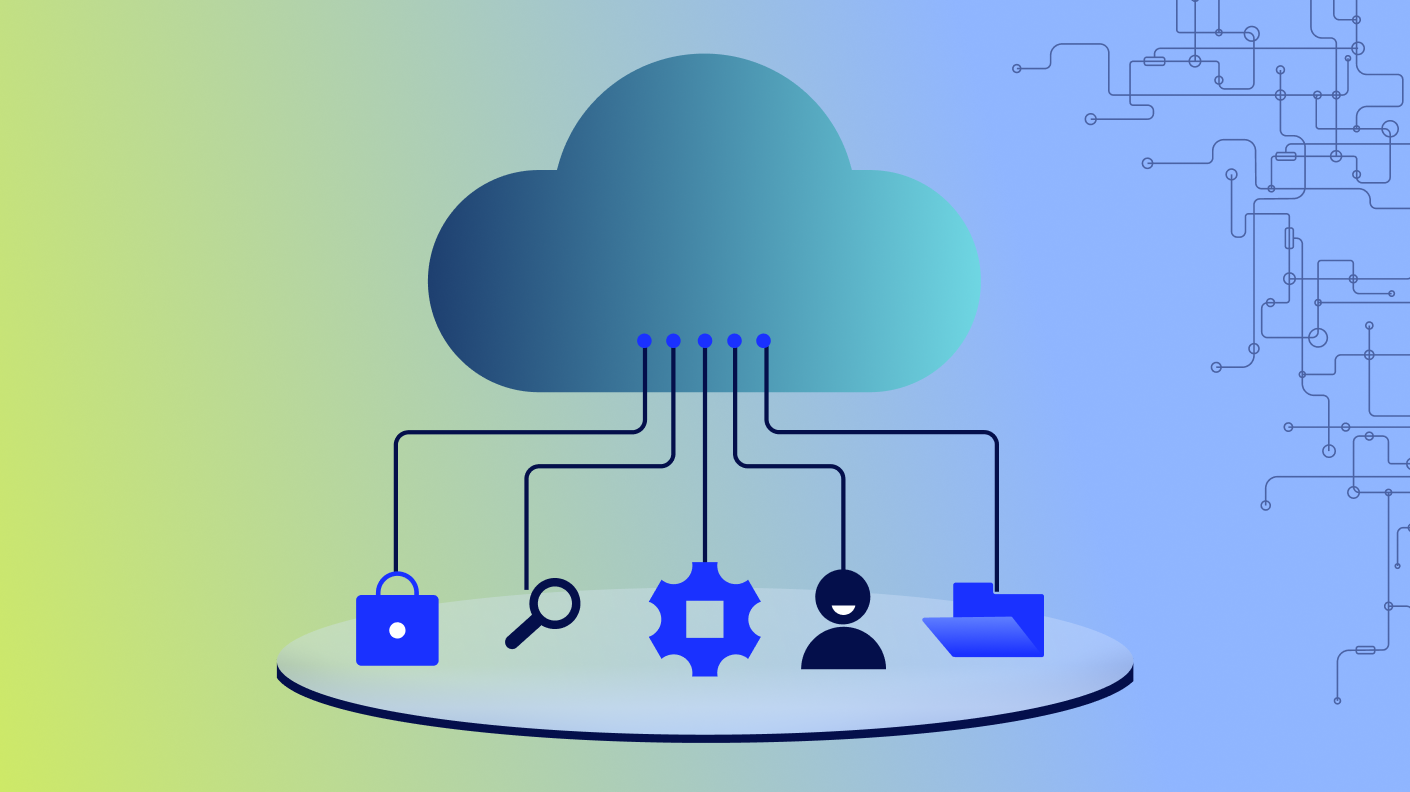
So now let’s talk about the areas of the product that exist and and then and then feature improvements underneath that that we need to up level and and make the entire sort of package come together. So there’s three core areas that I need, to all work sort of in harmony, and each one of them need to improve in various ways to be able to deliver, those requirements that we uncovered that are good enough. So service insights, web checks, and logs. These are the three core areas of logic monitor we need to get better at.
So on the service insights to the far left box, we need some rules. We need some easier out of the box templates that help me group things together more quickly. You can do this today, but it is a manual process. It can be cumbersome, and that’s why a lot of customers have not really dove into service insights in the rule capability.
But this allows me to group, these services these systems together that make up a service, prioritize the most critical elements of that, and have KPIs and smarter alert conditions.
So I need to up level what service insights can do. And so that’s part of our roadmap plan for twenty twenty five. These things are already being built and in progress. But then I need to also improve those integration capabilities. We’ll talk a little bit more about that in a second.
Web checks. So web checks have been around for a long time at Logic Miner. However, there were some gaps. Customers frequently told us that there were problems with some of the alert tuning issues.
Dynamic thresholds were not supported, improved widgets. They want better visual capabilities, and they wanna do things like custom properties and custom graphs. All of this stuff that you’re used to doing with a resource.
So what we’ve done is we’re taking on the initiative to turn a web check once we’ve created it to basically turn it into a resource and logic monitor. And now we can kind of unlock all of those same capabilities, that you use, like the dynamic thresholds, alert tuning, custom properties, custom graphs, all of that good stuff that greatly enhances the visuals and capabilities that we can now put on a dashboard widget. Again, this is something that’s underway. We’re already in the process of building this and working towards this, in improving and up leveling web checks. And then last but not least, the far right hand side, this is the area of the road map that I specifically curate.
So aiming these improvements. One, I need to get the data in easier and better. So we’re improving some things around our hotel collector. We’ve also already added integration types for Logstash, Fluent Bit, and Fluent d. So the main thing that we’re trying to do first and foremost, let’s get the logs in as quickly and as easily as possible. That’s g e I. The easier I can get the data in, get data in, the faster I can start getting value out of that data.
Deploying an agent onto a box to get some application logs is something that an IT ops persona can do. You do not need to be a dev or an engineer to do that. Then I wanna collect that log data, and I wanna be able to metricize it and turn it into something that I can graph, dashboard, and make look appropriate. Similar to, like, we talked about web checks with resources. We wanna do a similar sort of thing using the concept of query tracking, which is I’m gonna write a query, focus in on the error codes or the issues, the things that I want to uncover, and I wanna count them up, turn them into a metric. And I wanna be able to put that on a dashboard so I can have, some major improvements underway with the logs dashboard capabilities.
Log partitions, being able to slice and dice data and retain application logs for a shorter time because they’re larger in volume, adding an in product query library, and a place where I can sort of publish things to a user around maybe IAS, for example, and give you some examples of queries that you could or should be using, that you could metricize those, query track them, and turn them into visuals.
And last but not least, we’re adding queryless logs capability. If you’re not a power user or an expert in the query language, we can start to use native and chat GPT type tools to help write those queries for you. So I add all of these improvements together, and as each one of these areas sort to level up, we start to get into, our our examples of good enough.
So assuming I can do all of those things and I can build all of the stuff that’s on my road map, successfully pull that together, this is the example of what’s good enough. Right? I see some basic business metrics. How many customers are active in my system right now?
I can pull that from an application log. What’s going on with some of my metrics and some of the pieces, in the environment? These things typically come from APM. These are easy metrics in APM, not as easy from a log, but we can actually do that and pull some of these red metrics out of the data, like duration, error codes, things of that nature.
But then I need some topology, and that’s where service insights and these topology views come together. So in this case, we’ve got a a boutique shop as the name of our application. We’ve pulled it together. I see I’ve got some some orange or some red here.
I see the the the status is below based on alerts. But my service at the top, I’m still good. I’m still a hundred percent. I need to investigate these things, but I’m not triggering a bunch of alerts, and my customers are not impacted.
So this is really the example of good, at a high level. So this is that application owner that comes in on Monday morning. But maybe I wanna go a little bit deeper, and I need some additional metrics, and I wanna go deeper into the logs. These are things again, these would be pretty straightforward coming out of an APM tool.
However, I can get a lot of this data from logs. And so the log data, you could start telling me trending about, the, you know, the overall number of error codes, issues I’m seeing, the duration of a transaction.
These are all things that I can extract those metrics from the logs, turn them into a picture here, and then also apply, dynamic and static thresholds against the values. I do all of that together. I’ve kind of pulled together the full story, and I can get this type of data from logs, web checks, wrap a bundle around it with service insights, display it on a dashboard, and I never had to use traces or APM tooling to do so. So that’s sort of the summary of what we pulled together. So just recapping, folks that want to see demos, reach out to the teams. We can get you demos of where we are in the road map. We’re still in that feature build process.
Okay. And if you would like to provide feedback on this session, please scan the QR code, and we thank you very much for attending.
If you were not able to attend live, maybe you can catch us in Sydney, or in London, or we’re doing secondary sessions and follow-up on this. So thank you again to everybody. Appreciate the attendance.
We’ll see you next time.”