Juniper Networks
Juniper Networks, Inc. is an industry leader in network innovation. The company develops and markets networking products, including routers, switches, network management software, network security products, and software-defined networking technology.
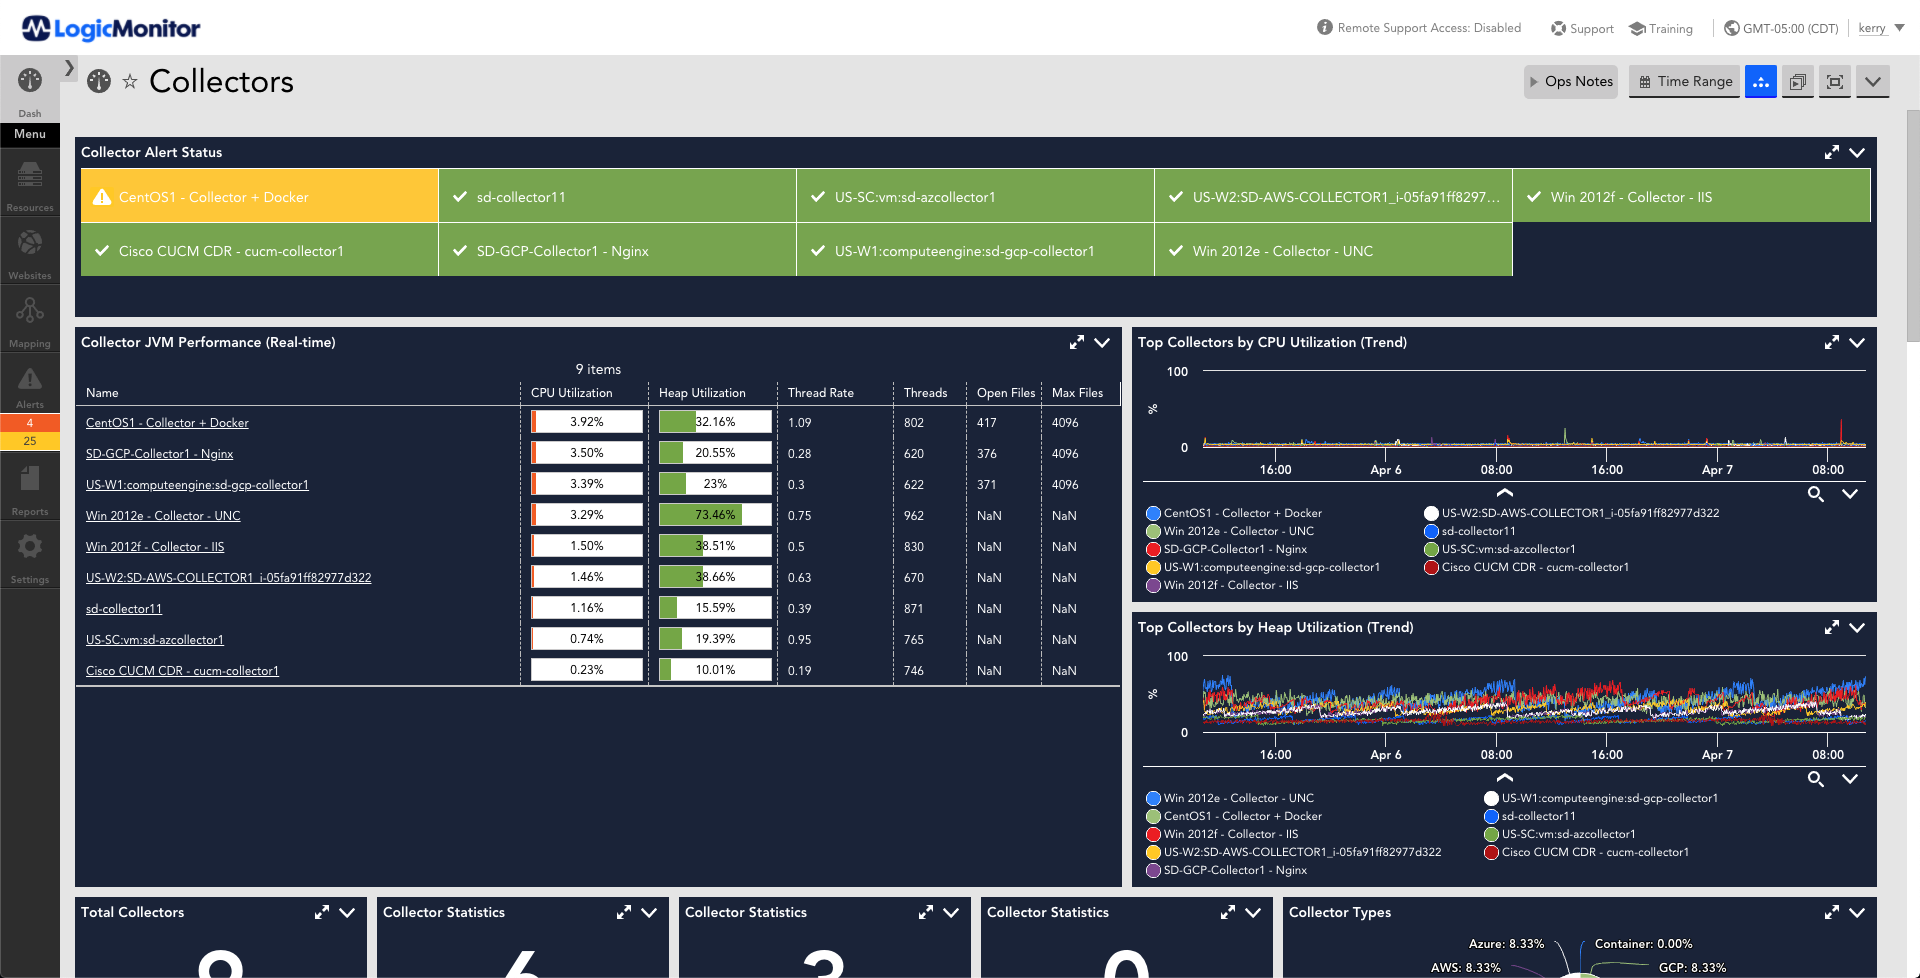
With LogicMonitor you can monitor all of you Juniper equipment in the same platform as your other IT infrastructure – including on-premise, cloud, and hybrid infrastructure – allowing you to spot issues before they become widespread business problems and to easily correlate performance anomalies across multiple systems to simplify root-cause analysis.
LogicModules are included out-of-the-box to monitor critical performance metrics and provide dashboards that show pertinent data to your IT Operations team.

Better scalability
LogicMonitor’s cloud-based platform monitoring of Juniper devices across distributed networks to scale as your organization does.
Faster troubleshooting
Gain quick identification of the root cause of network issues, allowing for faster troubleshooting and resolution.

Improved compliance
Maintain a secure network environment. By monitoring Fortinet devices and alerting administrators to potential security threats, LogicMonitor is built to help.

Cost savings
Monitoring with LogicMonitor helps optimize network performance, reduce downtime, and avoid costly outages.

Streamlined SRX Monitoring
Setting up SRX monitoring with LogicMonitor is as simple as enabling SNMP on your device and setting the proper SNMP community when adding it to LogicMonitor. ou can configure SNMP within the web browser, or the command line interface on your SRX hardware. In minutes you can get monitoring for all your network security devices and so much more!
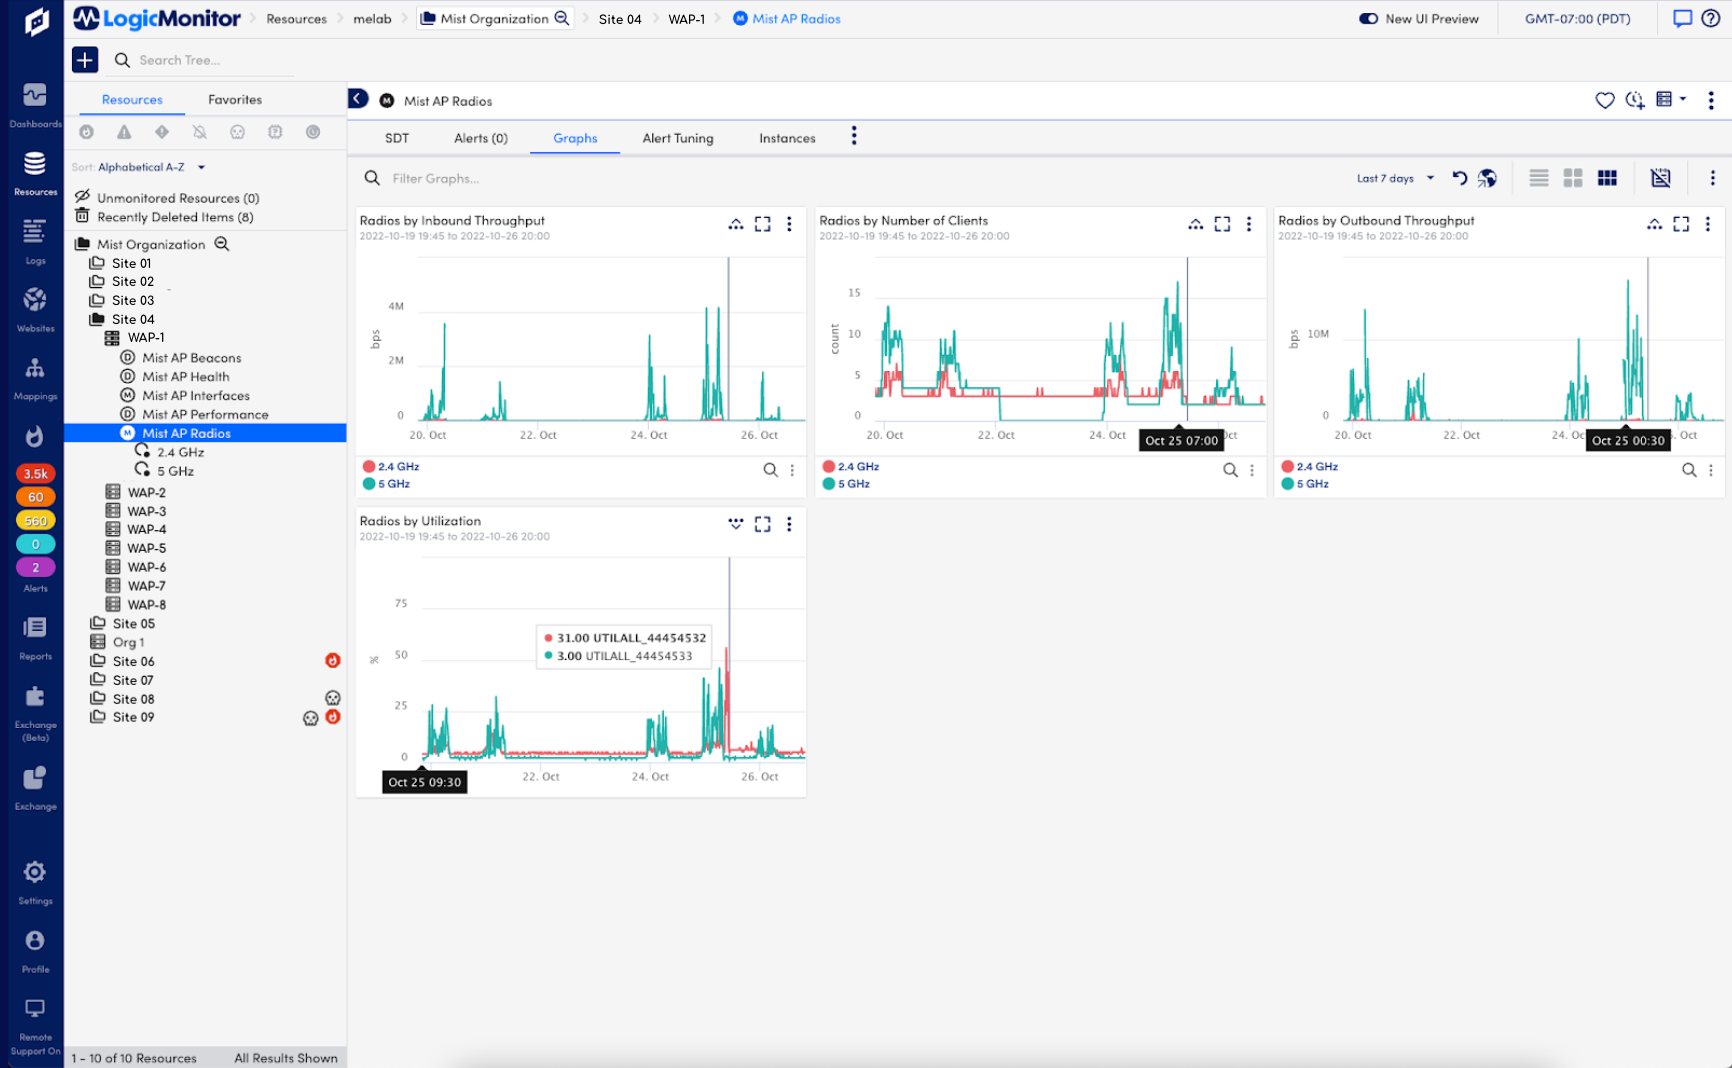
Juniper Mist
Monitor Juniper Mist access points and switches with LogicMonitor for real-time visibility into wireless network performance and health. Optimize wireless network performance, resolve issues quickly, and deliver a better user experience.
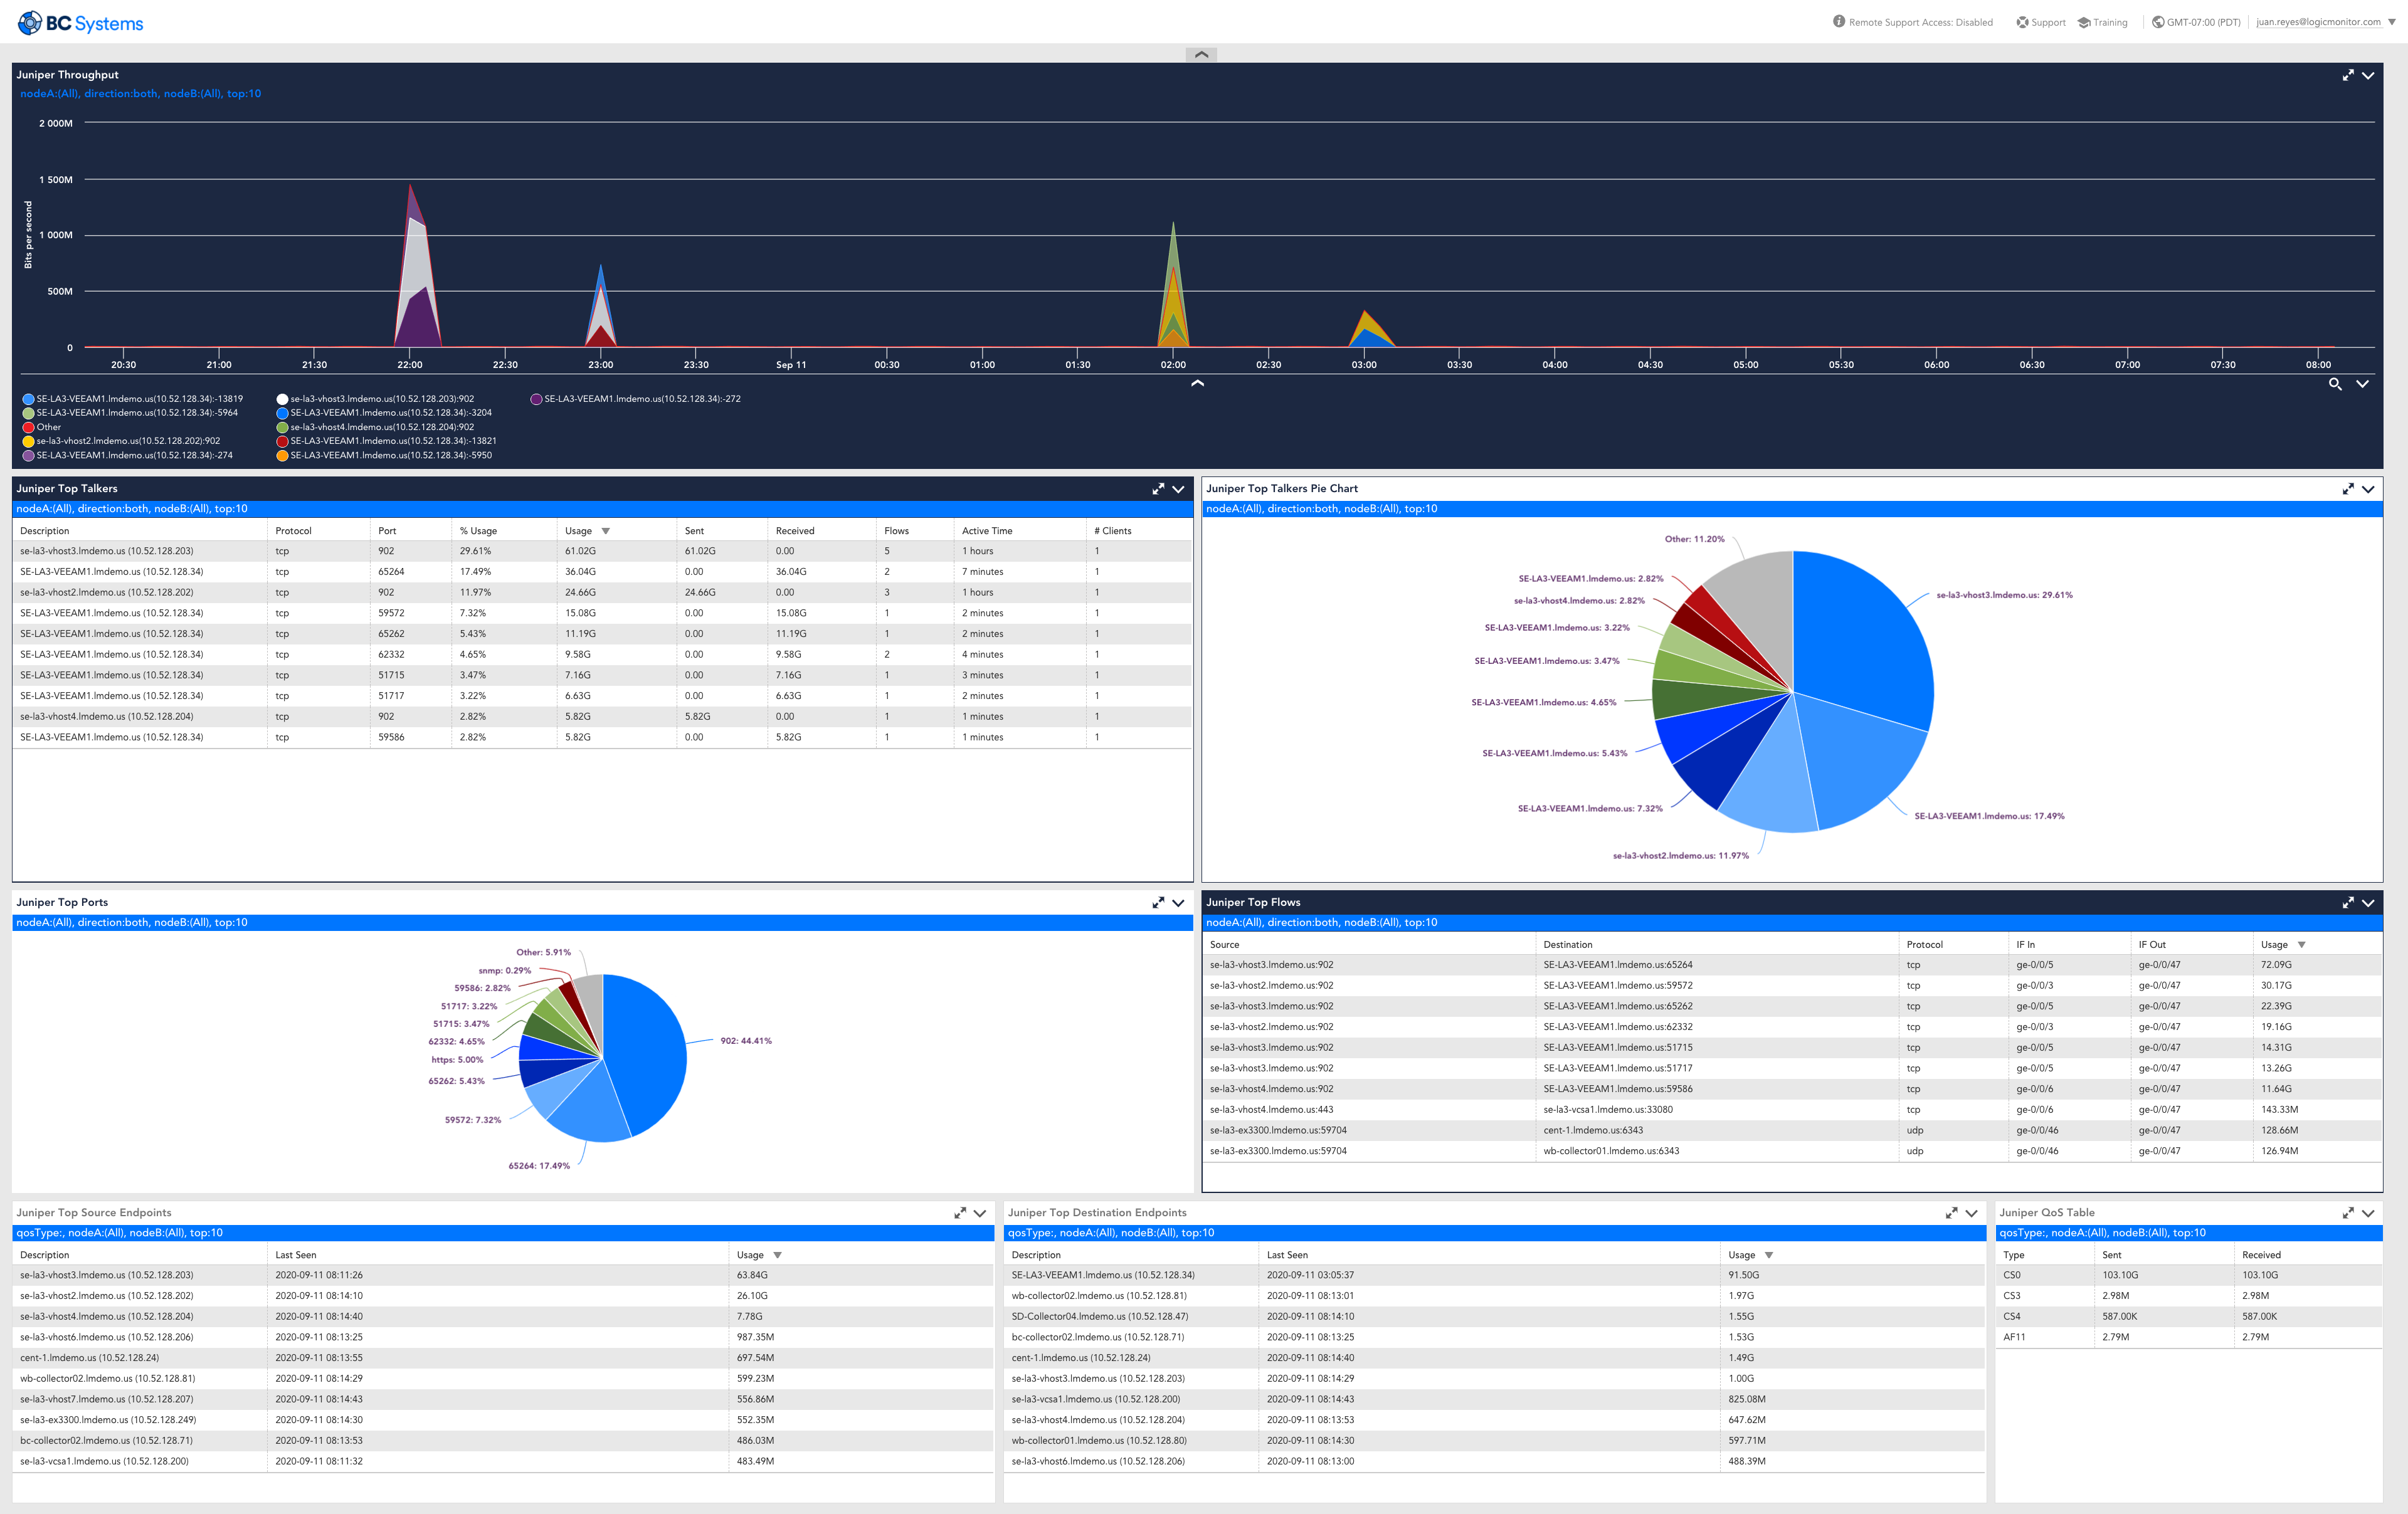
Netflow monitoring for in-depth bandwidth analysis
LogicMonitor provides you with full visibility into the NetFlow metrics of your Juniper devices running JUNOS. Quickly correlate Netflow data with SNMP performance metrics and configuration-changes.
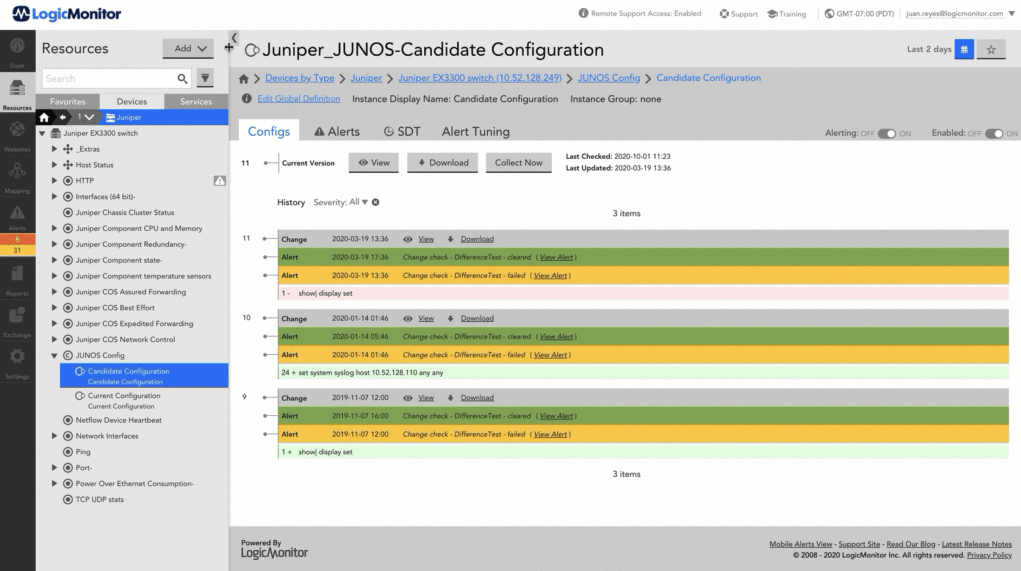
Backup. Diff-Check. Alert.
LogicMonitor regularly backs-up the Current and Candidate configurations for Juniper devices running JUNOS. Reduce time spent hunting for the root-cause of incidents by quickly surfacing config-change alerts and correlating with performance-data alerts.
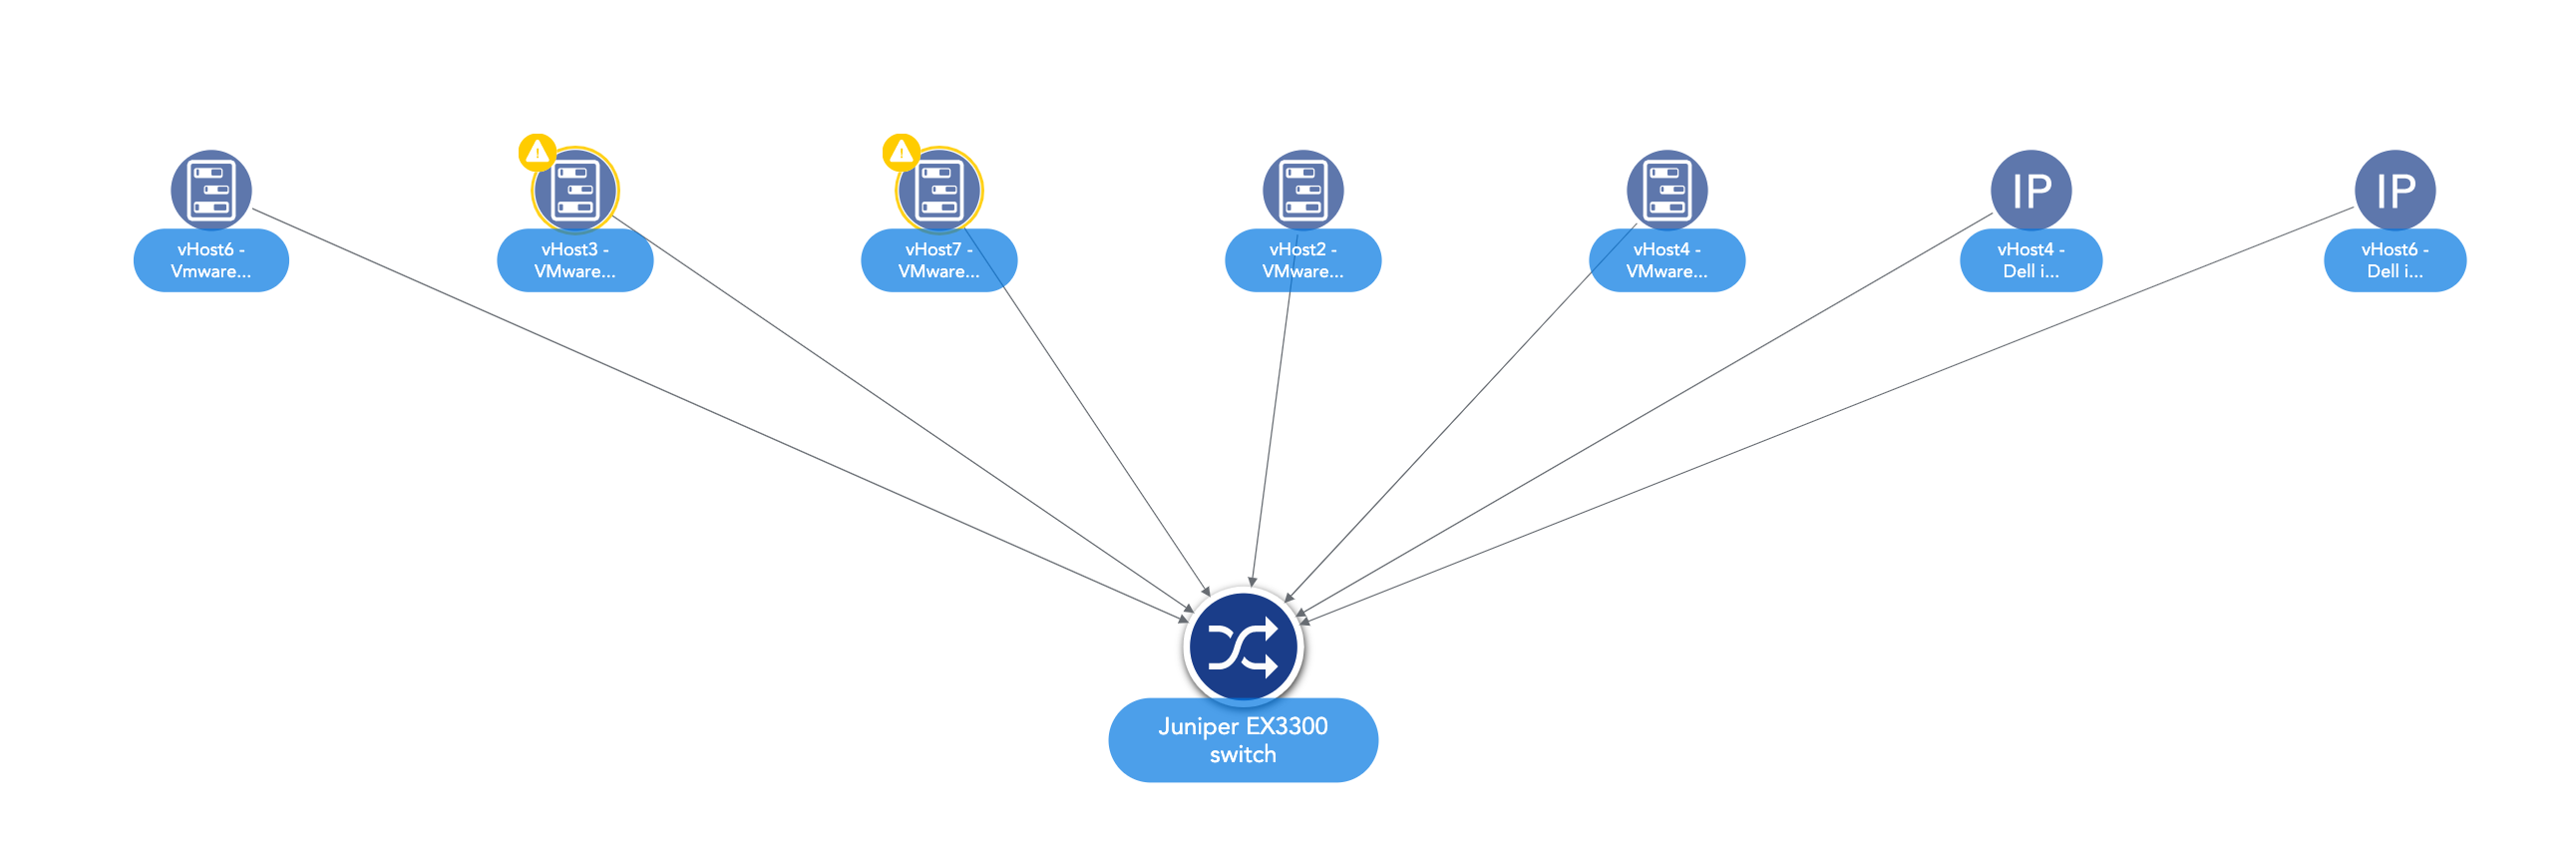
Unparalleled visibility
LogicMonitor’s topology feature shows you all the devices that depend on your Juniper equipment. In addition to the topology view, LogicMonitor’s AIOps capabilities can suppress alert storms from downstream devices.