NetApp
Elevate your monitoring with LogicMonitor, a NetApp technology partner. Experience insightful metrics and alerts with LogicMonitor’s dynamic, hassle-free platform. Seamlessly transition from manual to automated monitoring, and liberate your resources to focus on strategic initiatives, while we ensure precision and efficiency in your NetApp environment, including NetApp ONTAP.
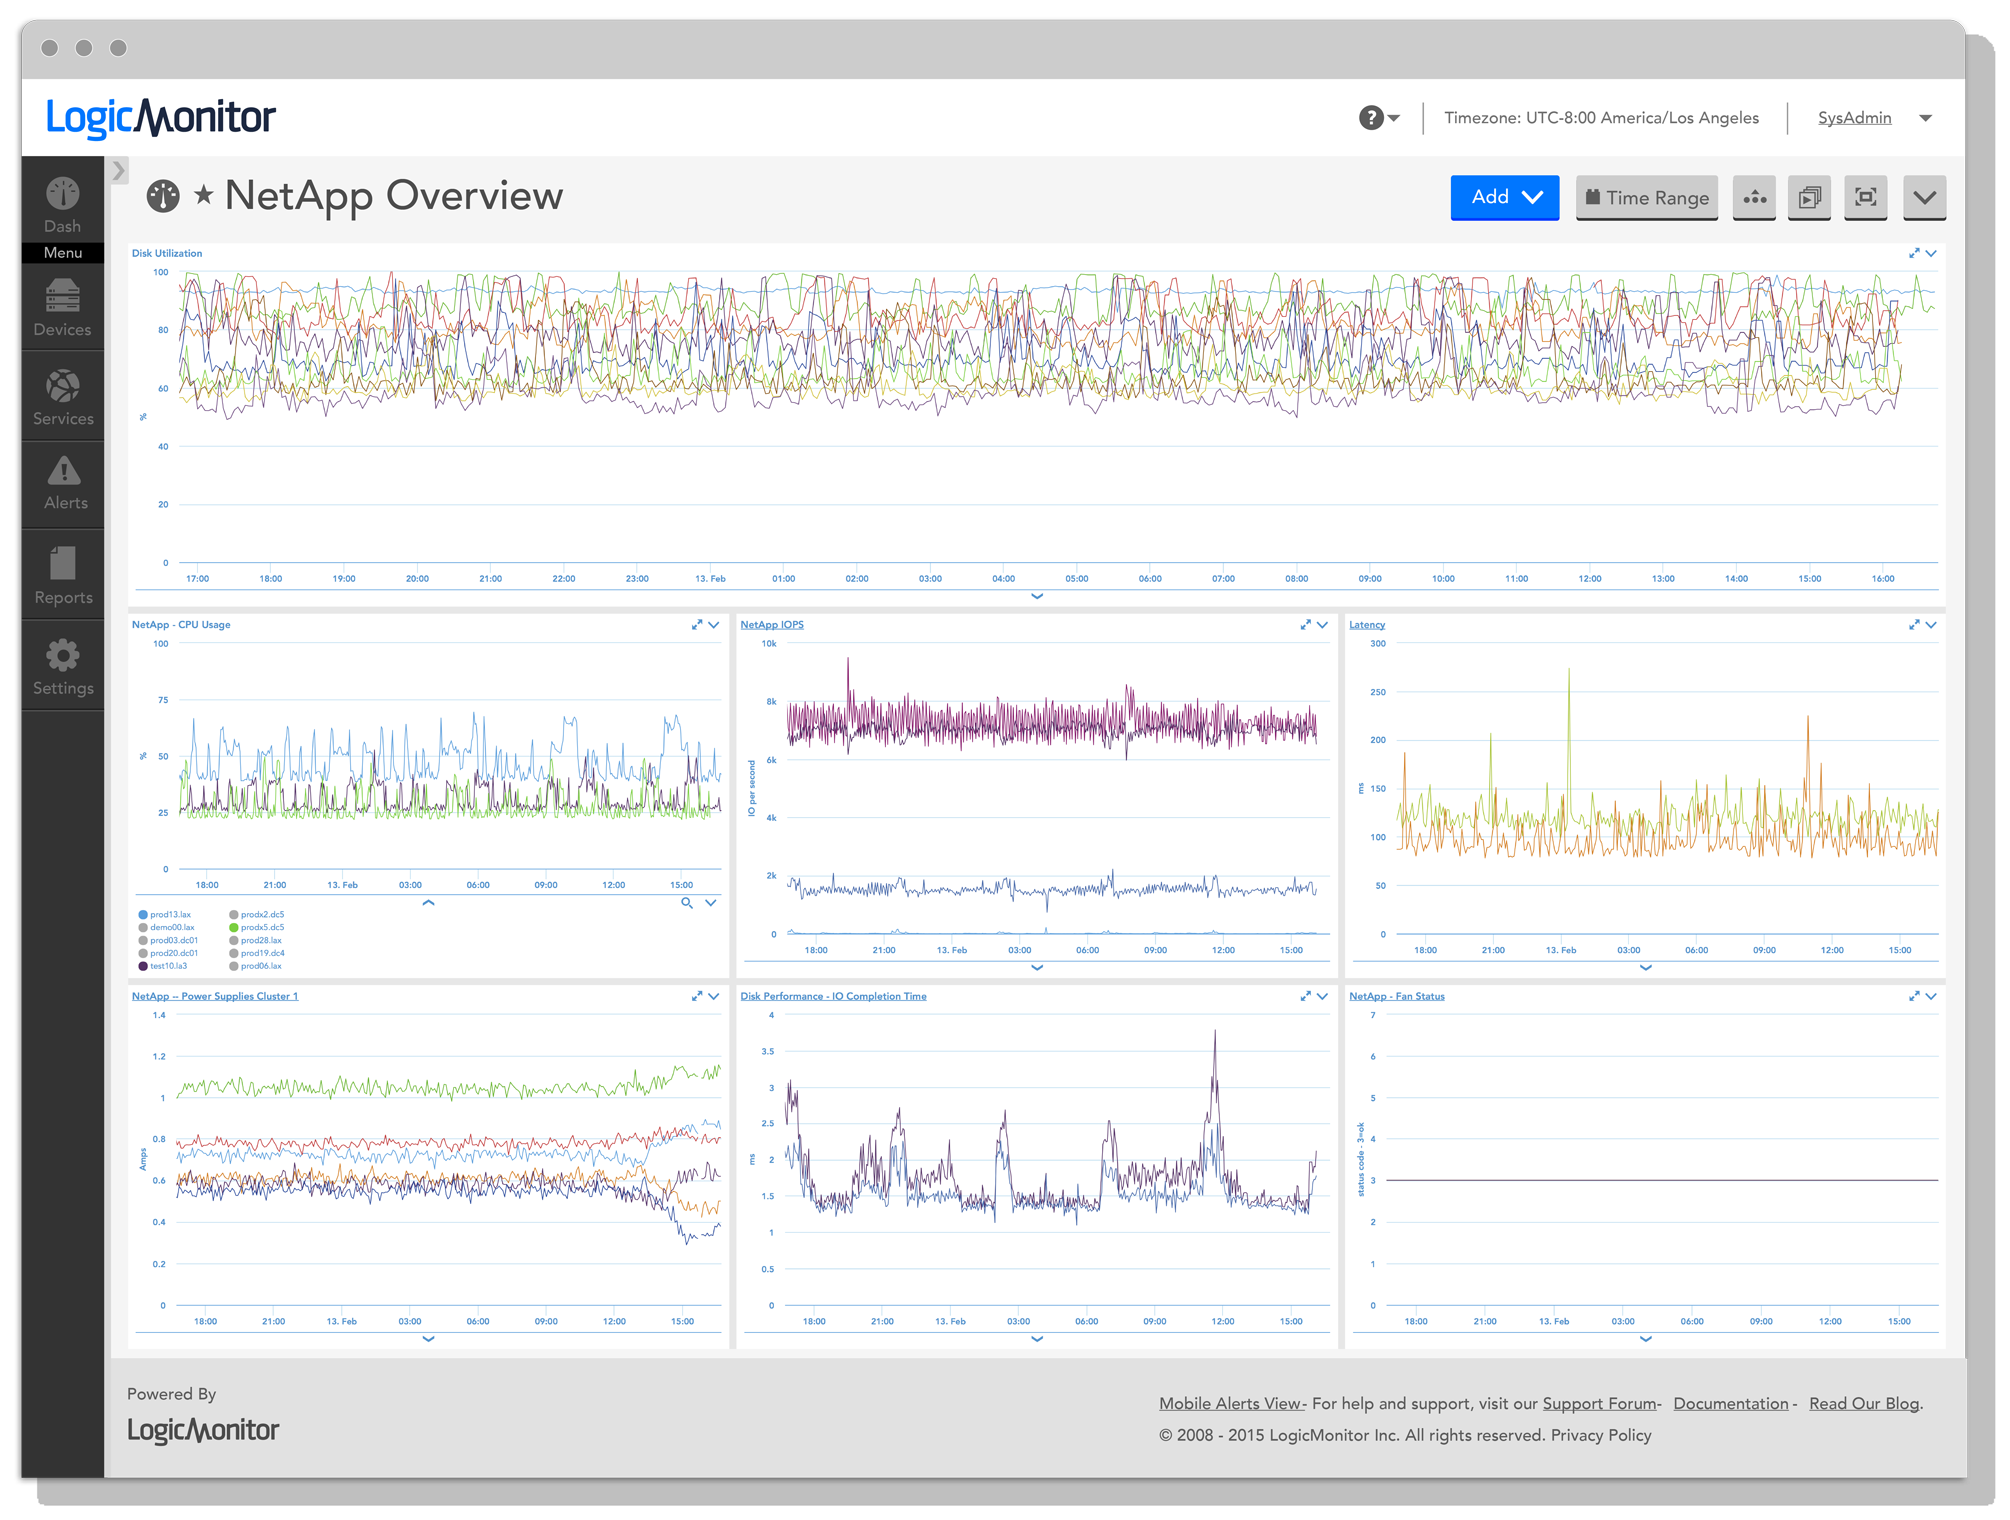
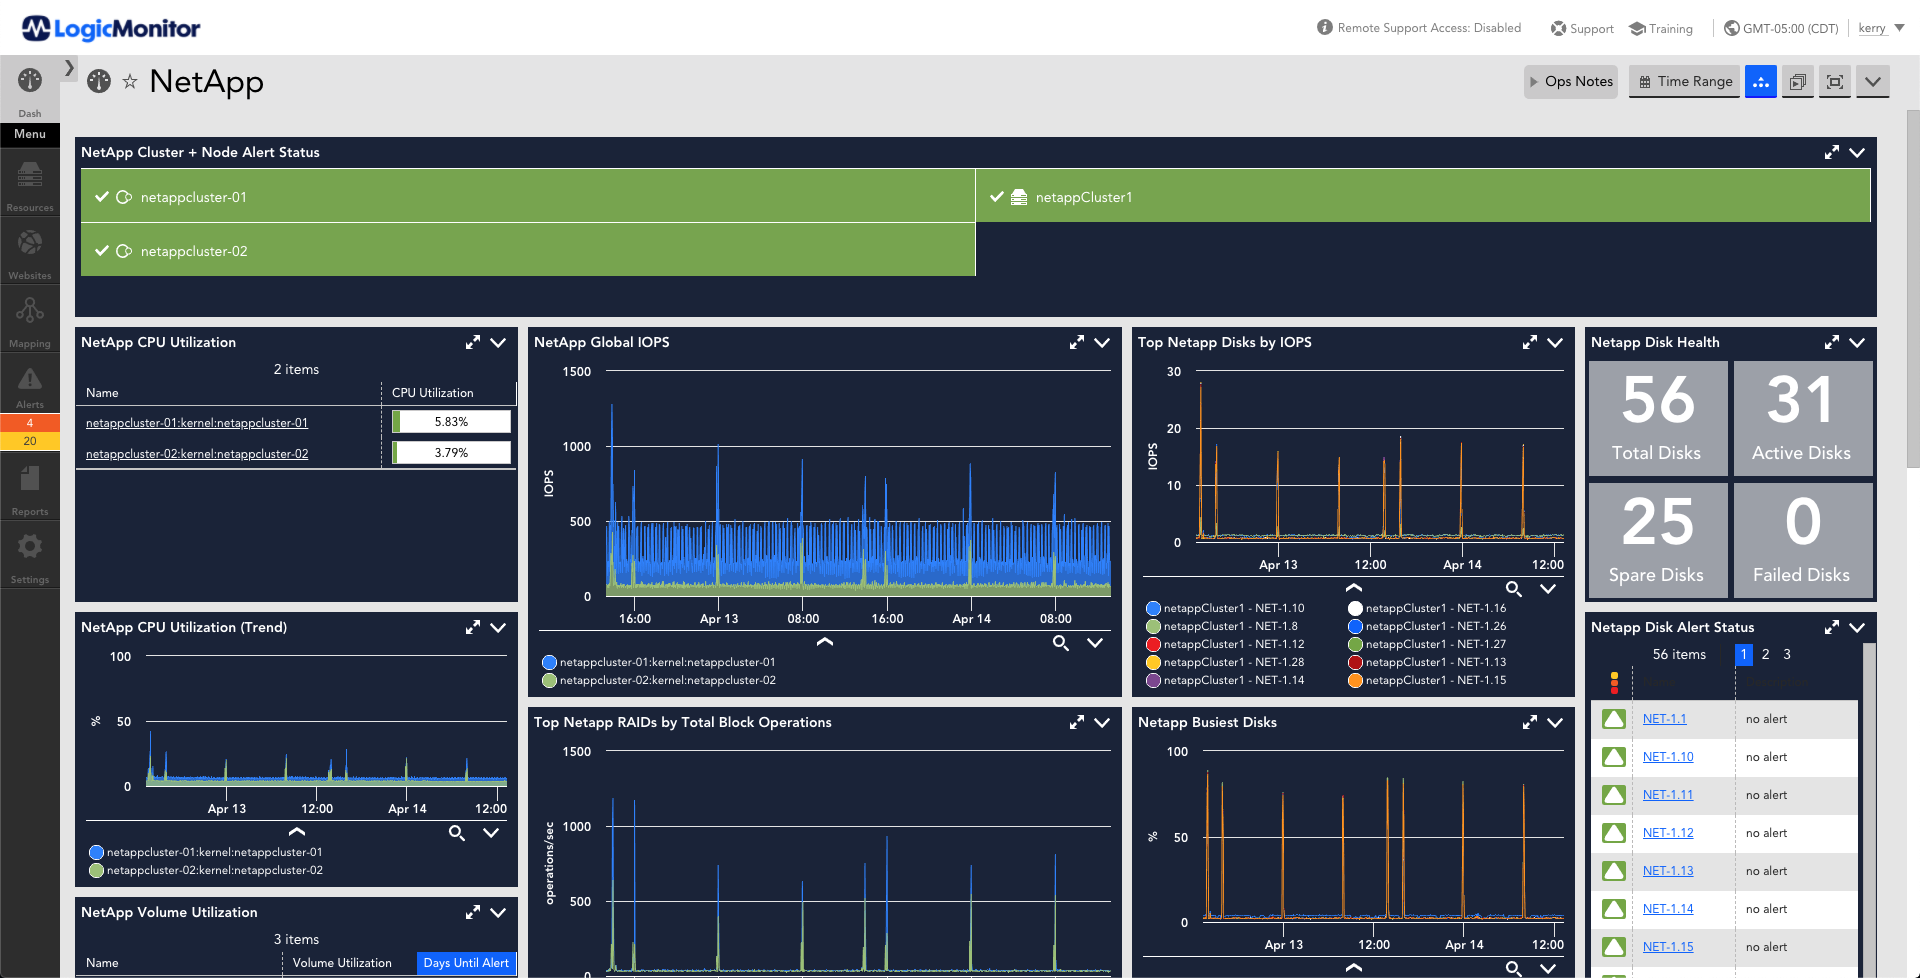
Total NetApp monitoring
Skip the hours of work manually configuring and maintaining other NetApp monitoring systems. With no configuration work, you will have NetApp performance trend graphs and alerts on:
- Every active interface
- Total CPU usage, disk activity, IO per second, cache age, consistency point activity
- Per volume space, inode and snapshot utilization
- Per volume read and write latency, IO operations per second and throughput
- Health checks for disk, fan and power supply failures; autosupport success
- LUN queue depth
and many more metrics.
Whether you are running in Cluster mode, 7-mode or ONTAP, storage monitoring should not fall on your best team members. Let LogicMonitor monitor, alert on, and display the information for them, so they can get down to solving problems or more strategic activities.
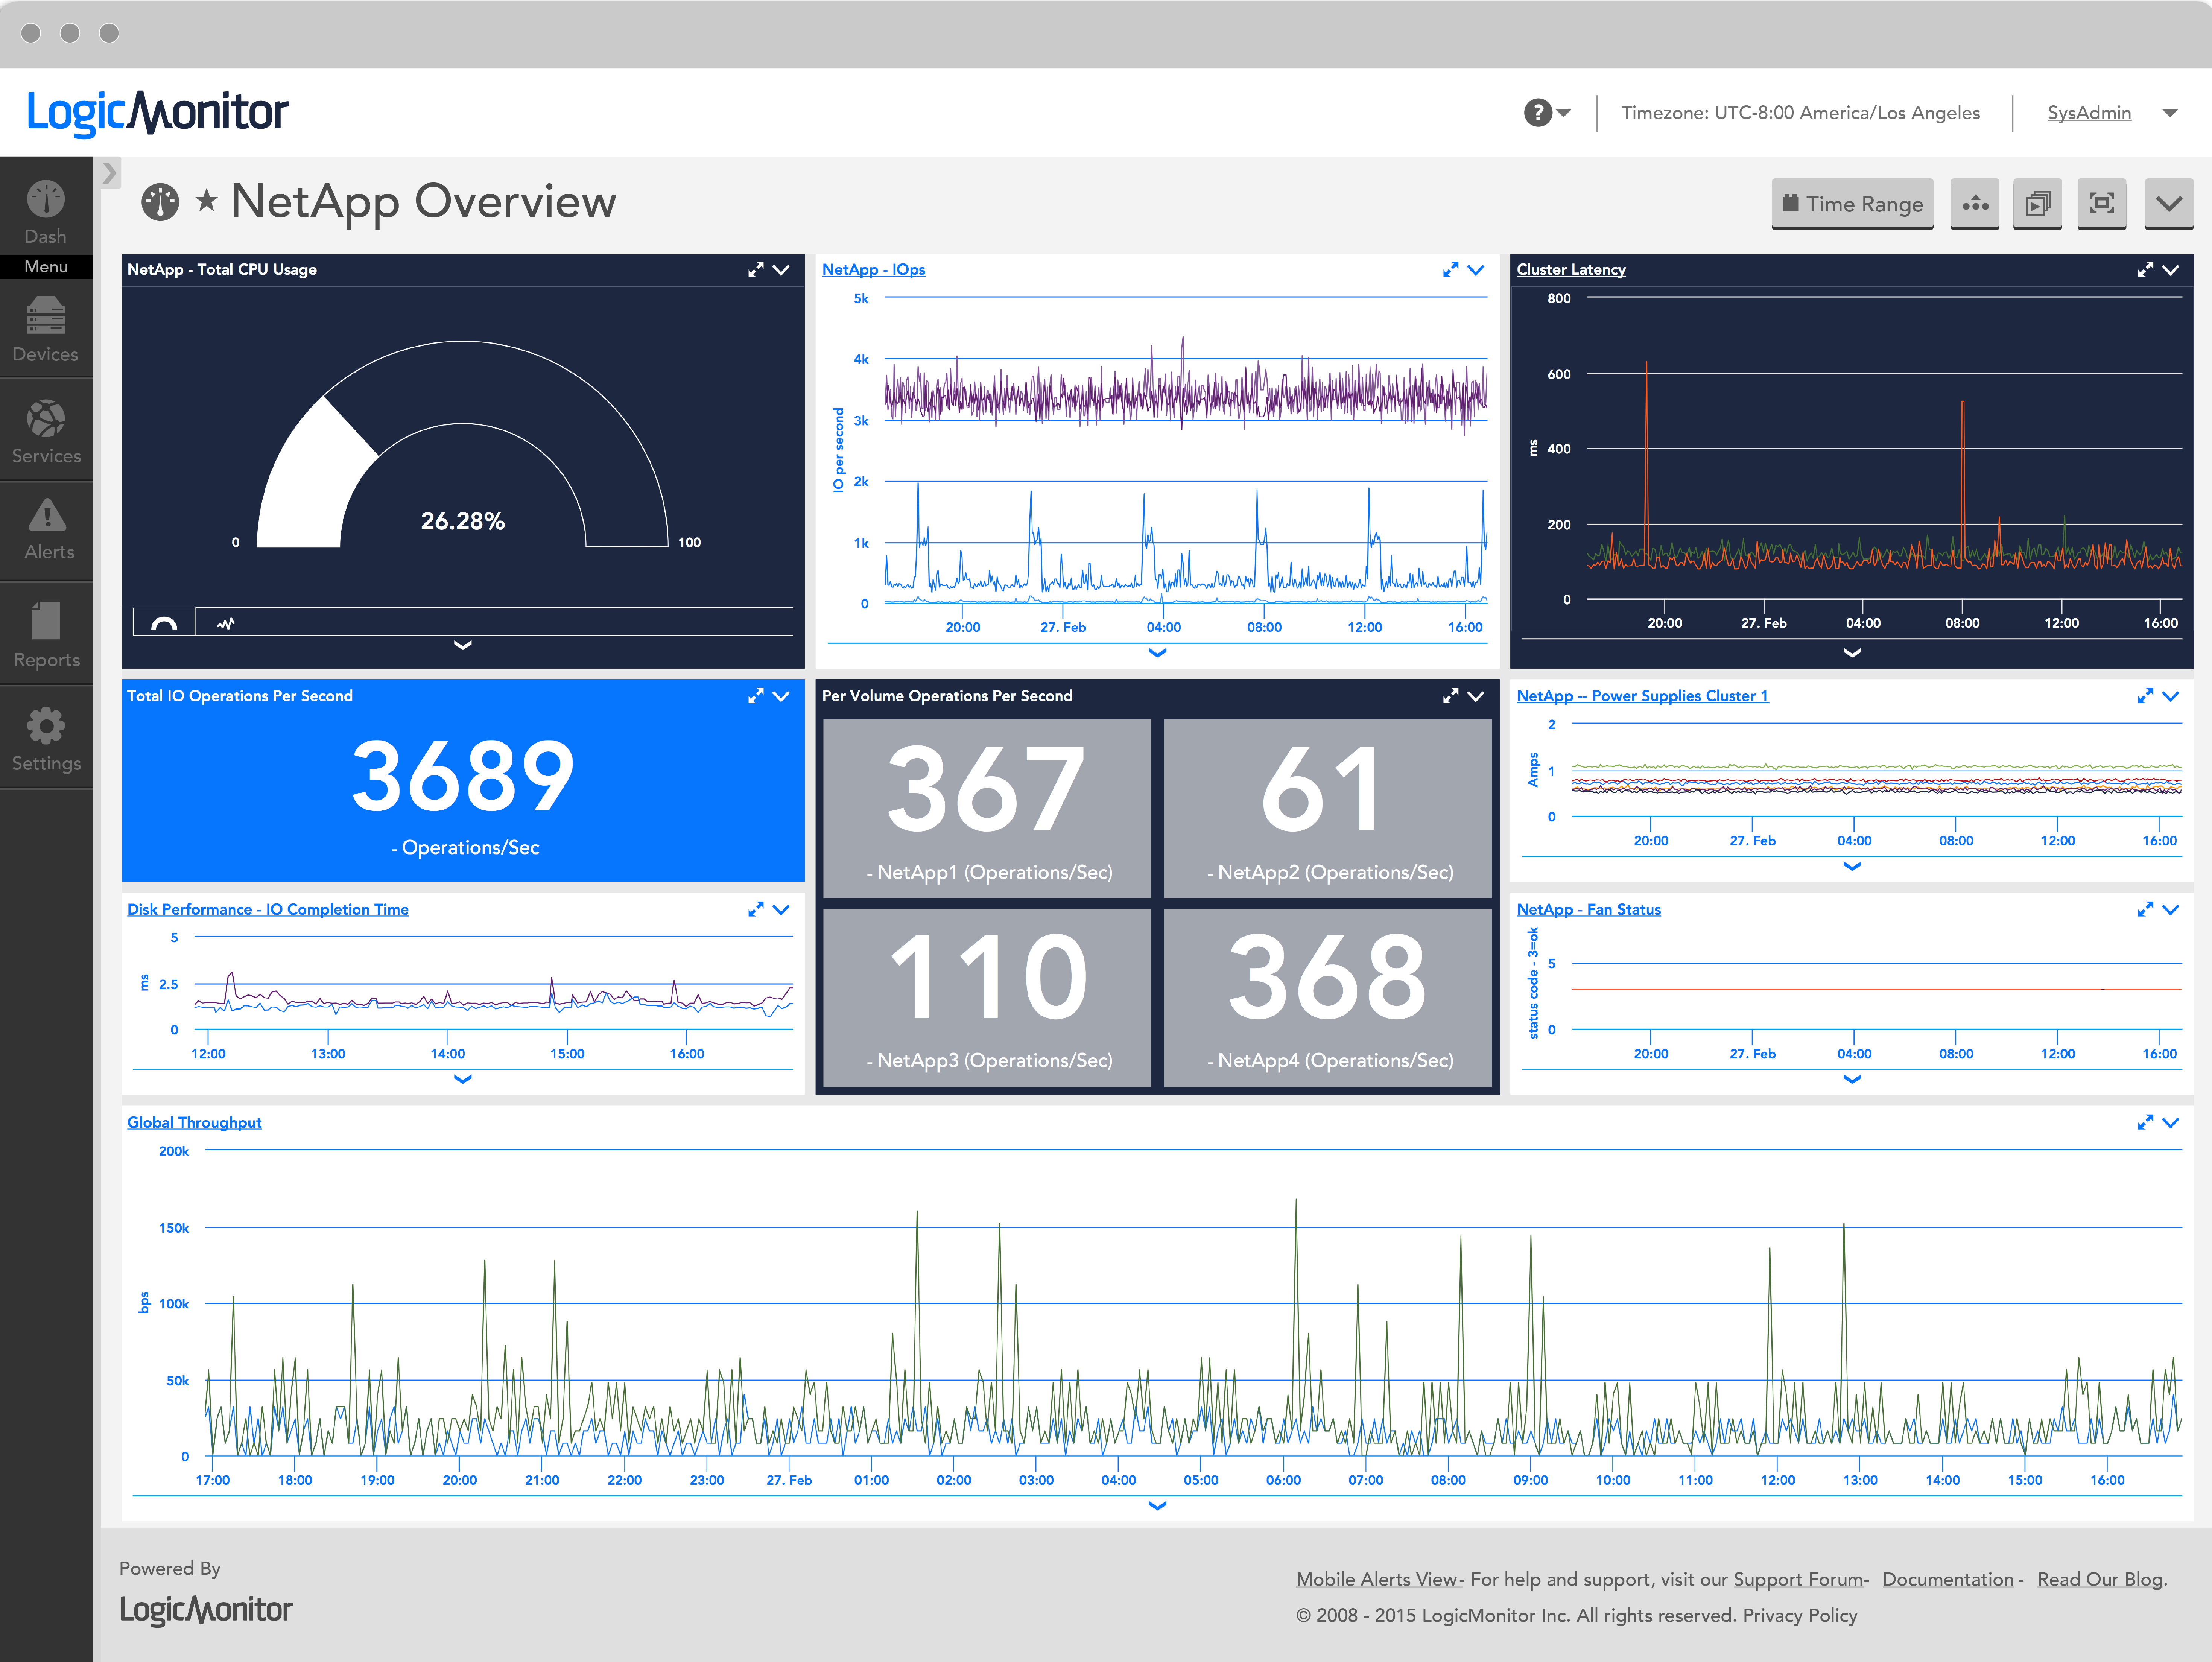
NetApp CPU Usage
The CPU load of a NetApp is an important metric to monitor, but LogicMonitor doesn’t stop there. It detects and monitors all the individual CPUs in a multi-processor system, tracks consistency point and interrupt activity, and lets you correlate whether the CPU load is impacting your request latency, or not.
NetApp Latency
This is the primary metric for every NetApp administrator – NetApps are meant to service read and write requests, and LogicMonitor lets you track exactly how long those requests take, trend them over time, and alert you if there are any issues. It even accommodates the different units reported by different versions of NetApp ONTAP.
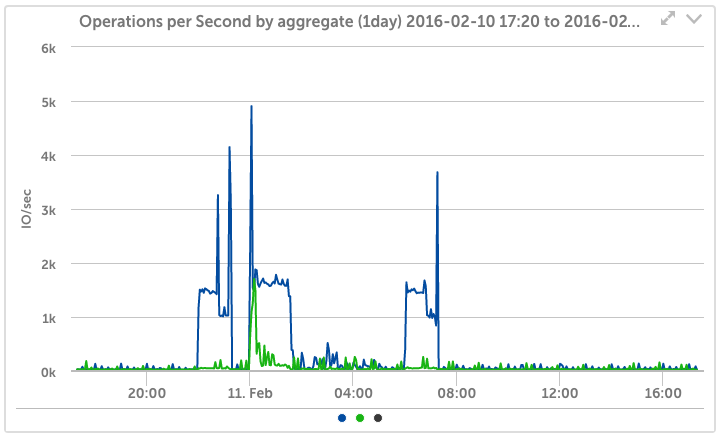
NetApp Aggregate Operations
LogicMonitor detects all aggregates and their volumes, to construct overview graphs, showing at a glance which volumes are utilizing resources, and whether they are impacting performance of other volumes. Troubleshooting has never been easier!
NetApp Volume Operations
Need to investigate details of a volume’s performance? It’s easy to see the operations on individual volumes over time with LogicMonitor.
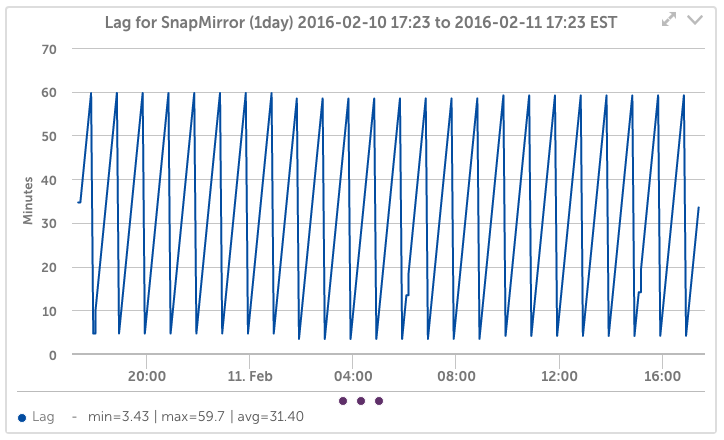
NetApp SnapMirror Status
LogicMonitor’s snapmirror monitoring detects and tracks the status and replication lag of all snapmirrors. Know for sure that your replication and DR are working – with LogicMonitor.
NetApp HBA Monitoring
LogicMonitor will find your HBA cards, track throughput in and out, and break down the kinds of operations each HBA is supporting. The LogicMonitor platform will even alert you in the event of queuing, and quickly let you see that your NetApps Fiber Channel interfaces are working correctly.
Benefits of using LogicMonitor to monitor NetApp
Automate
LogicMonitor’s automated device discovery and monitoring capabilities eliminate the need for manual, time-consuming configurations.

Scale
LogicMonitor can scale with your NetApp deployments, no matter how large or complex, delivering robust and reliable performance monitoring.

Intelligent Alerting
Avoid alert fatigue with LogicMonitor’s AI-driven alert escalation, keeping you informed of critical issues while filtering out the noise.
Proactive troubleshooting
Quickly diagnose and resolve issues with your NetApp storage system, minimizing downtime and boosting efficiency.