You can leverage Usage Reporting to view the usage metrics for LM Uptime resources directly in the LogicMonitor portal. The usage metrics display the monthly average number of visits to your monitored websites.
Requirements for Viewing Usage Data for LM Uptime Monitoring
To view usage data for LM Uptime resources in Usage Reporting, you must have the LM Uptime license edition.
Viewing Usage Data for LM Uptime
- In LogicMonitor, navigate to Settings > Usage.
- Select “LM Uptime” from the Product dropdown menu.
- To interact with the Usage Contributors table, select “All Child Accounts” from the Contributor Type dropdown menu.
- Select a month to view the usage date for websites.
- Do one of the following:
- To view the combined metrics for all LM Uptime resources, select the Combined Metrics tab.
The total number of datapoints defined for LM Uptime resources is displayed, and the visual components update accordingly. - To view the metrics for Ping Checks, select the Ping Check tab.
The total number of datapoints for ping checks is displayed, and the components update accordingly. - To view the metrics for Web Checks, select the Web Check tab.
The total number of datapoints for web checks is displayed, and the visual components update accordingly.
- To view the combined metrics for all LM Uptime resources, select the Combined Metrics tab.
- To view usage metrics for a specific date, hover over that date in the bar graph.

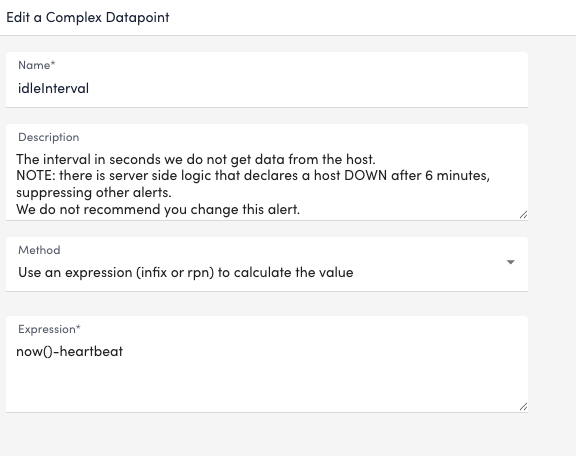
Use the Script EventSource collection method to detect and alert on any event. This may be useful if you don’t have LM Logs, and have custom logging that can’t be monitored with the other EventSource collection methods (for example log files, windows event logs, SysLogs, and SNMP traps.)
Format for Uploading External Script
Regardless of whether it is an embedded or external script, the output needs to be a JSON object with an array of one or more events, like this:
{
    "events" : [
                  {
                     "happenedOn":"Fri Jun 05 09:17:47 UTC 2015",
                     "severity":"Warn",
                     "message":"This is the first event's message",
                     "Source":"This is the source of the first event"
                   },
                   {
                     "happenedOn":"Fri Jun 07 09:27:37 UTC 2015",
                     "severity":"critical",
                     "message":"This is the second event's message",
                     "Source":"This is the source of the second event"
                   }
               ]
} The following fields can be used to describe an event in the script output:
| Attribute | Required? | Description |
| happenedOn | Yes | The date/time of the event |
| severity | Yes | The severity of the alert that will be triggered by the event (warn | error | critical) |
| message | Yes | The message of the event. Maximum 2,000 characters |
| customAttribute | No | Add any custom attribute you’d like to be associated with your event. The custom attribute will be a key-value pair, for example “thread.number” : “30”. |
Notes:
- If your data structure is not JSON, you can use groovy JSON tools (for example JSONBuilder) to convert it. If you do use these tools, make sure to include this import statement in your script: import groovy.json.*
- Severity levels (warn | error | critical) are not case sensitive.
- You can add multiple custom attributes per event. These will simply need to be separated by a comma and newline. In the following script output example, we included customAttributes buffer.size and thread.number:
{

  "events": [

    {

      "severity": "warn",

      "happenedOn": "Thu Jun 01 09:50:41 2017",

      "buffer.size": "500m",

      "thread.number": 20,

      "message": "this is the first message",

      "Source": "no ival"

    },

    {

      "severity": "warn",

      "effectiveInterval": 0,

      "happenedOn": "Thu Jun 01 09:50:41 2017",

      "buffer.size": "500m",

      "thread.number": 20,

      "message": "this is the second message"

    }

  ]

}
Date and Time Formats for “happenedOn” Field
LogicMonitor supports the following logfile date/times formats:
| Format | Pattern | Example |
| ISO-8601 | yyyy-MM-dd’T’HH:mm:ss.SSSZZ | 2016-01-06T23:48:41.445+08:00 |
| ISO-8601 (No time zone, in milliseconds) | yyyy-MM-dd’T’HH:mm:ss | 2016-01-06T23:48:41 |
| HTTP | EEE, dd MMM yyyy HH:mm:ss zzz | Wed, 09 Feb 1994 22:23:32 GMT |
| ctime(3) | EEE MMM dd HH:mm:ss zzz | Thu Feb 3 17:03:55 GMT 1994 |
| ANSI C | EEE MMM dd HH:mm:ss yyyy | Thu Feb 3 00:00:00 1994 |
| RFC850 HTTP | EEEE, dd-MMM-yy HH:mm:ss zzz | Tuesday, 08-Feb-94 14:15:29 GMT |
| RFC850 HTTP | EEEE, dd-MMM-yyyy HH:mm:ss zzz | Tuesday, 08-Feb-1994 14:15:29 GMT |
| Common logfile format | dd/MMM/yyy:HH:mm:ss Z | 03/Feb/1994:17:03:55 -0700 |
| HTTP (no weekday) | dd MMM yyyy HH:mm:ss zzz | 09 Feb 1994 22:23:32 GMT |
| RFC850 (no weekday) | dd-MMM-yy HH:mm:ss zzz | 08-Feb-94 14:15:29 GMT |
| RFC850 format (no weekday) | dd-MMM-yyyy HH:mm:ss zzz | 08-Feb-1994 14:15:29 GMT |
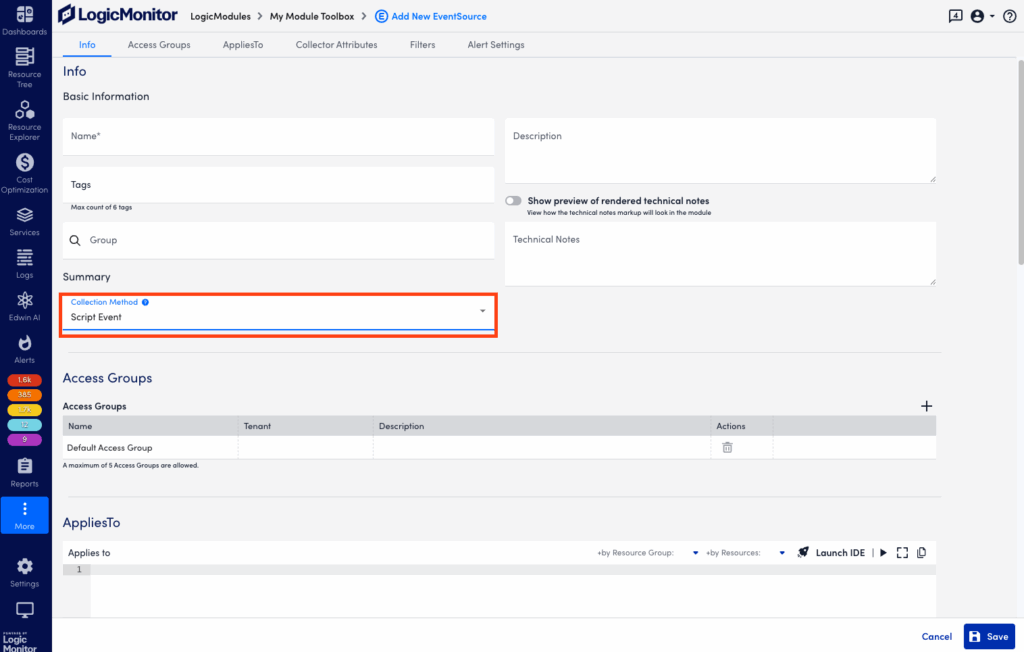
Creating a Script EventSource
Follow these steps to create a Script EventSource:
- Create a new Module. For more information, see DataSources Configuration.
- When entering the DataSource information, set the Collection Method field in Basic Information to ‘Script Event’
- In Collector Attributes, upload an external script or enter an embedded Groovy script.
- Save the new EventSource.
Note: This method can discover a maximum of 50 events per script execution and a maximum of 100 events per collector per minute.
Example
If the script output is:
{"events":[{"happenedOn":"Thu Jan 21 14:25:00 PST 2016","severity":"Warn","message":"This is the message of the event","source":"Custom"}]}The associated device will trigger an alert, “happenedOn: Thu Jan 21 14:25:00 PST 2016 message: This is the message of the event severity: Warn source: Custom”
You can configure LogicMonitor to import AWS and Azure billing data using the Billing configuration tool to streamline the process of exporting cloud billing data from each provider into LogicMonitor.
You can also configure billing data imports from the Resource Tree by applying billing export data to your existing cloud resources. For more information on AWS billing Resource Tree configuration, see AWS Billing Monitoring Setup
Requirements for Configuring Billing Data for Cost Optimization
To configure billing, your LogicMonitor portal must already be set up to monitor AWS and Azure resources. You must also have the necessary IAM and Azure Entra roles in place to access billing data. For more information, see AWS Monitoring Setup and Adding Microsoft Azure Cloud Monitoring.
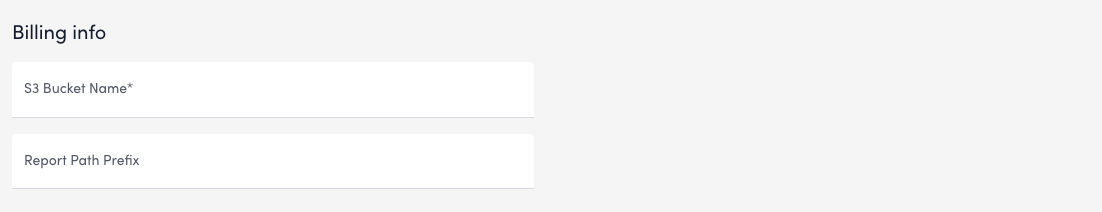
To configure AWS billing data for Cost Optimization, you must create a new Cost and Usage Report (CUR) within the AWS console. You will need the following information from the CUR:
- Name of your Amazon S3 bucket
To obtain the name of your S3 bucket, you must set up an Amazon S3 bucket for your Cost and Usage Report.
For more information, see Setting up an Amazon S3 bucket for cost and usage reports from AWS. - Report path prefix of your cost and usage report
To obtain the report path prefix, you must create a Cost and Usage Report that is enabled to integrate with Amazon Redshift.
For more information, see Creating Cost and Usage Reports from AWS.
Recommendations:
- Use AWS Cost and Usage Reports 2.0 when setting up billing monitoring whenever possible. Version 2.0 provides the Account Name in the report sent to LogicMonitor, while version 1.0 does not. Using a combination of versions 1.0 and 2.0 may display two different names for the same account in LogicMonitor Billing.
- Do not select Include resource IDs when configuring your report. LogicMonitor does not currently collect these IDs.
- Select Daily granularity and Parquet compression to optimize your report and reduce your data egress costs from AWS.
- Activate Cost Allocation Tags in the AWS console and mark the resources and property normalization aliases you want included in Recommendations. For more information, see Activating user-defined cost allocation tags from AWS.
To configure Azure billing data for Cost Optimization, you must create a new data Export within the Azure console. For more information, see Create and manage exported data from Azure. You will need the following information from your Azure data export:
- Export Name
- Storage Account Name
- Storage Account Container Name
- Storage Account Container Directory
You must also assign a role within Azure to your LogicMonitor resource group. This process requires the following details associated with your LogicMonitor resource group:
- Azure Tenant ID
- Azure Client ID
- Azure Secret Key
For more information, see Assign Azure roles to external users using the Azure portal from Azure.
Recommendation: To avoid issues while importing data to LogicMonitor, do not use unsupported configurations. LogicMonitor supports the following export configurations:
- Cost and usage details (actual) version 2024-08-01 or earlier
- Cost and usage details (FOCUS) version 1.0 or earlier
Configuring AWS Billing Data for Cost Optimization
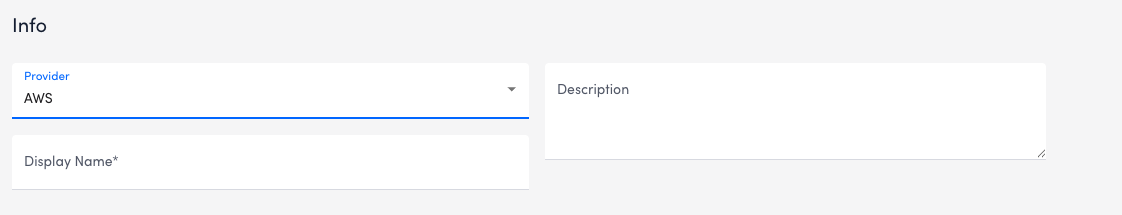
- In LogicMonitor, navigate to Cost Optimization > Billing and select
 Manage Billing Configurations.
 - In Manage Billing Configurations, select
 Create Billing Configuration.
 - In the Provider field, select “AWS.”
- In the Display Name field, enter a name for your AWS configuration.
- (Optional) Enter a Description.
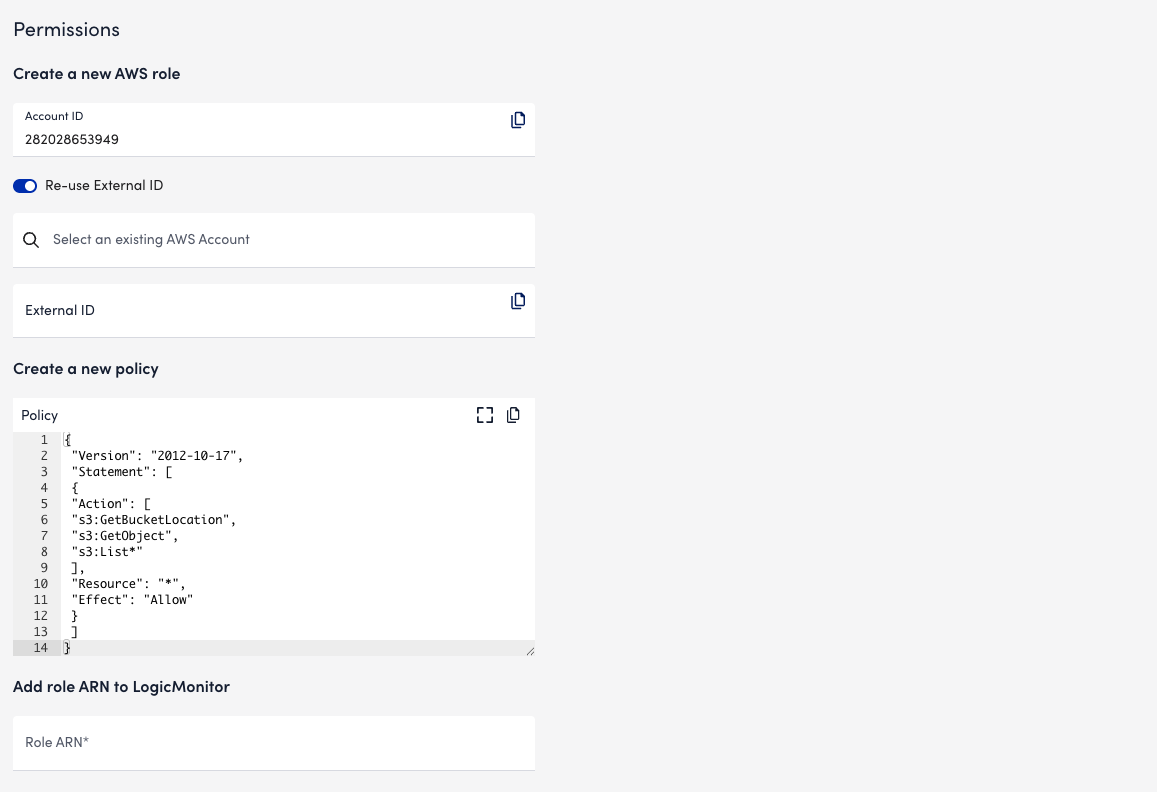
- In Permissions settings, the AWS Account ID field populates automatically with the ID of an AWS account. LogicMonitor uses this account to collect billing data from your AWS account.
- (Optional) Enable Re-use External ID. This allows you to use the same External ID from an AWS account already connected to LogicMonitor.
Note: Leaving this option disabled automatically generates a new External ID for your Billing configuration.
- In the Select an existing AWS Account field, enter or search for an AWS account from which to collect billing data.
Note: If Re-use External ID is disabled, this field is hidden.
- The Create a new policy field comes pre-filled with a basic set of permissions to enable LogicMonitor access to your Cost and Usage Report
Recommendations:
- If the External ID you selected does not already have an IAM Policy with these permissions applied, you can copy the JSON script provided and apply it to your role in the AWS console.
- This field does not automatically apply a policy to your IAM role. For more information, see Policies and Permissions from AWS.
- In the Add role ARN to LogicMonitor field, enter the Amazon Resource Number (ARN) for LogicMonitor’s IAM role. For more information, see IAM Identifiers from AWS.
- In the Billing info tab, enter the S3 Bucket Name and Report Path Prefix into the provided fields.
- Select Verify and add export.
Configuring Azure Billing Data for Cost Optimization
- In LogicMonitor, navigate to Cost Optimization > Billing and select Manage Billing Configurations.
- In Manage Billing Configurations, select Create Billing Configuration.
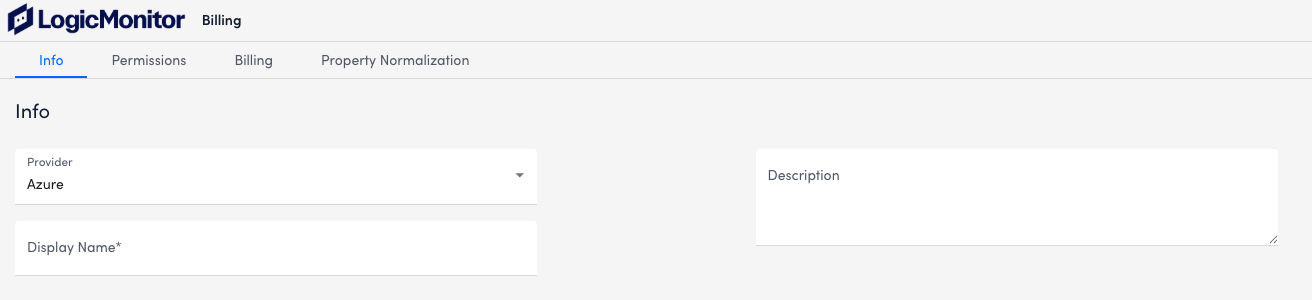
- In the Provider field, select Azure.
- In the Display Name field, enter a name for your AWS configuration.
- (Optional) Enter a Description.
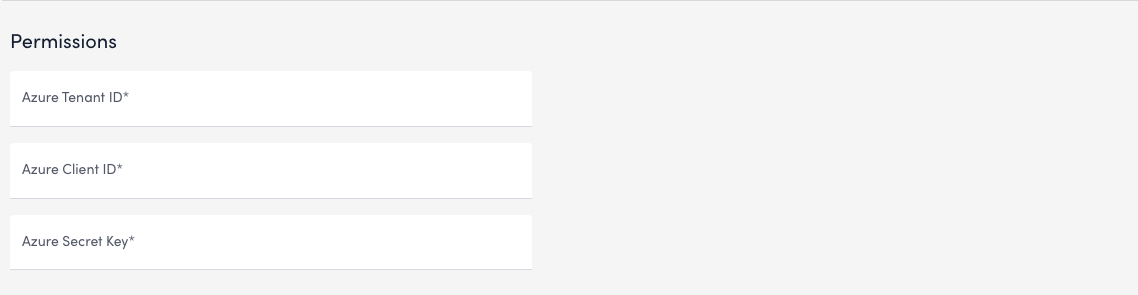
- In the Permissions tab, enter the Azure Tenant ID, Azure Client ID, and Azure Secret Key into the provided fields.
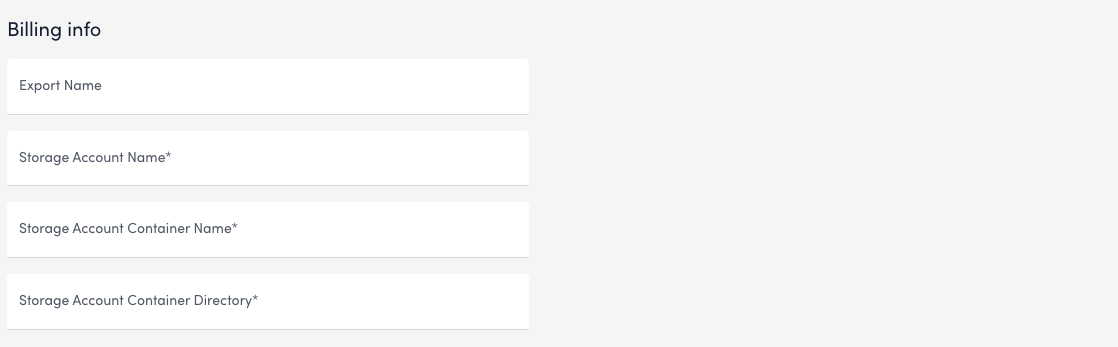
- In the Billing tab, enter the Export Name for your Azure data export.
- Enter the Storage Account Name, Storage Account Container Name, and Storage Account Container Directory into the provided fields.
- Select Verify and add export.
Configuring Azure Billing Using the Resource Tree
- In your Azure console, create a new data Export. For more information, see Create and manage exported data from Azure.
- Assign a role within Azure to your LogicMonitor resource group.
- This process requires the Azure Client ID associated with your LogicMonitor resource group. For more information, see Assign Azure roles to external users using the Azure portal from Azure.
- When editing the IAM config for the storage account to which you send exports, assign the Storage Blob Data Reader role to the AppRegistration used for LogicMonitor.
- In LogicMonitor, navigate to Resource Tree and select the Manage icon for your Azure resource group, then select Permissions to locate the Client ID.
- Select the report and copy the Subscriptionid assigned to it. The Subscription name provided by Azure in the cost export will appear as the Account Name in LogicMonitor Billing. If you want to enable enhanced billing features, copy the following details:
- Export Name
- Storage Account Name
- Storage Account Container Name
- Storage Account Container Directory
- In LogicMonitor, navigate to Resource Tree and select the resource group used to monitor your Azure environment.
- Select Manage > the Billing tab. Enter the information above into the provided fields,
- Select Verify Enhanced Billing to validate any changes.
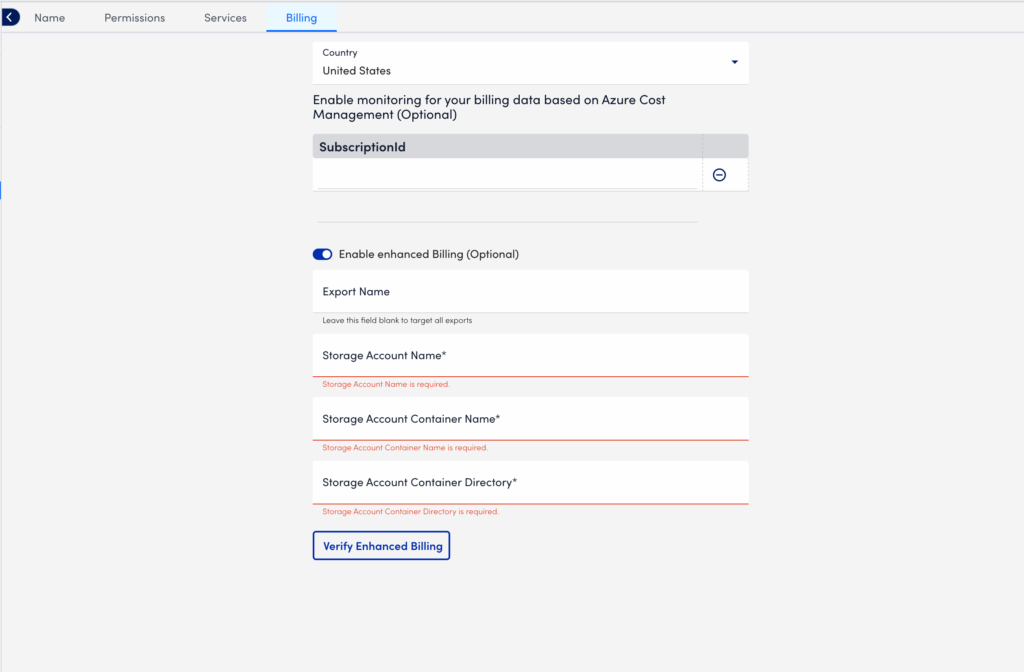
Note: Note: Amortized Azure reports are not supported at this time. Only use one export configuration when importing data. Using both at once may lead to errors or duplicated report data.
LogicMonitor uses the JMX collection method to collect performance and configuration data from Java applications using exposed MBeans (Managed Beans). These MBeans represent manageable resources in the Java Virtual Machine (JVM), including memory, thread pools, and application-specific metrics.
To collect data using the JMX collection method, configure a datapoint that references a specific MBean and one of its attributes. Specify the following:
- MBean ObjectName— A domain and one or more key–value properties.
For example,domain=java.lang, propertiestype=Memory. - Attribute— The attribute to collect from the MBean.
Each MBean exposes one or more attributes that can be queried by name. These attributes return one of the following:
- A primitive Java data type (for example,
int,long,double, orstring) - An array of data (for example, an array of primitives or nested objects)
- A hash of data (for example, key–value pairs, including nested structures or attribute sets)
LogicMonitor supports data collection for all JMX attribute types.
Note:
LogicMonitor does not support JMX queries that include dots (periods) unless they are used to navigate nested structures.For example:
- rep.Container is invalid if it is a flat attribute name.
- MemoryUsage.used is valid if MemoryUsage is a composite object and used in a field inside it.
When configuring the JMX datapoint, LogicMonitor uses this information to identify and retrieve the correct value during each collection cycle.
For more technical details on MBeans and the JMX architecture, see Oracle’s JMX documentation.
Simple Attribute Example
If the attribute is a top-level primitive:
- MBean ObjectName:
java.lang:type=Threading - MBean Attribute:
ThreadCount
LogicMonitor collects the total number of threads in the JVM.
Nested Attribute Example
If the attribute is part of a composite or nested object, use the dot/period separator as follows:
- MBean ObjectName:
java.lang:type=Memory - MBean Attribute:
HeapMemoryUsage.used
LogicMonitor collects the amount of heap memory used.
Multi Level Selector Example
To collect data from a map or nested structure with indexed values:
- MBean ObjectName:
LogicMonitor:type=rrdfs - MBean Attribute:
QueueMetrics.move.key1
LogicMonitor retrieves the value associated with the key key1 from the map identified by index move under the QueueMetrics attribute of the MBean.
CompositeData and Map Support
Some JMX MBean attributes return structured data such as:
- CompositeData: A group of named values, like a mini object or dictionary.
- Map: A collection of key-value pairs.
LogicMonitor supports collecting values from both.
Accessing CompositeData Example
A CompositeData attribute is like a box of related values, where each value has a name (field). To collect a specific field from the structure, use a dot (.) separator.
MBean: java.lang:type=GarbageCollector,name=Copy
Attribute: LastGcInfo
Value Type: CompositeData
To access the specific value for the number of GC threads use: LastGcInfo.GcThreadCount
Note: Maps in JMX behave similarly to CompositeData, but instead of fixed fields, values are retrieved using a key.
TabularData Support
Some MBean attributes return data in the form of TabularData, a structure similar to a table, with rows and columns. LogicMonitor can extract specific values from these tables.
A TabularData object typically consists of:
- Index columns: Used to uniquely identify each row (like primary keys in a database)
- Value columns: Contain the actual data you want to collect
You can access a value by specifying:
- The row index (based on key columns)
- The column name for the value you want
Single Index TabluarData Example
The MBean java.lang:type=GarbageCollector,name=Copy has an attribute LastGcInfo. One of its child values, memoryUsageAfterGc, is a TabularData. 
The table has 2 columns – key and value. The column key is used to index the table so you can uniquely locate a row by specifying an index value.
For example, key=”Code Cache” returns the 1st row.
To retrieve the value from the value column of the row indexed by the key "Eden Space", use the expression: LastGcInfo.memoryUsageAfterGc.Eden Space.value
In this expression, "Eden Space" is the key used to identify the specific row, and value is the column from which the data will be collected.
Multi-Index TabularData Example
Some tables use multiple index columns to identify rows.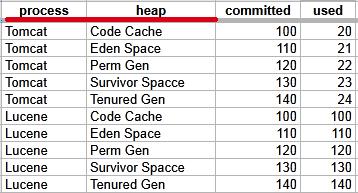
This TabularData structure has four columns, with process and heap serving as index columns. A unique row is identified by the combination of these index values.
To retrieve the value from the committed column in the row where process=Tomcat and heap=Perm Gen, use the expression: LastGcInfo.memoryUsageAfterGc.Tomcat,Perm Gen.committed
Here, Tomcat,Perm Gen specifies the row, and committed is the column containing the desired value.
Array or List Support
Some MBean attributes return arrays or lists of values. LogicMonitor supports collecting data from these array or list values using index-based access.
For example, the MBean: java.lang:type=GarbageCollector,name=Copy has an Attribute: MemoryPoolNames with Type: String[] 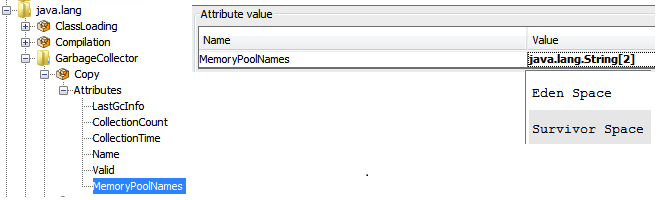
To access/collect the first element of this array, the expression “MemoryPoolNames.0“ can be used, where “0” is the index to the array (0-based).
You can access the array elements by changing the index as follows:
MemoryPoolNames.0 = "Eden Space"MemoryPoolNames.1="Survivor Space"
The same rule applies if the attribute is a Java List. Use the same dot and index notation.
To enable JMX collection for array or list attributes:
- Make sure your Java application exposes JMX metrics.
- Confirm that the username and password for JMX access are correctly set as device properties:
jmx.userjmx.pass
These credentials allow the Collector to connect to the JMX endpoint and retrieve the attribute data, including elements in arrays or lists.
Configuring a Datapoint using the JMX Collection Method
- In LogicMonitor, navigate to Modules. Add a new DataSource or open an existing module to add a datapoint for JMX collection.
For more information, see Custom Module Creation or Modules Management in the product documentation. - In the Collection Method field, select “JMX”.
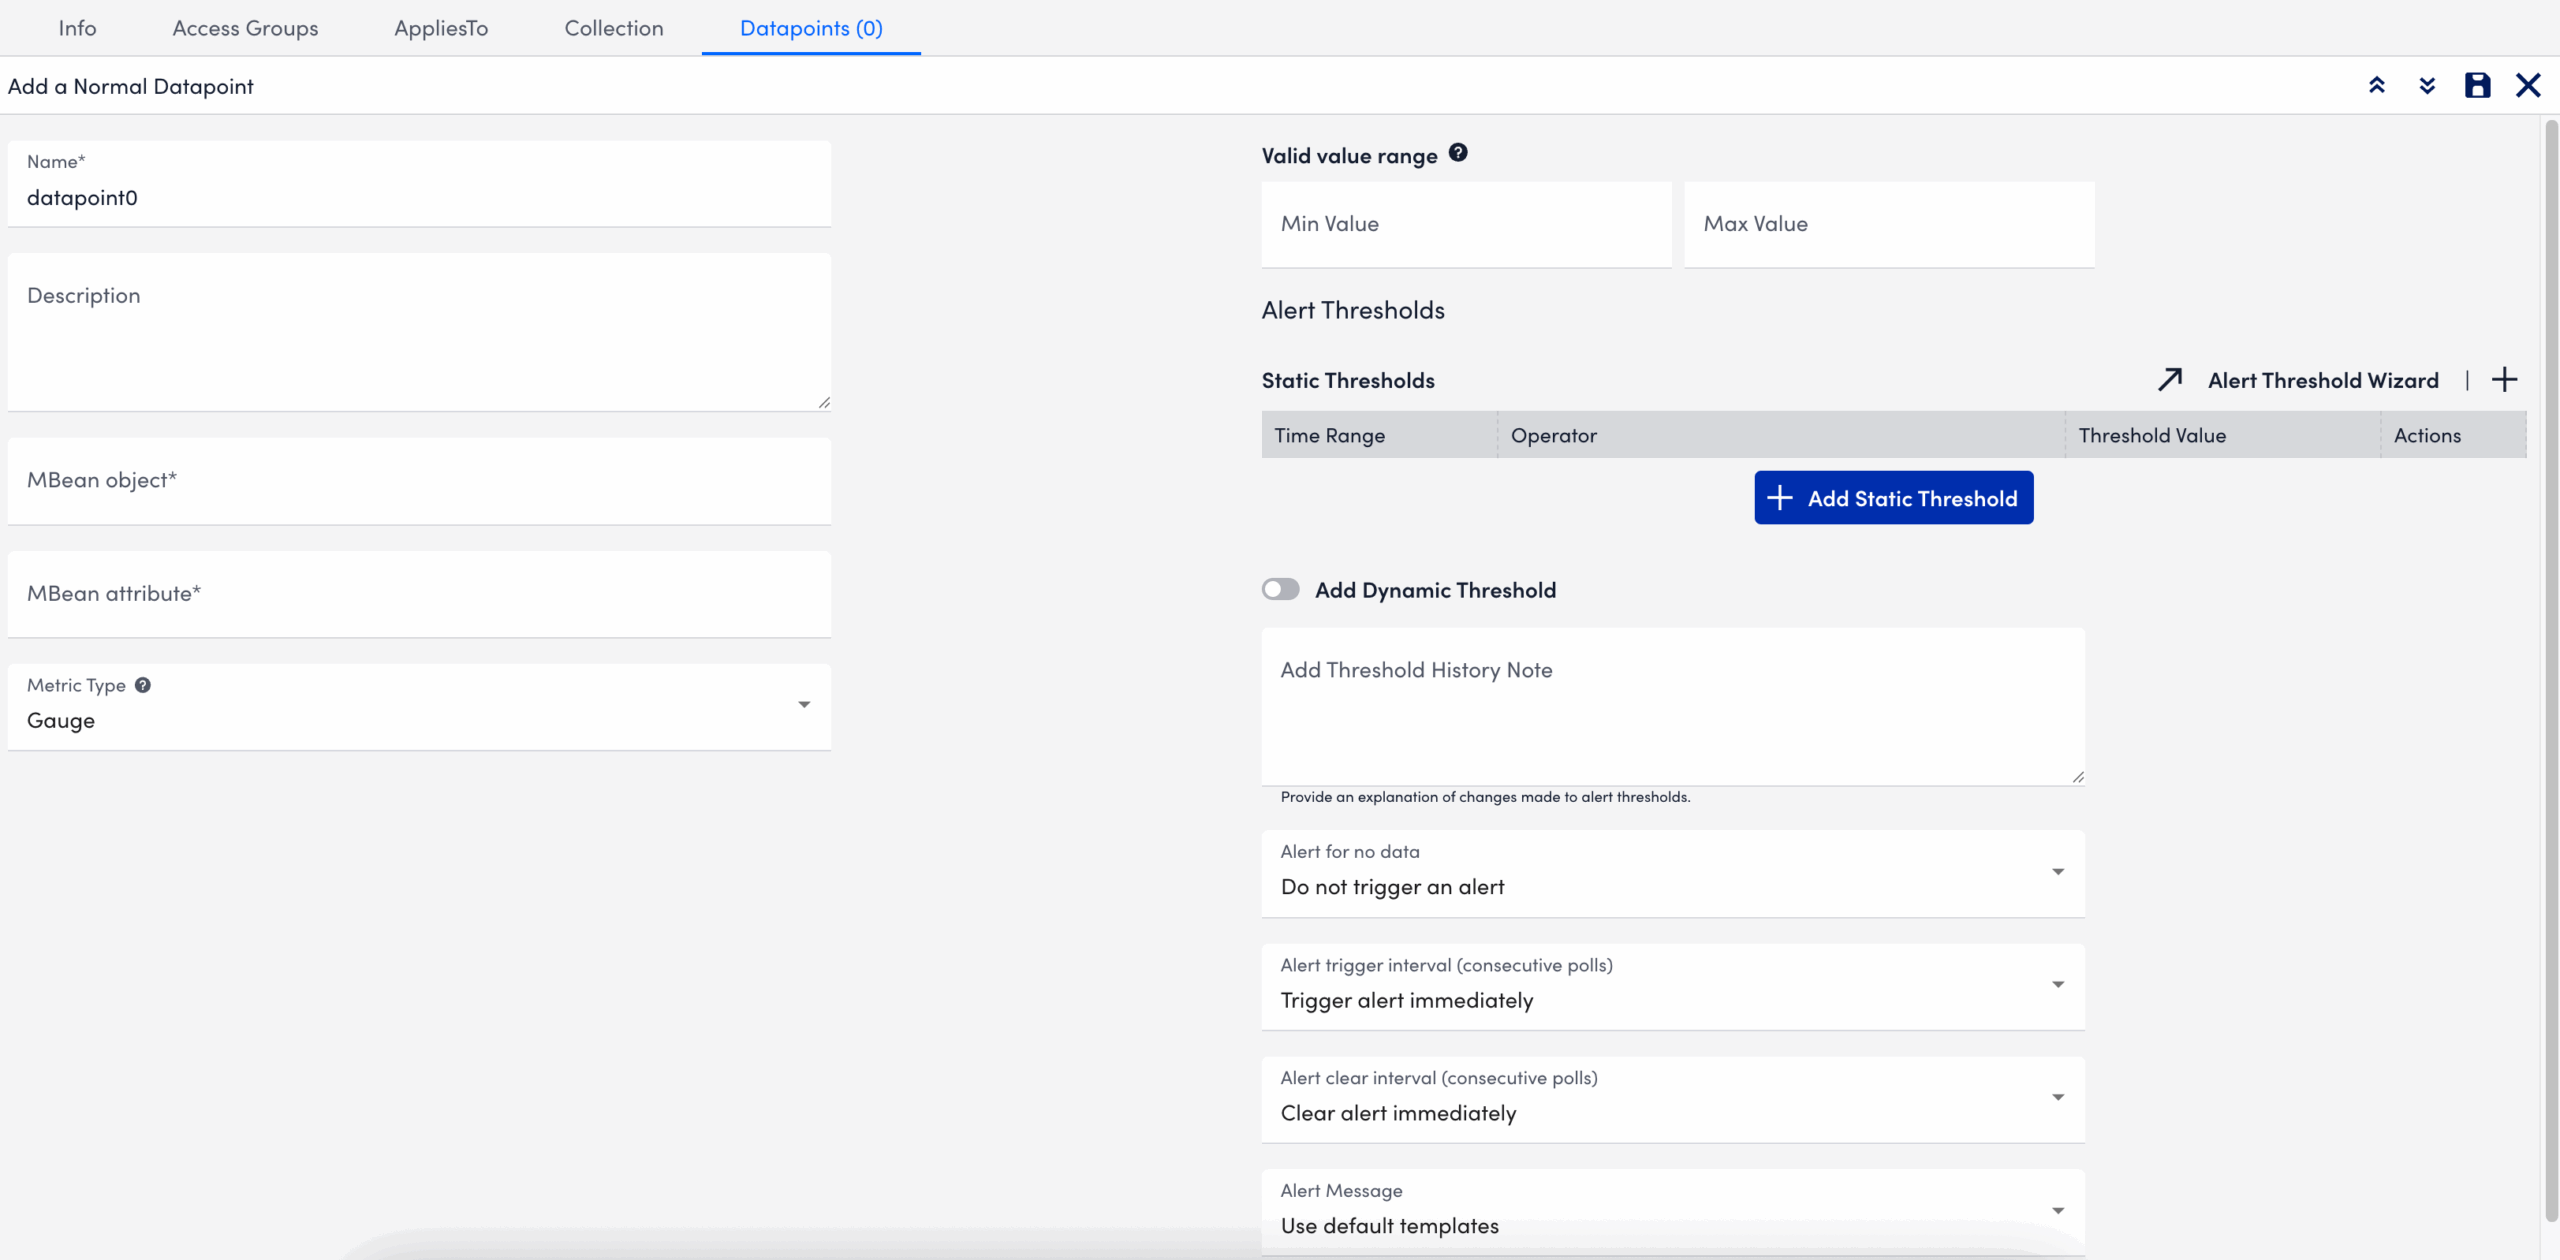
- Select Add a Normal Datapoint.
- In the Name field, enter a name for the datapoint.
- In the Description field, enter a description.
- In the MBean object field, enter the MBean path, including the domain and properties.
- In the MBean attribute field, enter the specific attribute or nested field to collect.
- In the Metric Type field, select the metric type for the response.
- Configure any additional settings, if applicable.
- Select
 Save.
Save.
The datapoint is saved for the module and you can configure additional settings for the module as needed. For more information, see Custom Module Creation or Modules Management.
Troubleshooting JMX Data Collection
Collector does not support the first-level JMX attributes that contain dots(.). By default, the Collector treats dots as path separators to access nested data. If the dot is simply a part of the attribute’s name and not intended to indicate a hierarchy, it can cause:
- ANullPointerException in the JMX debug window,
- NaN (Not a Number) values in the Poll Now results, and
- Failure to collect data correctly
Mitigating JMX Data Collection Issues
To prevent data collection errors with attributes that include dots, do the following:
- Identify the attribute name in your MBean that contains dots.
For example (attribute name):jira-software.max.user.count - Determine whether the dots are part of the attribute name or indicate a nested path.
- If the dots are part of the attribute name, escape each dot with a backslash (
\.).
For example:jira-software\.max\.user\.count - If the dots indicate navigation inside a structure, do not escape them.
- If the dots are part of the attribute name, escape each dot with a backslash (
- Enter the attribute in the LogicModule or JMX Debug window, using the escaped form only when the dots are part of the attribute name.
- Verify the data collection using the Poll Now feature or JMX debug window.
Attribute Interpretation Examples
| Attribute Format | Interpreted in Collector Code as |
jira-software.max.user.count | jira-software, max, user, count (incorrect if flat attribute) |
jira-software\.max\.user\.count | jira-software.max.user.count (correct interpretation) |
jira-software\.max.user\.count | jira-software.max, user.count |
jira-software.max.user\.count | jira-software, max, user.count |
The Active Discovery Port method attempts a TCP connection on a list of ports, and returns the ports that respond as instances, using the port value as both the Wildcard Alias and Wildcard Value.
Active Discovery Port Parameters
| Parameter | Description |
| Port # List | (Required) A list of ports, such as the following:
|
| Connection timeout | The default connection timeout is 10 seconds. The port is returned as an instance only if the TCP connection succeeds before the timeout. You can specify a timeout value (in seconds) to override the default value. |
Example: Memcached Detection with Port Discovery Method
If you run multiple memcached applications on a device, or on different ports on a variety of devices, you can use the “Port” method of Active Discovery to detect and monitor them automatically. The following steps modify a standard DataSource to detect a memcached application on any device that responds on any port from 11211 through 11300:
- In LogicMonitor, navigate to Settings > Modules. Locate or create the datasource for your memcached application. For more information, see Creating a Datasource.
- Under Arguments, select “Port” from the Discovery Method dropdown menu.
- In the Ports List field, enter “11211-11300”.
- Select Save.
If the memcached application is running on ports 11211, 11230, and 11231 of the host, this Active Discovery configuration returns 3 instances that correspond to each of the responding ports.
LogicMonitor provides common configuration monitoring modules from Scripted to BatchScript implements to enhance consistency and maintainability. BatchScript Config Monitoring improves module consistency, supports better maintainability, and aligns with platform-wide modernization efforts.
Requirements for BatchScript Config Monitoring
You must have LogicMonitor Collector version 36.200 or later to use the BatchScript-based ConfigSources.
Migrating to BatchScript Config Monitoring
If your environment currently uses Scripted ConfigSources, you can import the BatchScript versions without losing historical configuration data.
Recommendation: After verifying that the BatchScript modules are functioning correctly, disable the following corresponding Scripted ConfigSources to avoid duplicate data collection and alerts:
LogicModules in Package
LogicMonitor’s package for BatchScript Config Monitoring consists of the following LogicModules. For full coverage, ensure that all of these LogicModules are imported into your LogicMonitor platform:
| Display Name | Type | Description |
| Config Batch Metrics | DataSource | Collects metrics on configuration collection success and failure. |
| ConfigCheck_1_SFTP | PropertySource | Sets auto.config.type.sftp if SFTP-based collection is available. |
| ConfigCheck_2_SCP | PropertySource | Sets auto.config.type.scp if SCP-based collection is available. |
| ConfigCheck_3_Exec | PropertySource | Sets auto.config.type.exec if SSH Exec-based collection is available. |
| Dynamic Configs (Direct Batch) | ConfigSource | Handles dynamic config collection using direct methods. Does not alert by default. |
| Standard Configs (Direct Batch) | ConfigSource | Collects configs using direct methods and alerts on non-filtered changes. |
When setting static datapoint thresholds on the various metrics tracked by this package’s DataSources, LogicMonitor follows the technology owner’s best practice KPI recommendations.
Recommendation: As necessary, adjust these predefined thresholds to meet the unique needs of your environment. For more information on tuning datapoint thresholds, see Static Thresholds for Datapoints.
Edwin AI models have the option to use list-based correlations, enabling you to group deduplicated alerts based on shared values in list-type fields, such as services, locations, or tags. List-based correlation is ideal when multiple alerts involve entities that support overlapping applications or features (for example, the same business service or infrastructure tier).
Models that use list-based correlation work by doing the following:
- Edwin evaluates alerts that contain values in a specified list-type field.
- Edwin calculates the number of exact matches between list items in the specified field.
- If the number of matching items equals or exceeds theminimum overlap count defined in the model, the alerts are grouped into a cluster.
Important: Only exact matches between list items are counted.
Configuring a list-based correlation requires setting the following parameters:
- Delimiter (for example, comma, semicolon)
- Trim rules (defining the clean brackets or quotes)
- Escape character (for special parsing)
For more information on how to configure a model using list-based correlations, see Edwin AI Model Creation.
List-based Correlation Scenarios
Use the following table to help you understand how Edwin applies list-based correlation logic:
Alerts:
- Alert A:
[inventory, cart, payment] - Alert B:
[inventory, orders]
| Scenario | Minimum Overlap Count | Overlapping Items | Result | Reason |
| 1 | 1 | [inventory] | Clustered | At least 1 matching item is found. |
| 2 | 2 | [inventory] | Not clustered | Only one match; required minimum is 2. |
| 3 | 3 | [inventory] | Not clustered | Only one match; required minimum is 3. |
JMX Active Discovery is a LogicMonitor feature that automatically detects and monitors Java Management Extensions (JMX) objects on a device.
It can identify the following:
- All instances of a specified MBean.
- Instances filtered by specific attributes of a fully defined MBean.
- Multiple Java instances running on different ports. For each instance, it enumerates the available MBean objects.
This results in a structured array of discovered JMX objects across one or more Java Virtual Machines (JVMs), enabling streamlined monitoring in complex Java environments.
Note: LogicMonitor uses the device properties jmx.user and jmx.pass for authentication. These properties store the username and password needed to access the JMX interface of the monitored Java application.
Requirements for Enabling JMX Active Discovery
To configure JMX Active Discovery, toggle the Enable Active Discovery switch.
This enables LogicMonitor to automatically find the DataSource’s instances and the resources they apply to. For more information, see Active Discovery.
Parameters for JMX Active Discovery
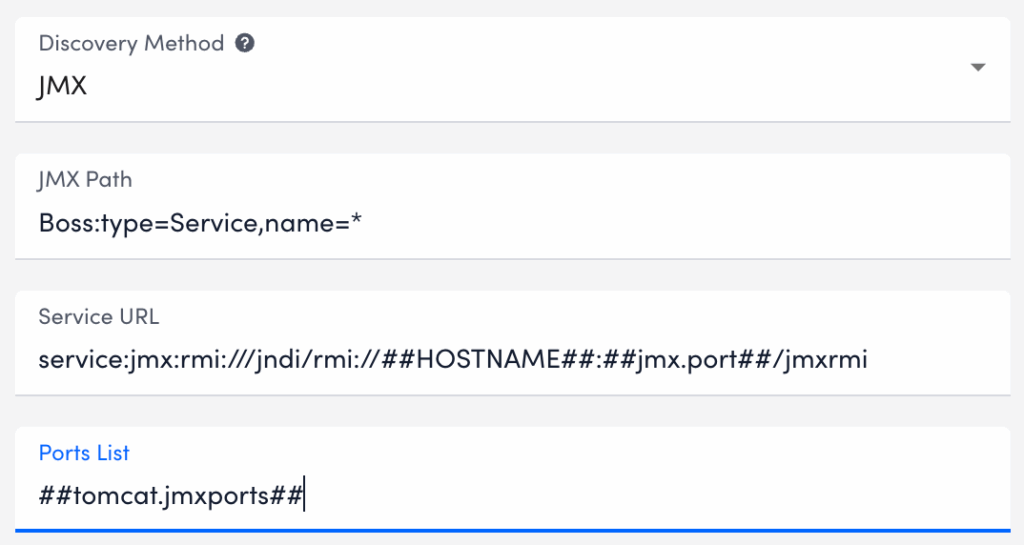
You need to define key parameters that determine how LogicMonitor identifies and connects to JMX objects.
| Parameter Name | Description |
| JMX Path | Specifies the location of the MBean or MBean attribute to be discovered. The path must include the JMX domain and object name. Example: Catalina:type=Manager,host=localhost,path=* |
| Service URL | (Optional) Defines the JMX service URL. If not provided, LogicMonitor uses the port defined at the device level using the jmx.port property. In that case, the default value is: service:jmx:rmi:///jndi/rmi://##HOSTNAME##:##jmx.port##/jmxrmiYou can also use the ##PORT## token within the Service URL to iterate over multiple ports defined in the Ports List field. |
| Ports List | Lists the ports LogicMonitor should check for JMX objects. Use a comma-separated list, typically populated by the ##jmx.ports## token. This enables flexible, per-device or per-group port configuration. |
Enabling JMX Active Discovery
- In LogicMonitor, navigate to Modules.
- Select the DataSource you want to edit (for example, a Windows-based DataSource).
- Select
 Edit.
Edit. - Select the Active Discovery tab.
- Toggle the Enable Active Discovery switch.
- In the Arguments section, select “JMX” from the Discovery Method dropdown.
- In the JMX Path field, enter the path to the MBean object or attribute you want to discover.
The structure and type of the attribute specified in the JMX Path determines how instances are discovered:- Primitive type (string or integer) — The attribute’s value is returned as both the alias and the instance value.
- Array — The array index is used as the alias, and each element is returned as a separate instance.
- Map — The keys are used as aliases, and the values are returned as instance values.
For example: To return the serverInfo value from the Catalina:type=Server MBean, use the following format: Catalina:type=Server:serverInfo
This would return an instance value such as: Apache Tomcat/5.5.25
You can use this value in filtering.
- (Optional)In the Service URL field, enter the URL of the JMX server.
- In the Ports List field, enter a comma-separated list of ports to scan for JMX objects.
Note:
- Use
##WILDVALUE##to represent the discovered MBean object. - Use ##WILDVALUE2## to represent the discovered attribute value if port discovery is also in use.
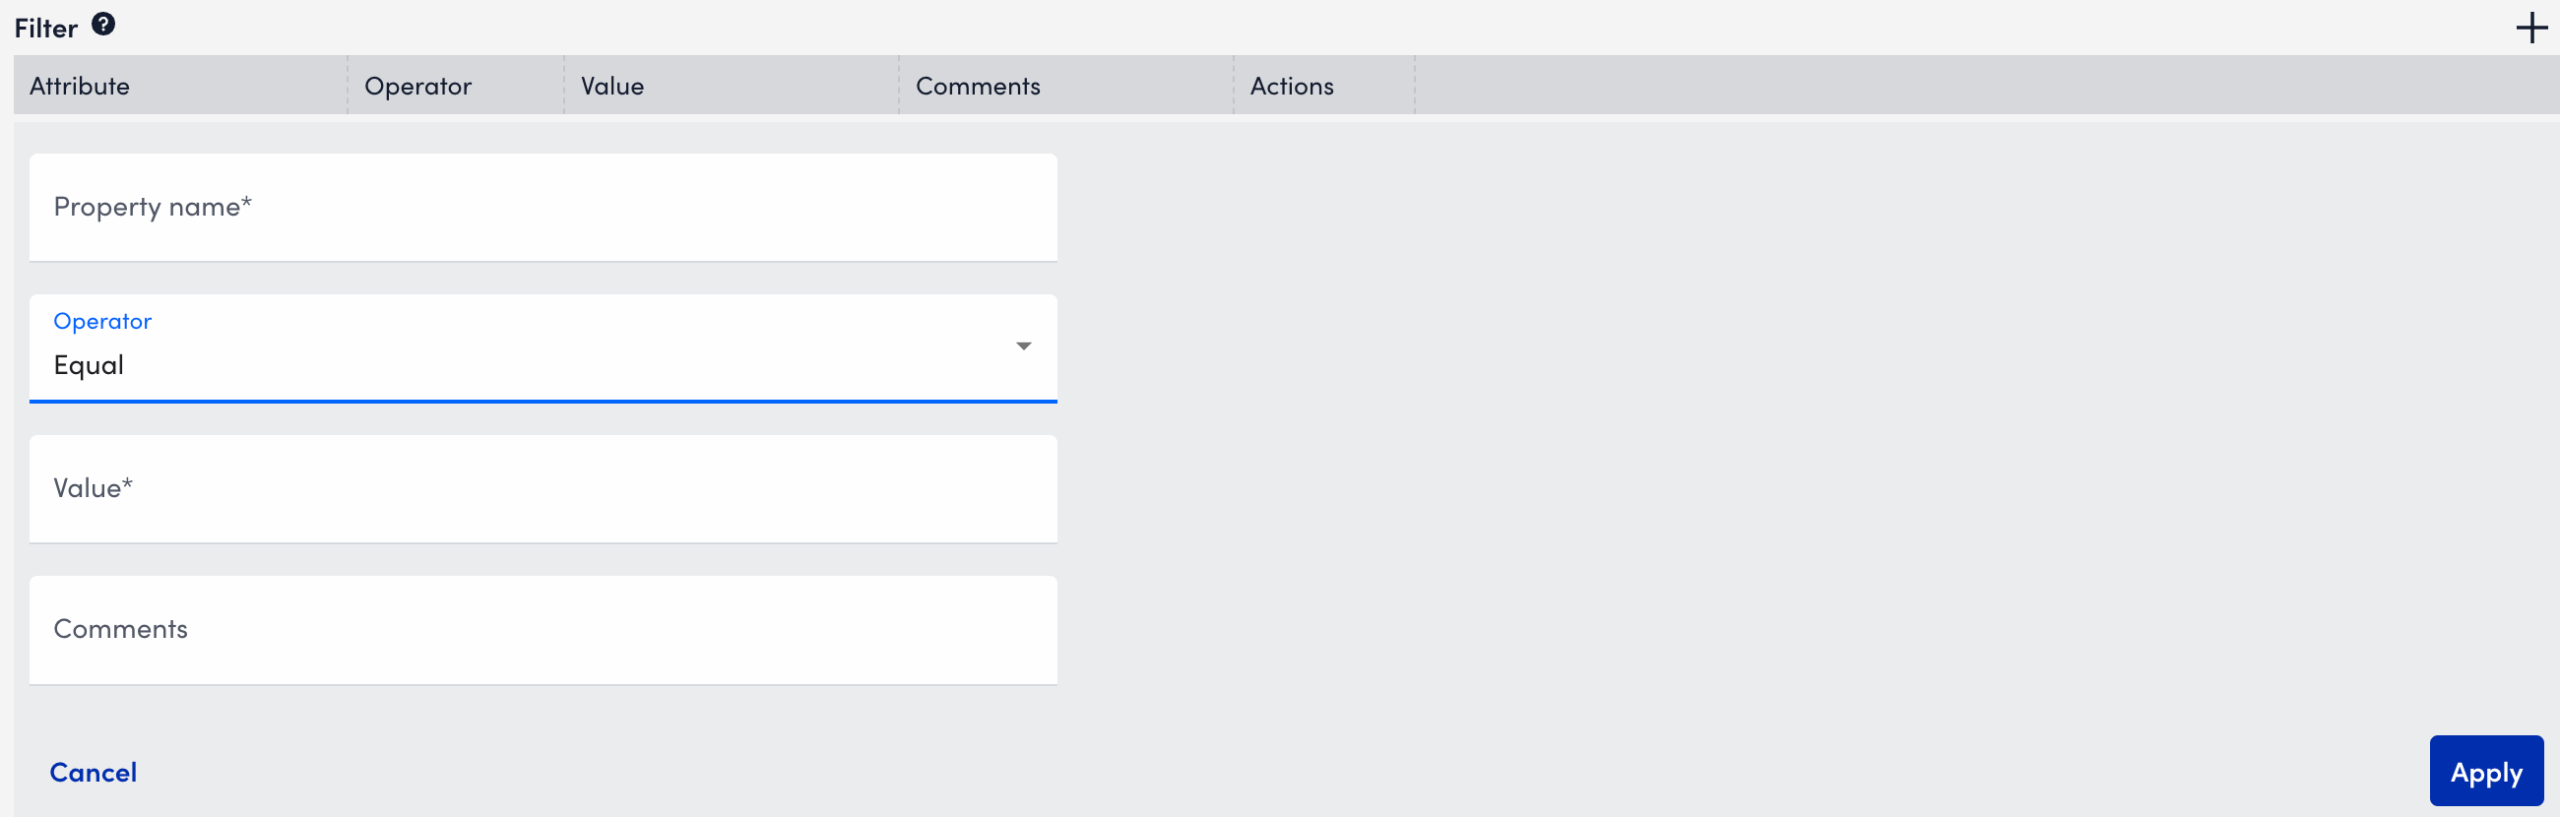
- You can filter discovered instances based on ports, MBean paths, or attribute values.
To add a filter do the following:- Select Add Filter.
- In the Property Name field, enter
##WILDVALUE##or##WILDVALUE2##if using port-based discovery. - Select an Operator from the dropdown list.
- In the Value field, enter the value to filter against.
- (Optional) Enter a Comment to describe the filter purpose.
- Select Apply to save the filter.
- Select Save.
LogicMonitor now automatically discovers JMX objects across the specified Java instances, enabling monitoring of key performance metrics without manual setup.
Use the SNMP Trap MIBs to upload MIB files for SNMP Trap Logs ingestion. When you upload a MIB and dependent files, LogicMonitor automatically validates the files and uses them for SNMP trap translation. This provides an efficient method for uploading MIB files in LogicMonitor.
Note: If you are leveraging the MIBs to JSON Converter Utility to convert MIB files, see Translating SNMP Traps using Custom MIBs for more information.
Note: For SNMP Trap logs translation, the Collector prioritizes MIBs uploaded through the SNMP Trap MIBs setting over JSON files placed in the
SNMP Trap MIB Validation
MIB validation consist of the following:
- During validation, LogicMonitor verifies the file extension and content of the MIBs. It also validates the MIB dependencies (the MIB names mentioned in the
IMPORTSsection of the MIB being uploaded) across files currently being uploaded and the previously uploaded MIB files. - Validation results are retained for two hours. You must add the valid MIB files within two hours or start a new validation request.
Uploaded SNMP Trap MIB Details
You can view the following details about the uploaded MIBs on the SNMP Trap MIBs page:
| Column Name | Description |
| MIB | Displays the MIB definition. Note: The uploaded MIB file contains the MIB definition. The MIB is not necessarily named after the MIB definition. |
| Status | Displays the following supported statuses of the uploaded MIBs:
|
| Time Processed | Displays the date and time when the MIB was uploaded and processed. |
| Status Details | Displays the error message and the reason for failing to process the MIB file. |
Note: You cannot delete MIB files uploaded to LogicMonitor portal.
Requirements for Uploading SNMP Trap MIBs
To upload SNMP trap MIBs, you need the following:
- To upload MIB files, you need a LogicMonitor user with the “Manage” permission set. For more information, see LogicMonitor Roles.
- LogicMonitor Collector version must be EA 38.300 or later to consume the uploaded MIBs for trap translation.
- The Collector must be configured to ingest SNMP trap logs using any of the SNMP trap processing preferences. For more information, see SNMP Traps Processing Preference.
- The MIB and all dependent files must be available to upload.
- The MIB files that you want to upload must meet the following requirements:
- Size of a single MIB file must be less than 2 MB.
- Only a single MIB definition is allowed per MIB file.
- The cumulative limit across all uploaded files in a single request is 9 MB for a single upload request. The total MIB upload limit is 1000 MIB files.
- The supported file extensions are
.mib,.txt, or files with no extension.
Uploading SNMP Trap MIBs
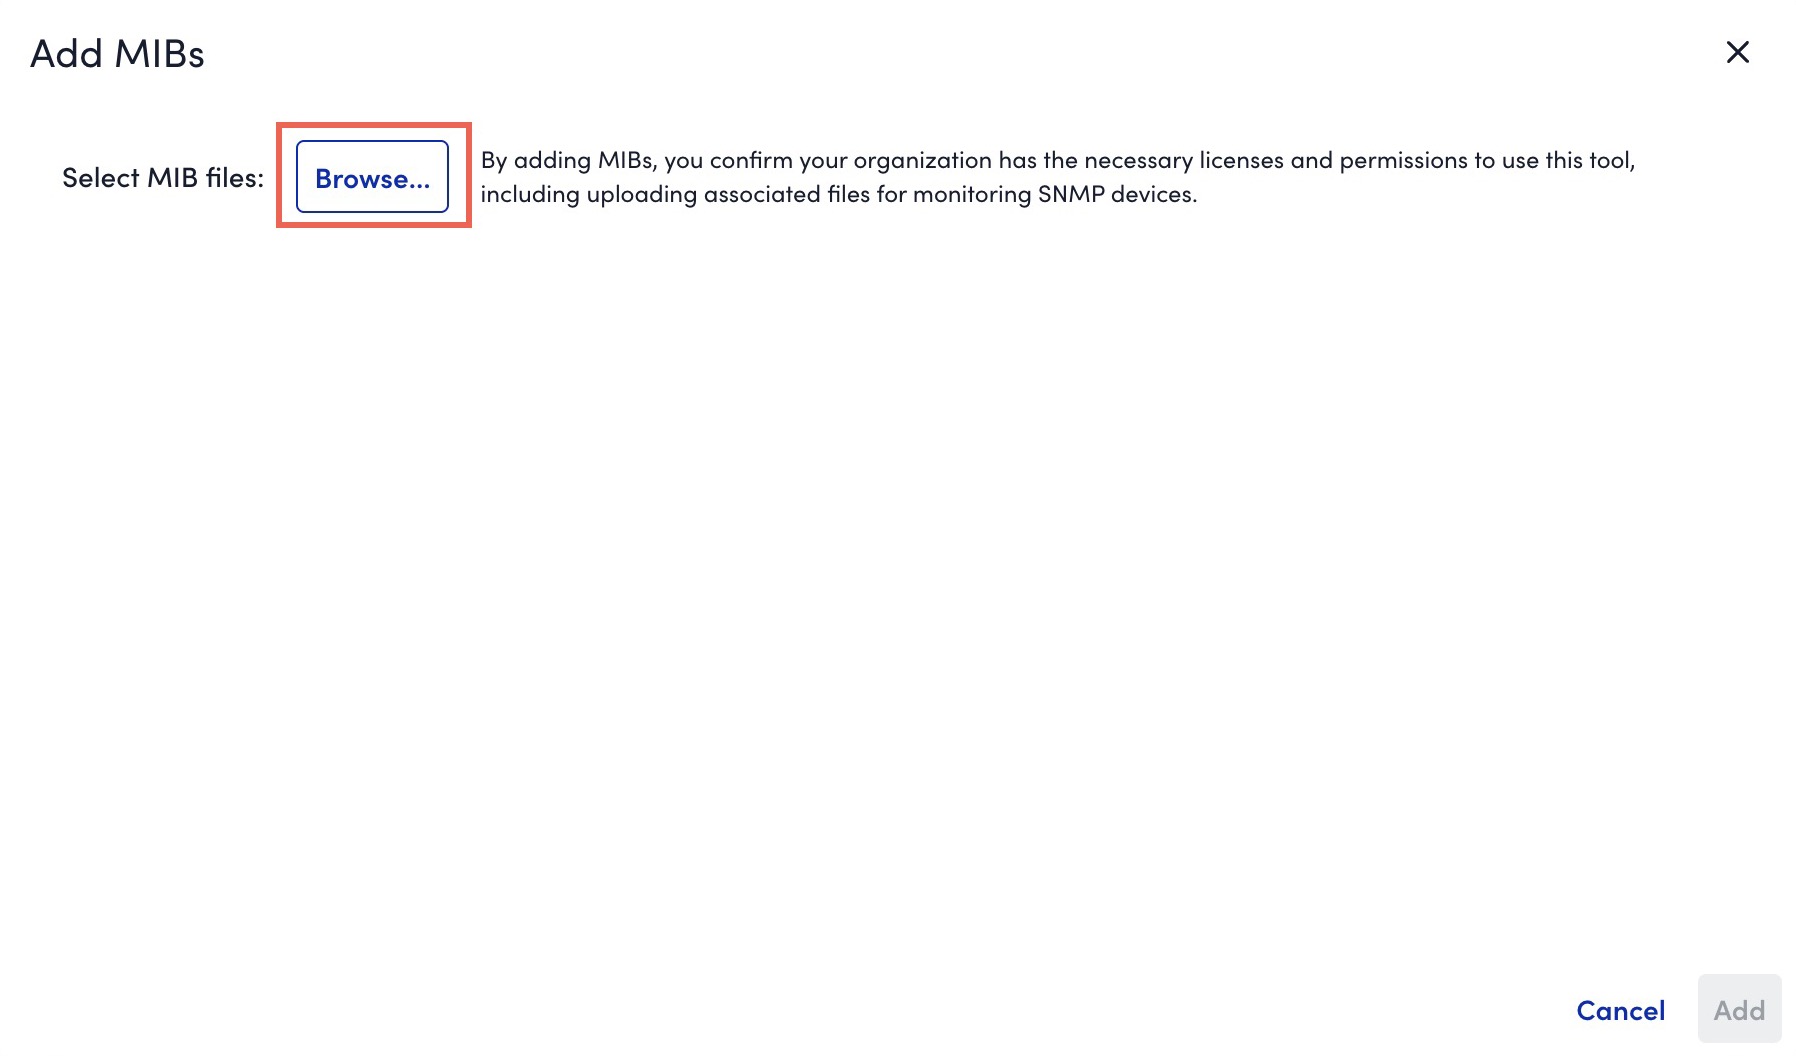
- In LogicMonitor, navigate to Settings > SNMP Trap MIBs.
The SNMP Trap MIBs page is displayed.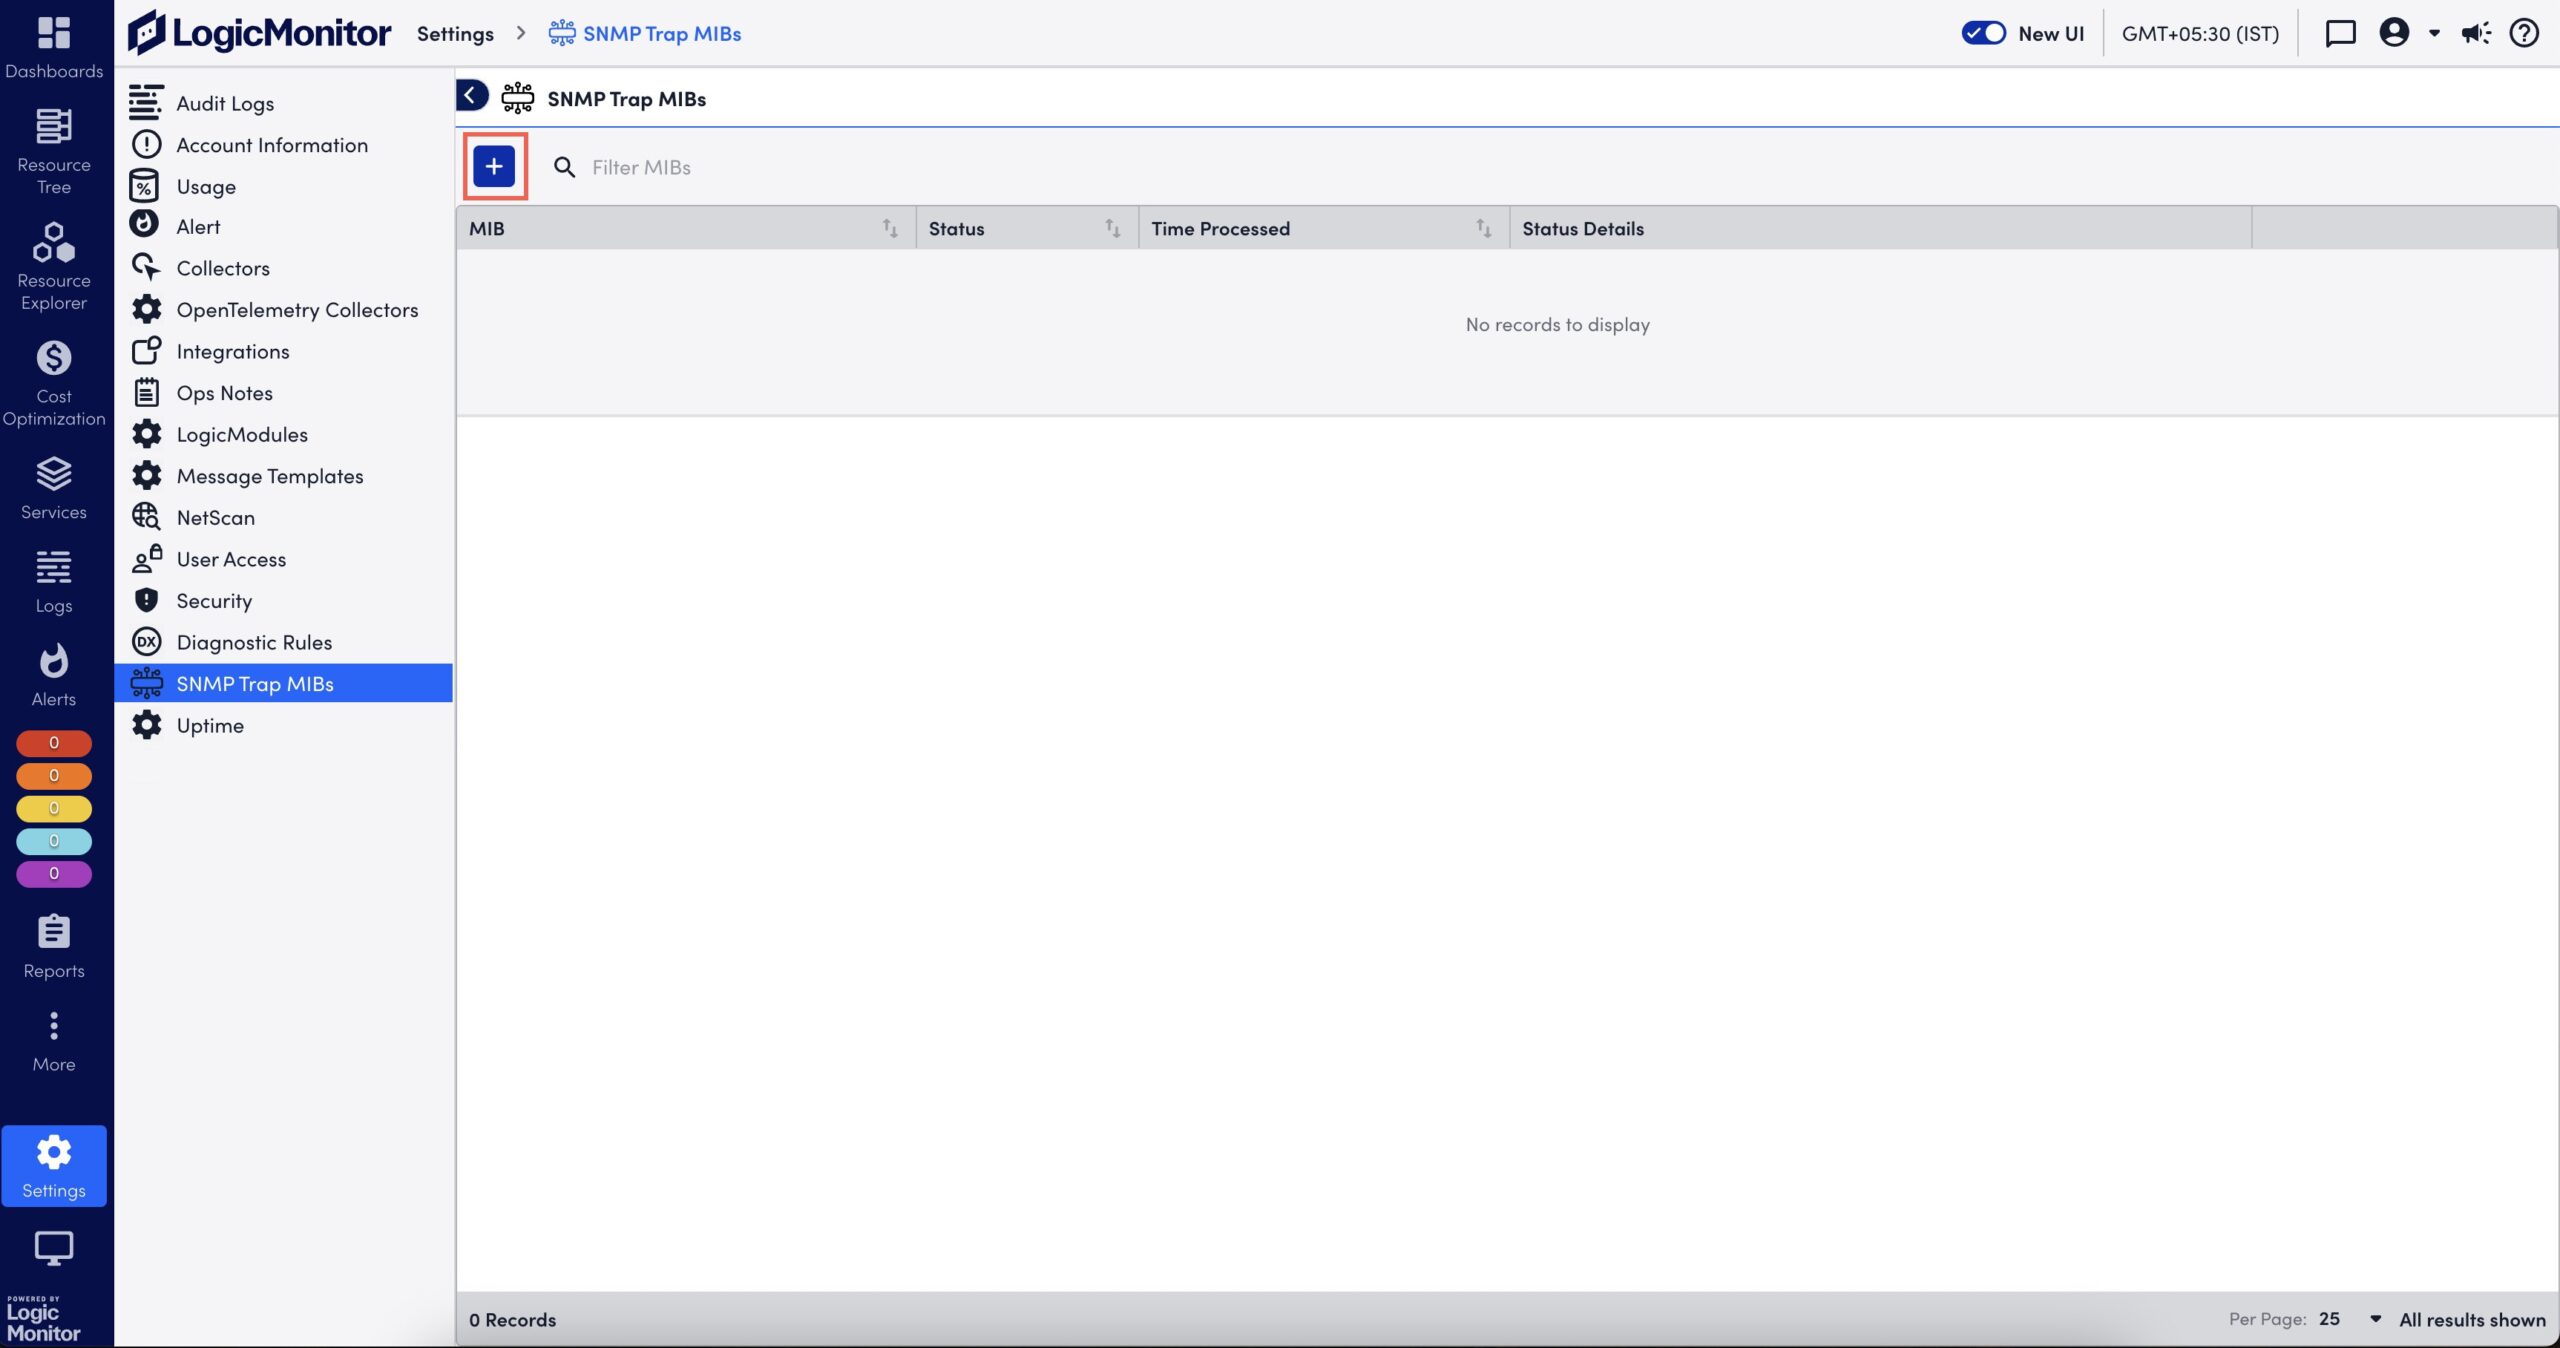
- Select
 to upload a MIB file.
The Add MIBs dialog box is displayed. - Browse and select one or multiple MIB files.
- If you are not able to upload all dependent MIBs together, you must first upload the parent MIBs (or the MIBs mentioned in Missing Dependencies message).
- If a MIB fails validation due to invalid file extension, you can rename it with
.mib,.txt, or a file without extension. - If a MIB file that you uploaded has a MIB definition that already exists in the system, during the MIB validation, a message indicating that the existing MIB will be replaced with the newly uploaded MIB is displayed. If you continue with the upload, the existing MIB definition is overwritten by the MIB definition in the new MIB file.
- If a file fails validation while other files succeed, you can do one of the following:
- Upload necessary MIBs to resolve dependency issues without losing prior result.
- Add valid MIBs immediately for further processing.
- If multiple files with the same MIB definition are included in a single upload request, only one of the files is considered for upload.
- The system validates the files and displays the validation result. If the validation fails due to a missing dependent file, upload the missing file.
- Select Add X valid MIBs.
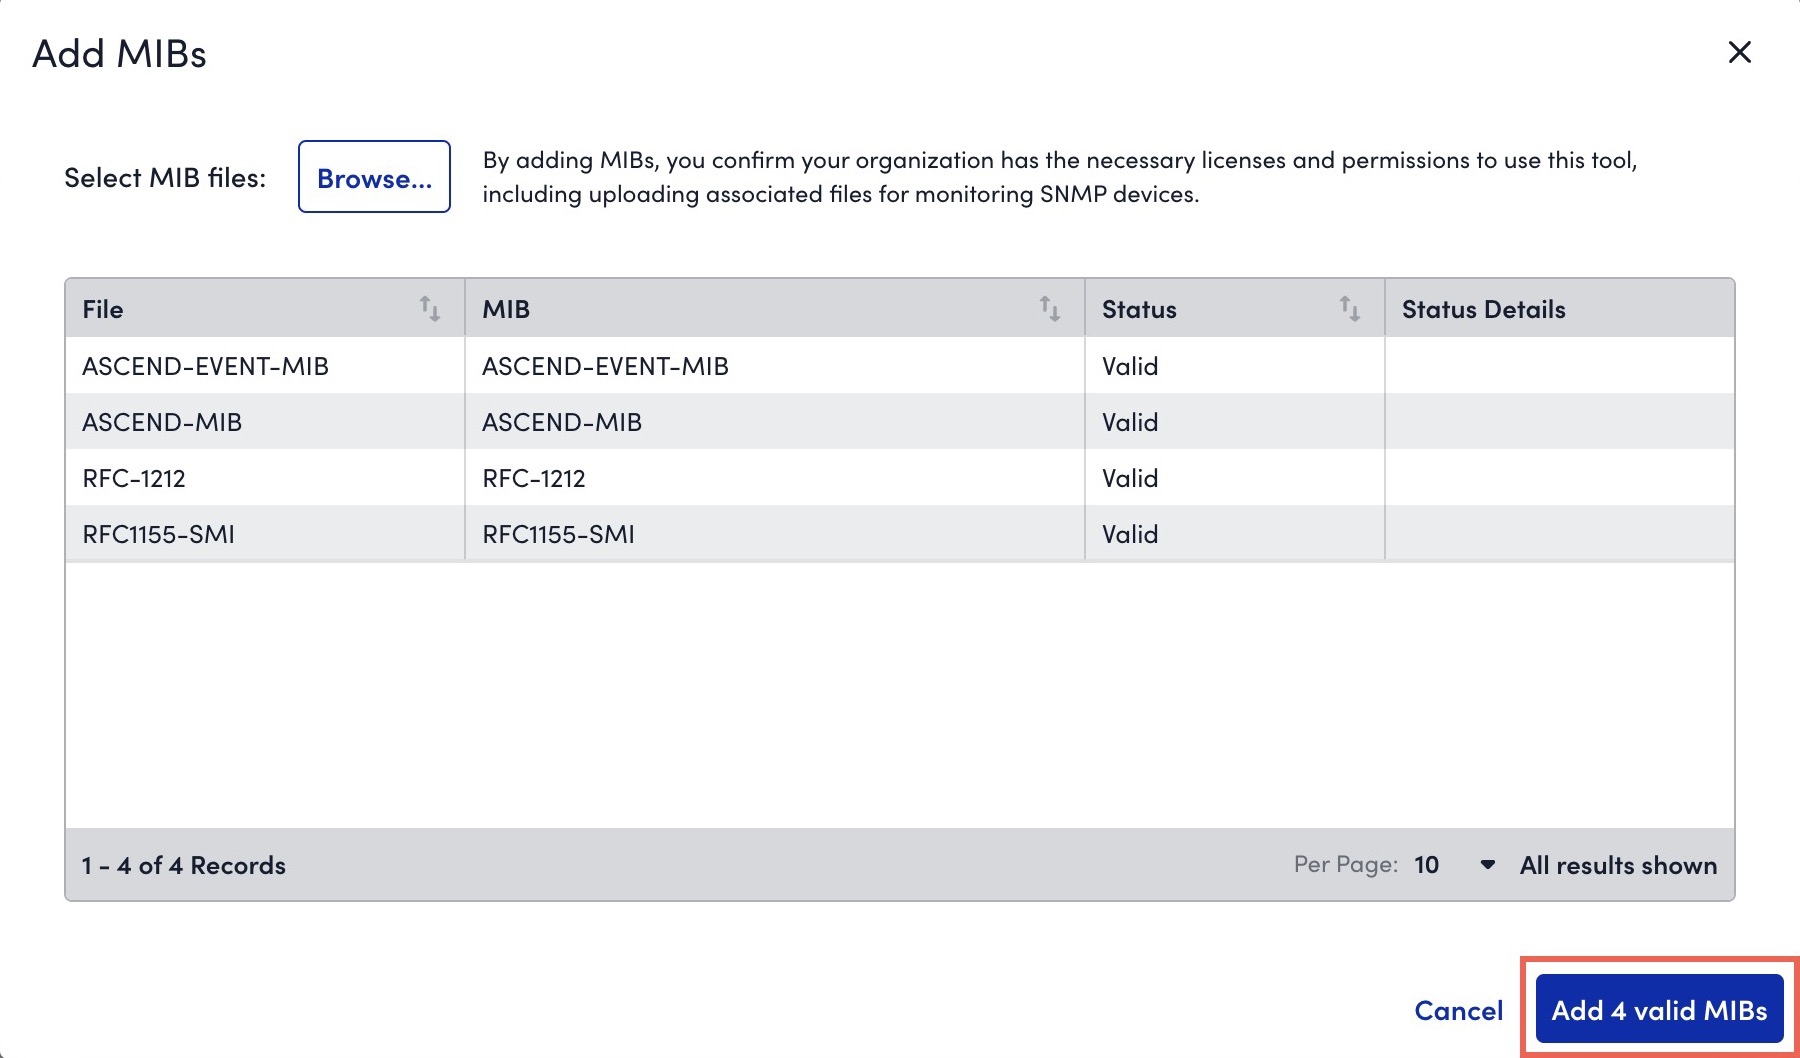
The valid MIBs are uploaded to LogicMonitor.
On the SNMP Trap MIBs page, the MIBs are processed and you can view status of the uploaded MIBs. For more information, see Uploaded SNMP Trap MIB Details.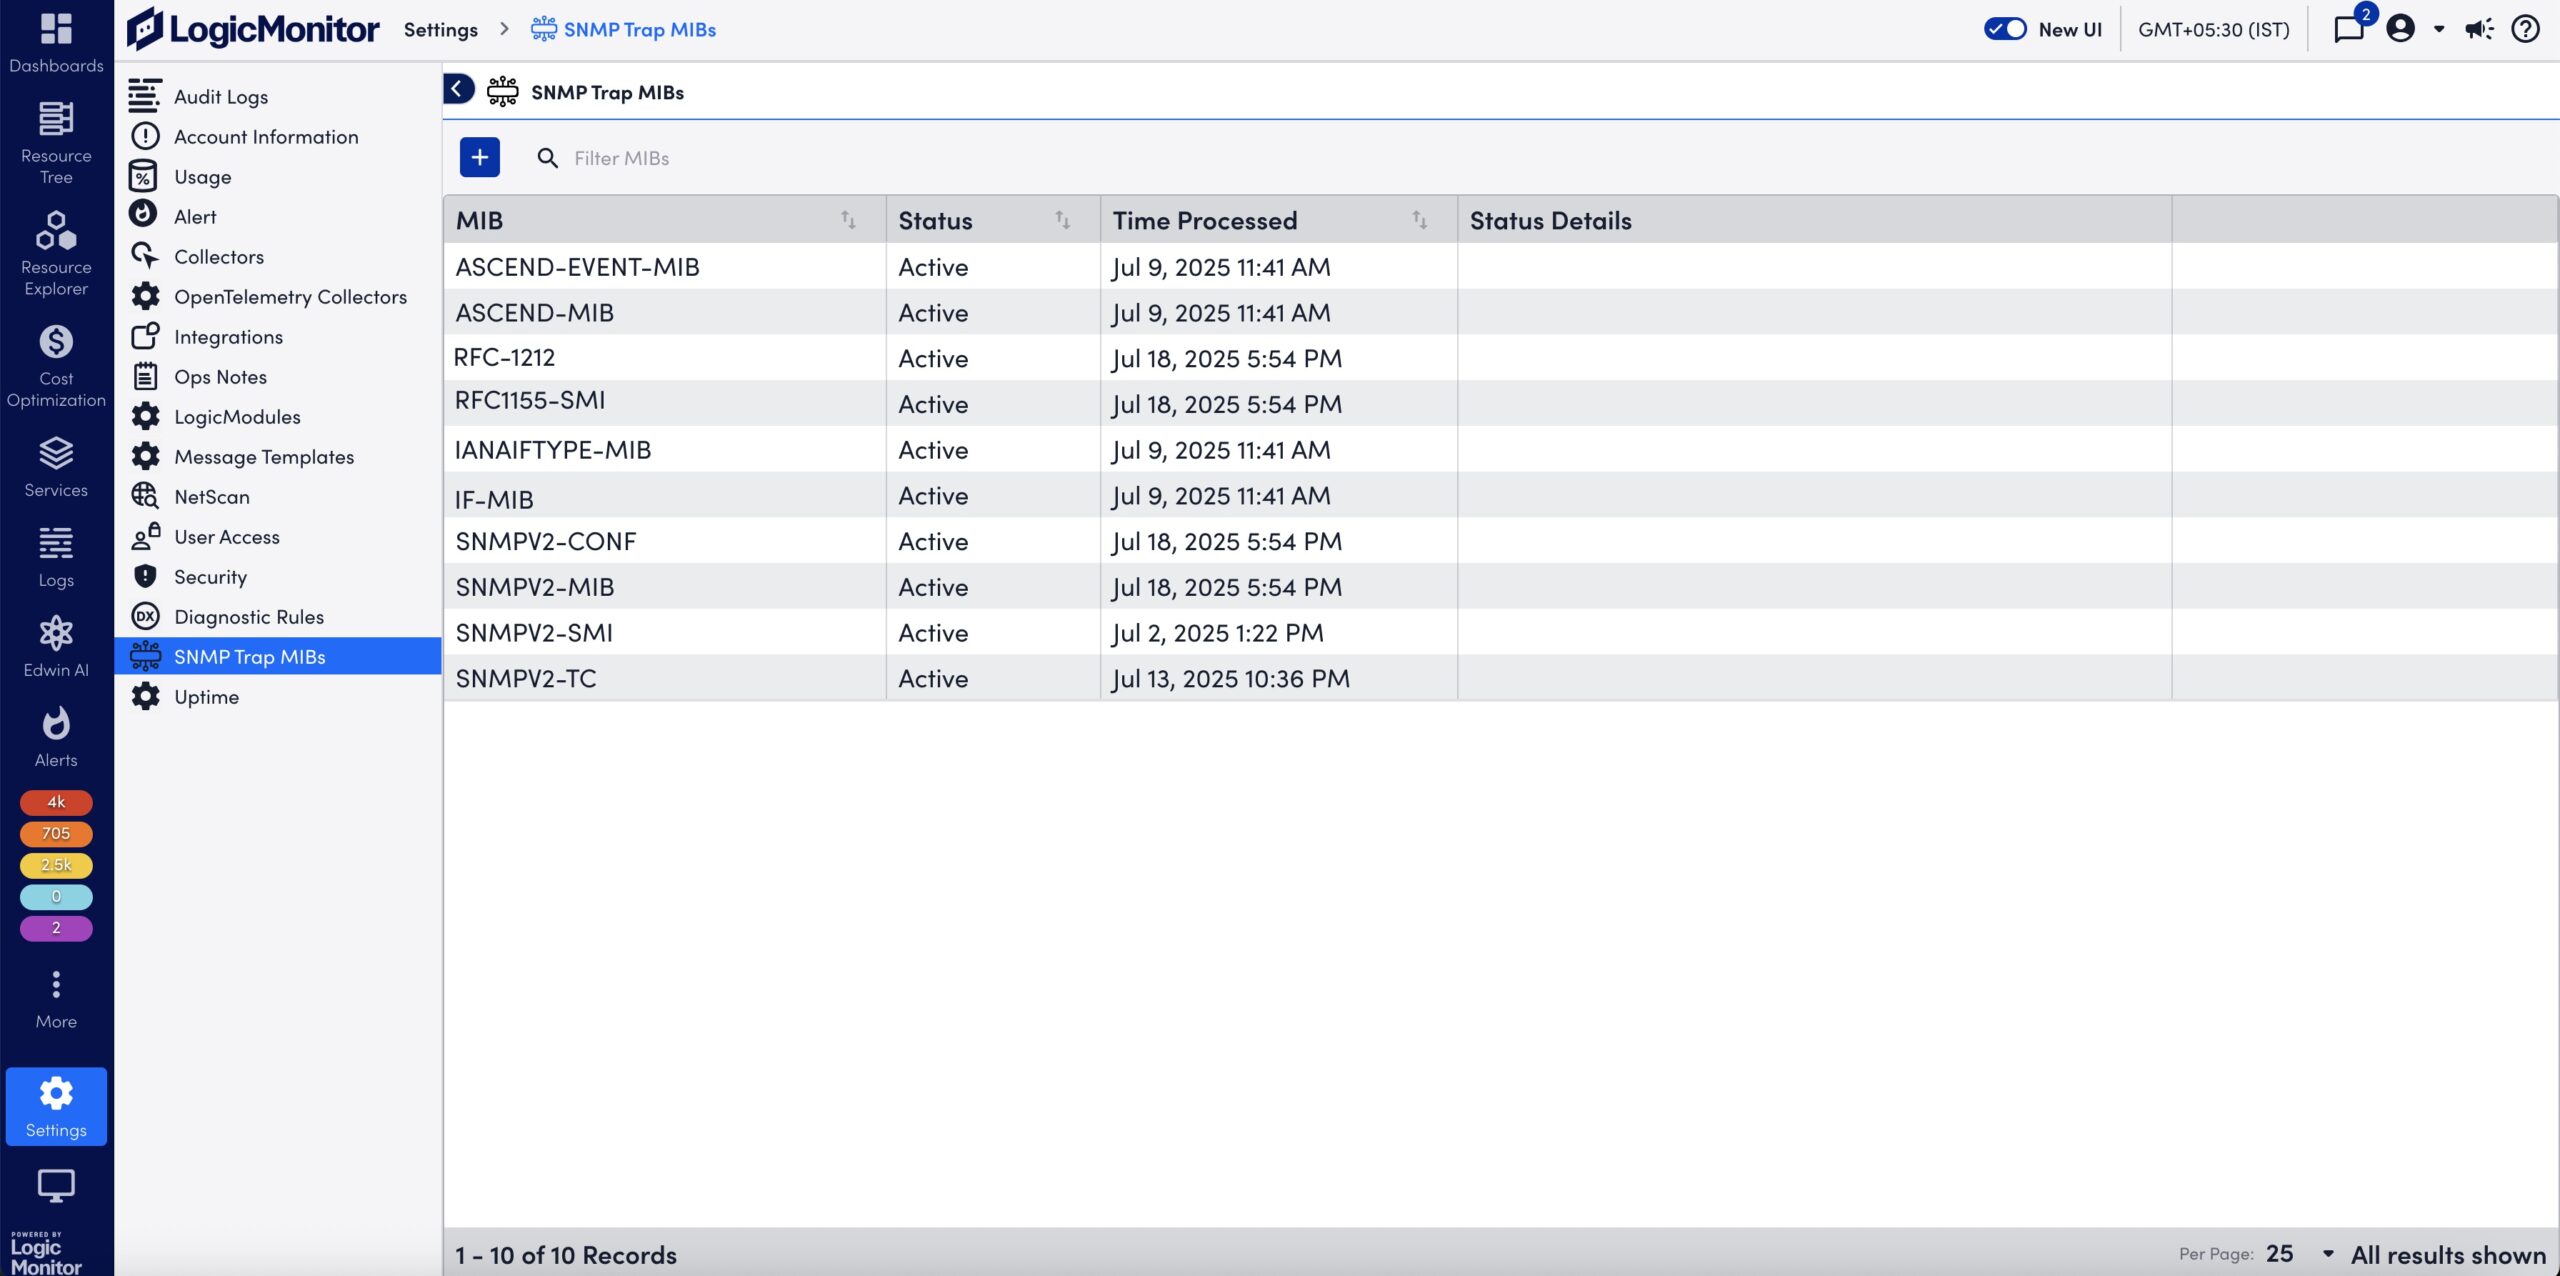
The Cost by Tag is a multi-instance DataSource that enables you to collect values for tagged items in the AWS Cost and Usage report, providing a detailed cost breakdown. LogicMonitor automatically adds the AWS Cost by Tag DataSource when you configure AWS billing.
To use this DataSource in a multi-instance configuration, add instances using one of the following methods:
- Enabling Active Discovery (AD)—When AD is enabled for the Cost by Tag DataSource, LogicMonitor automatically discovers one instance per tag value. This enables you to avoid manually entering values for each tag.
For example, if you use the Cost by Tag DataSource to track applications, and your environment has 100 applications, LogicMonitor automatically discovers and adds each application as a separate instance associated with your AWS account. For more information, see Active Discovery. - Manually adding instances—You can manually add instances to a DataSource by entering each tag value that you want to track.
For each tag you want to track costs for, you must use a different DataSource. You can clone the DataSource as needed. For more information, see Cloning a LogicModule.
Recommendation: Use the Cost by Tag DataSource provided by LogicMonitor as a template to clone as needed.
Requirements for Monitoring the AWS Cost by Tag DataSource
To monitor the AWS Cost by Tag DataSource you need to do the following:
- You must set up monitoring for AWS billing. For more information, see AWS Billing Monitoring Setup.
- If your environment does not include the Cost by Tag DataSource, you must import it. For instructions on importing DataSources, see LogicModule Updates.
Enabling Active Discovery for the Cost by Tag DataSource
- In LogicMonitor, navigate to Settings > LogicModules.
- In the Filter Modules… search bar, search and select the “AWS_Billing_CostByTag” from the DataSources list.
- Select
 Edit to expand the Active Discovery options.
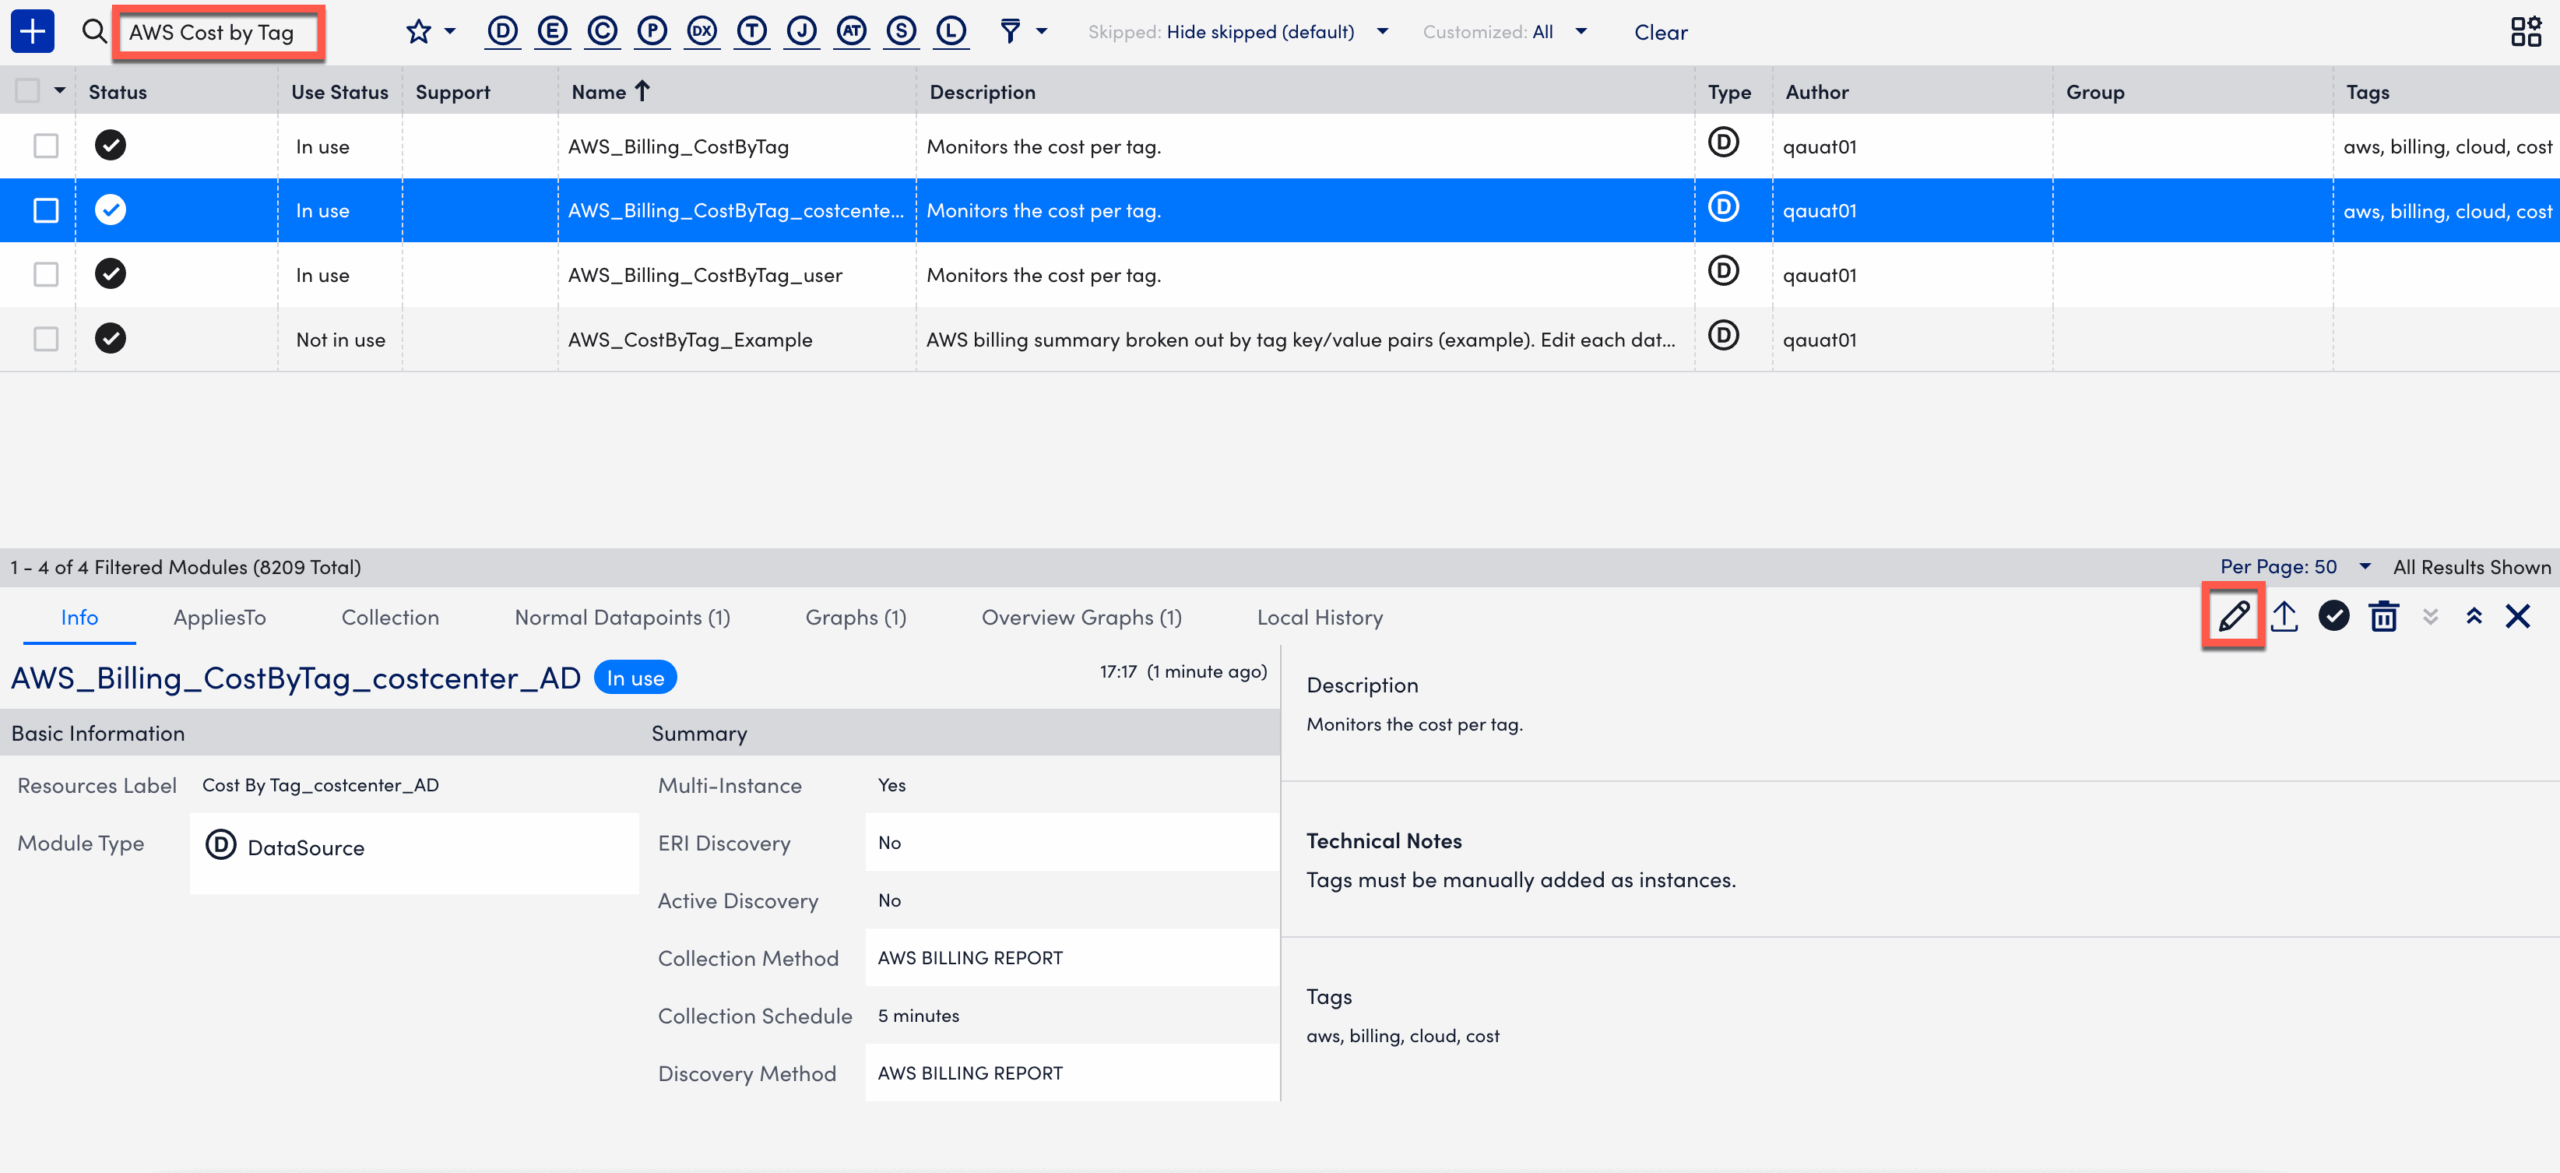
- Update the values in the Name, Resource Label, and Description fields, if necessary.
- Toggle the Enable Active Discovery switch. This enables LogicMonitor to dynamically identify and track new values for user-defined tags in your AWS billing data.
- Select the Active Discovery tab.
- In Arguments, select “AWS BILLING REPORT” from the Discovery Method dropdown.
- In the AWS Billing Report Attribute field, enter a the tag to track.
You must prefix the value withuser.
For example, enteruser:OSto discover the supported operating systems.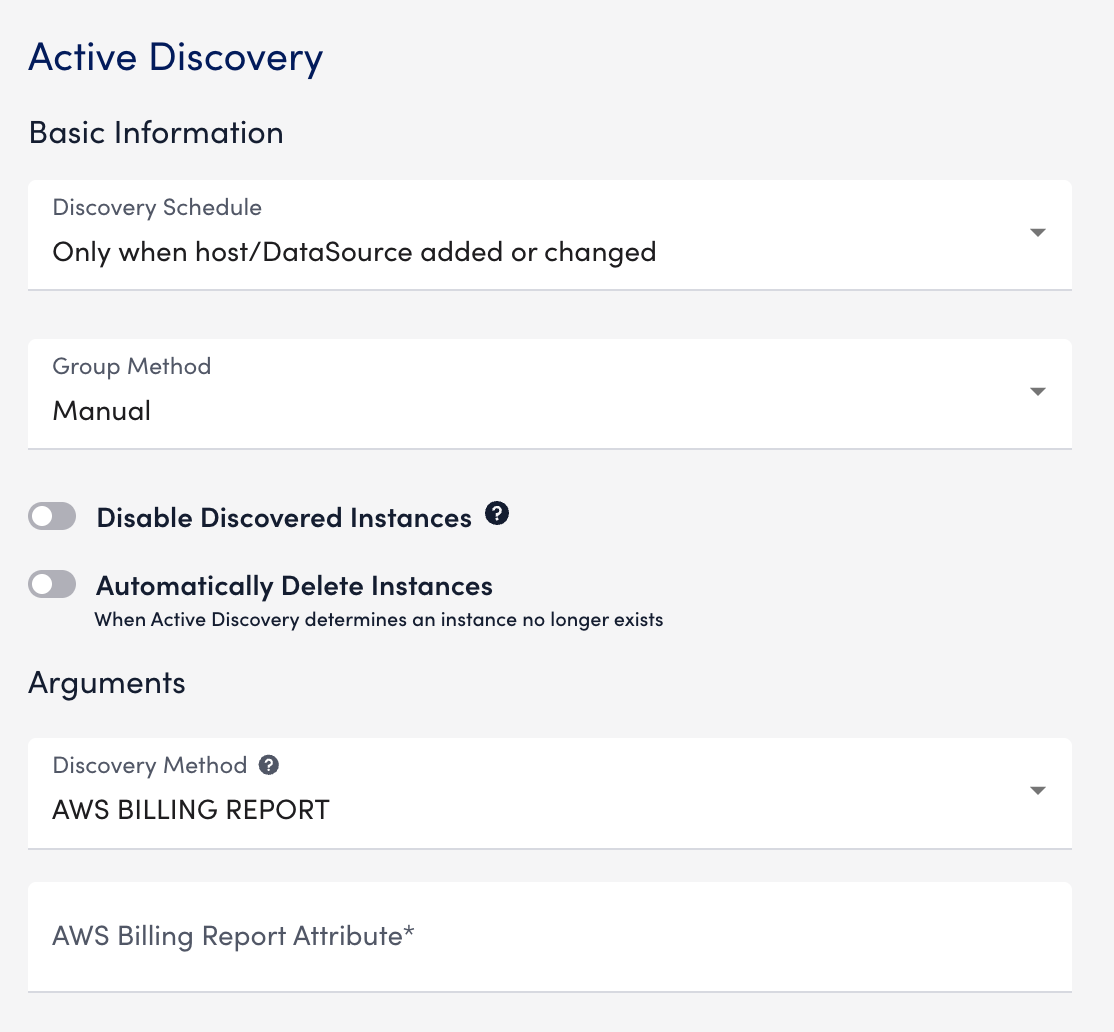
Important: LogicMonitor discovers the user-defined tags from the Cost and Usage Report.
- Select Save.
LogicMonitor discovers all values and monitors costs for the specified key.
Manually Adding Instances to the Cost by Tag DataSource
- In LogicMonitor, navigate to the Resource Tree.
- Select the AWS account where you want to add the instance.
- Select the account-level resource.
- Select
 More, then select Add Monitored Instance.
The Add Monitored Instance settings panel is displayed.
Note: If you currently have a Cost by Tag DataSource with instances, you can add instances from the Instances tab. - In the Add Monitored Instance settings panel, enter the following information:
- In the DataSource field, enter “Cost by Tag” and select a suitable value.
- In the Name field, enter the display name for the instance in the Resource Tree.
- In the Wildvalue field, enter the tag you want to track. Prefix the value with “
user“.
For example, enteruser:OSto discover operating system tags. - (Optional) In the Description field, enter a description for the instance.
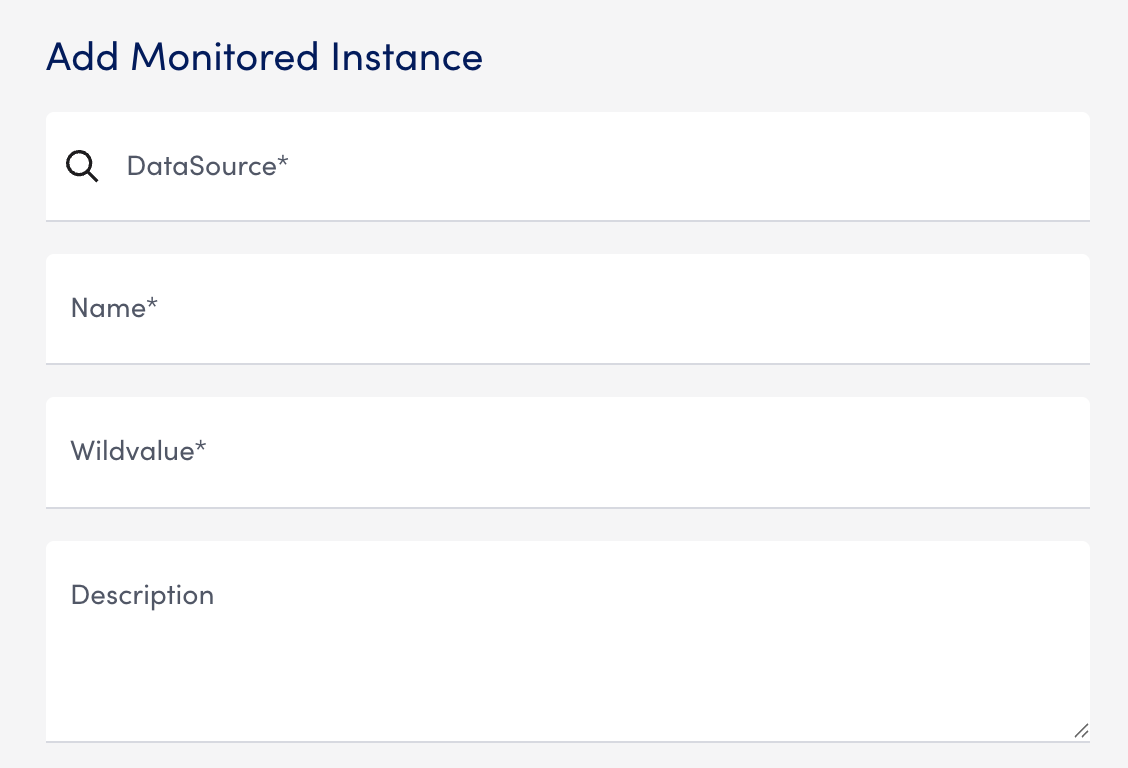
- In the DataSource field, enter “Cost by Tag” and select a suitable value.
Important: LogicMonitor discovers the user-defined tags from the Cost and Usage Report.
- In the Instance Group section, select one of the following:
- Add to existing instance group — Enter the instance group name in the Instance Group field.
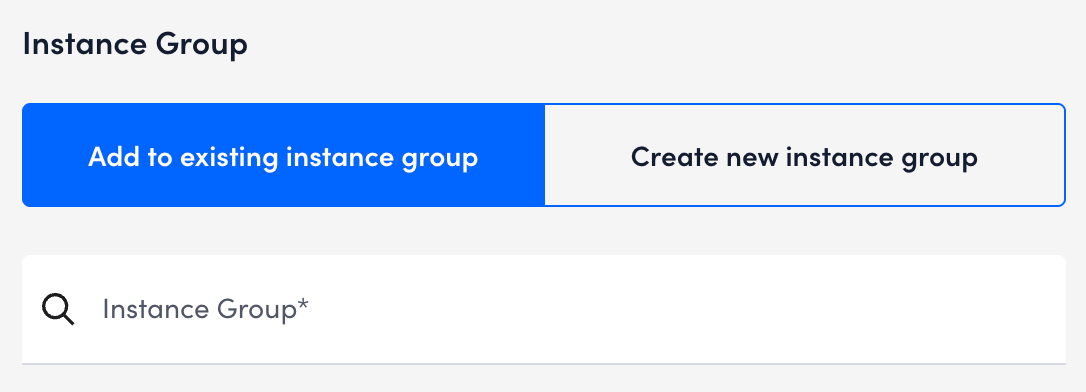
- Create new instance group— Enter an Instance group name and description for the new group.
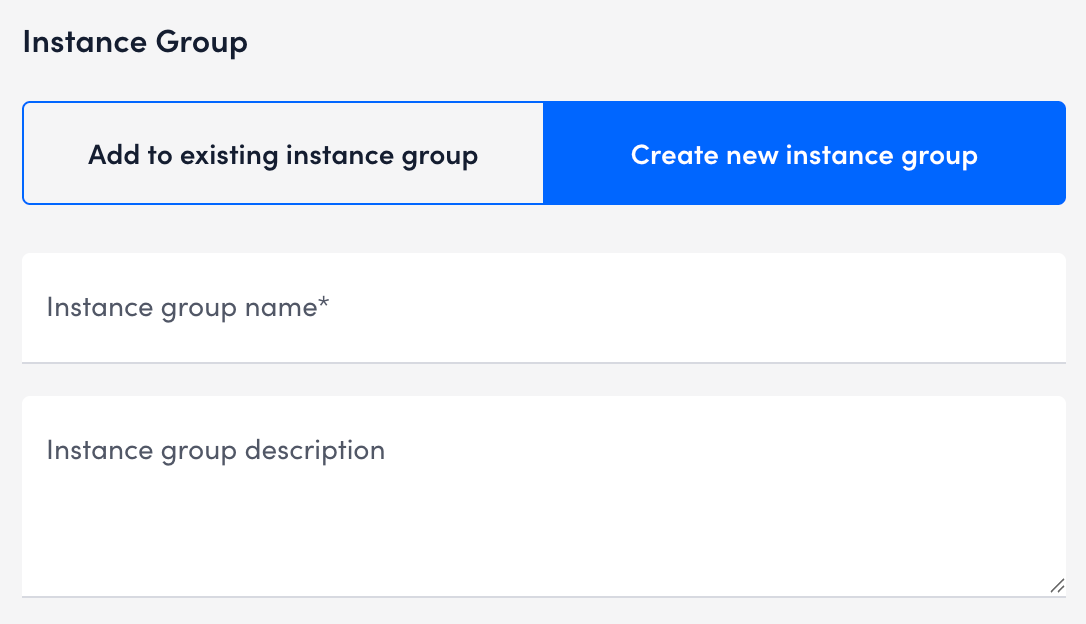
- Add to existing instance group — Enter the instance group name in the Instance Group field.
- Select Save.
Depending on the selection, the instance is added to the existing or a new instance group under the instance is now added under the Cost by Tag DataSource in the Resource Tree. Repeat these steps to add more instances as needed.