
LLM Observability in One Platform
Keep your large language models fast, cost-efficient, and reliable with complete visibility into what’s driving their behavior.


Keep your large language models fast, cost-efficient, and reliable with complete visibility into what’s driving their behavior.


LLM Observability Platform
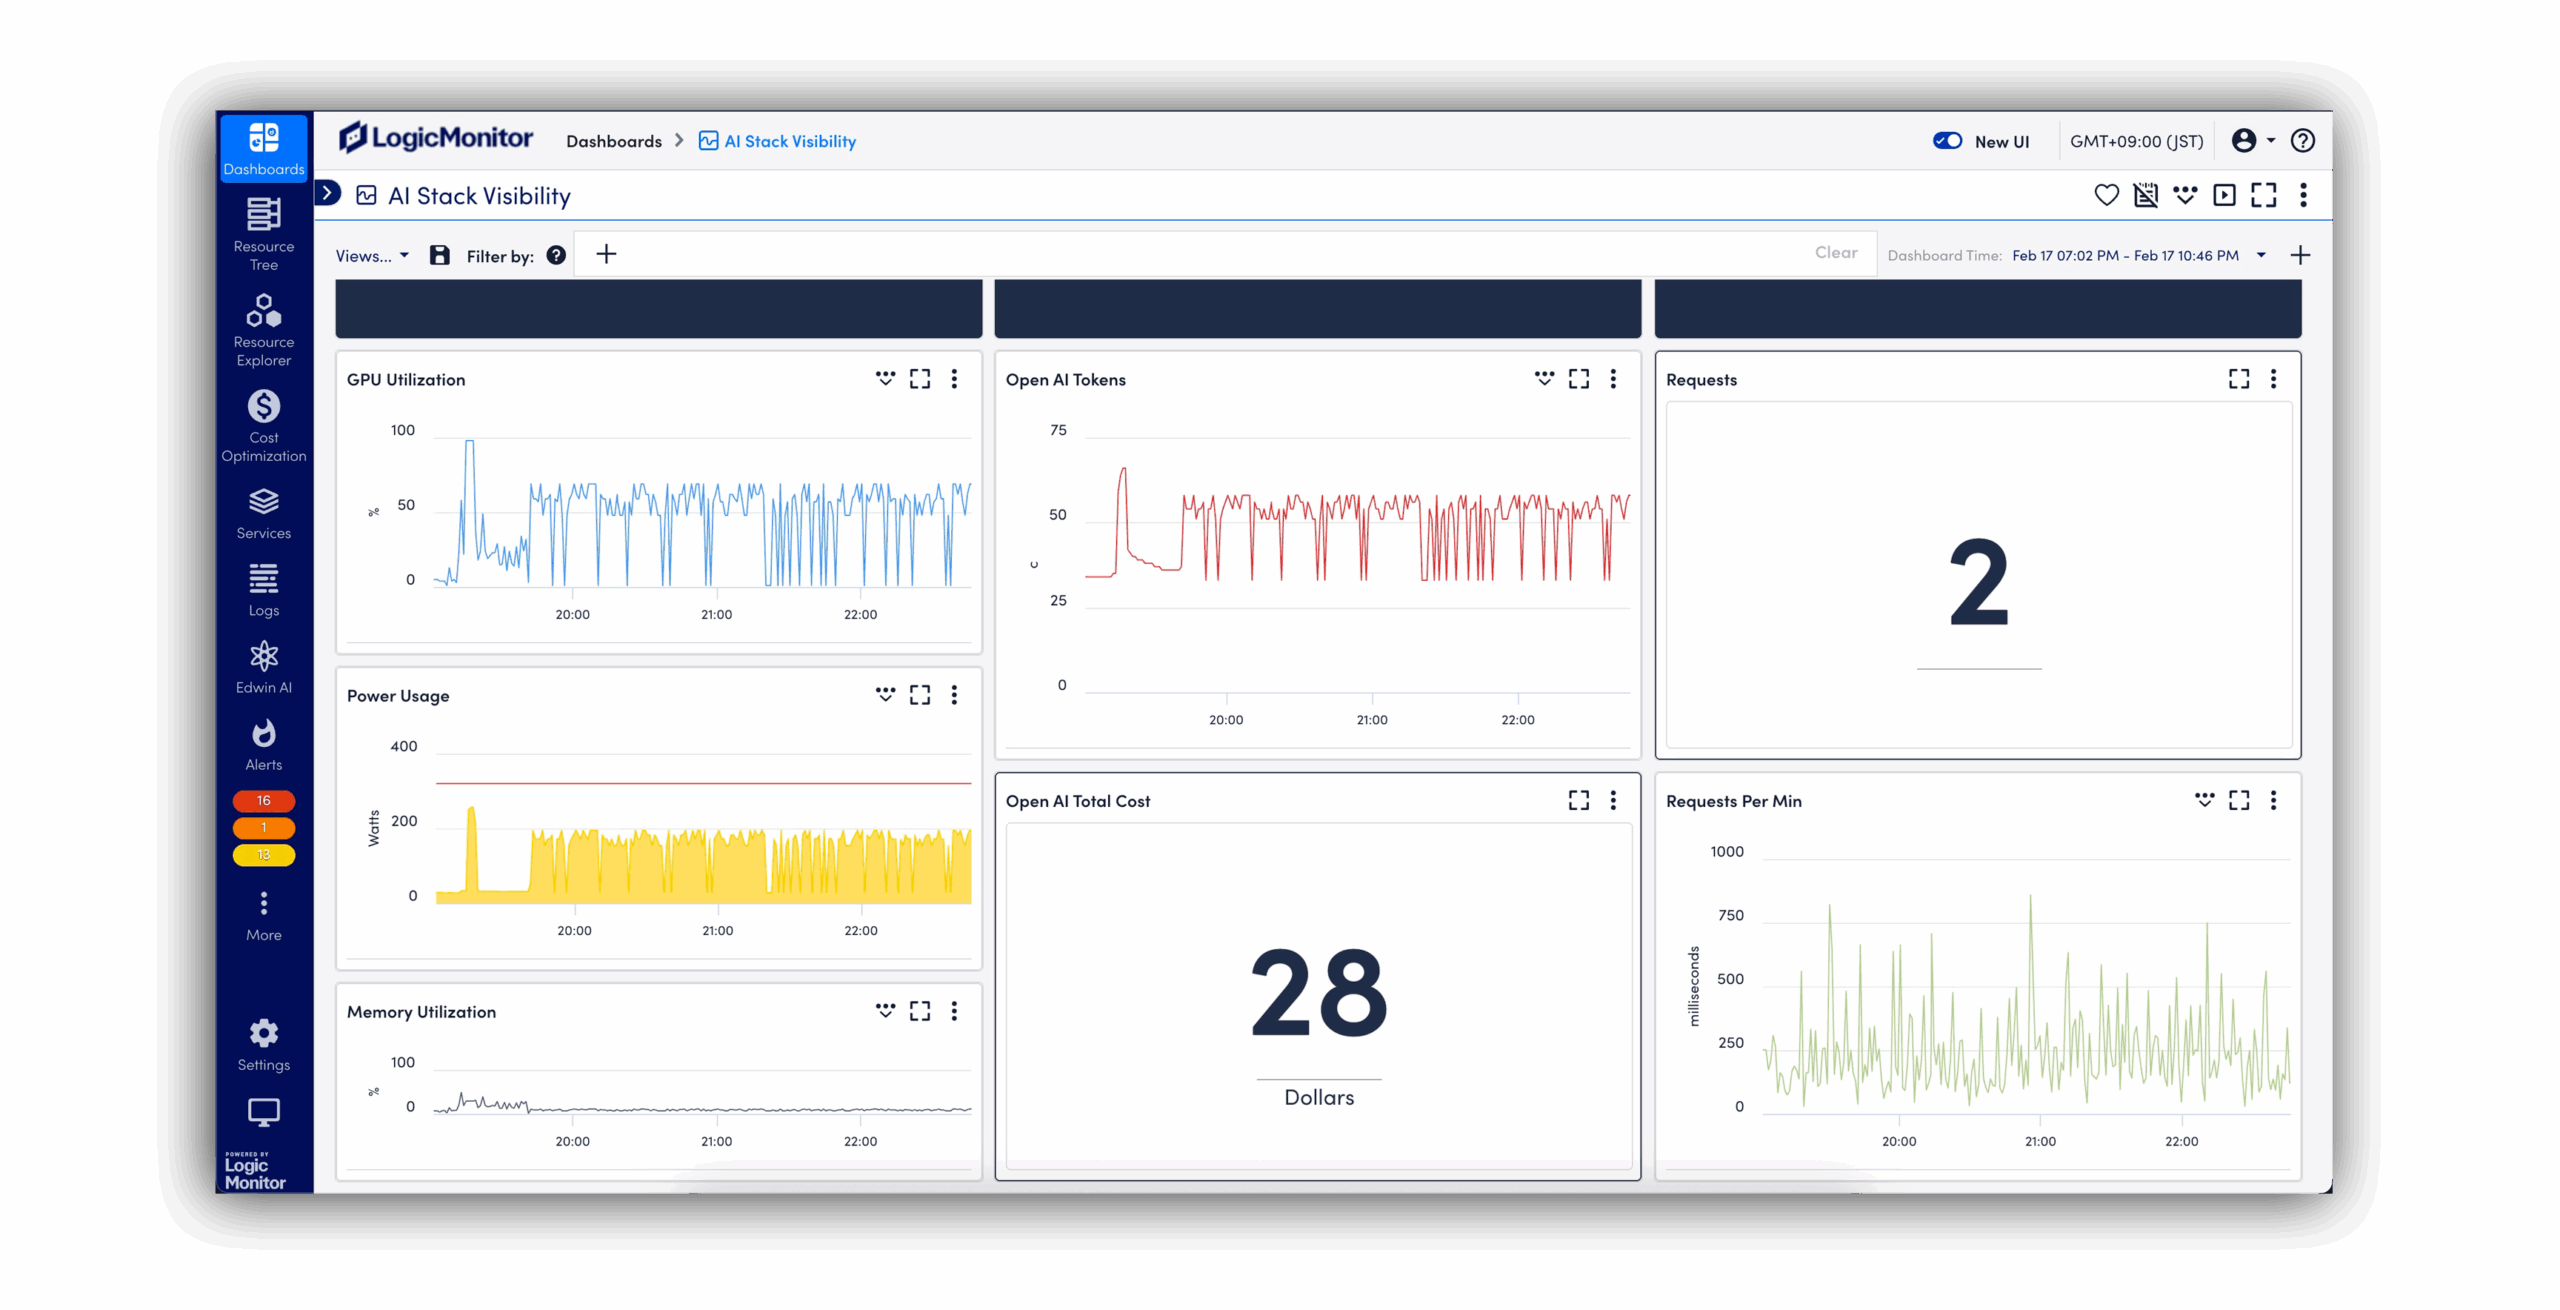
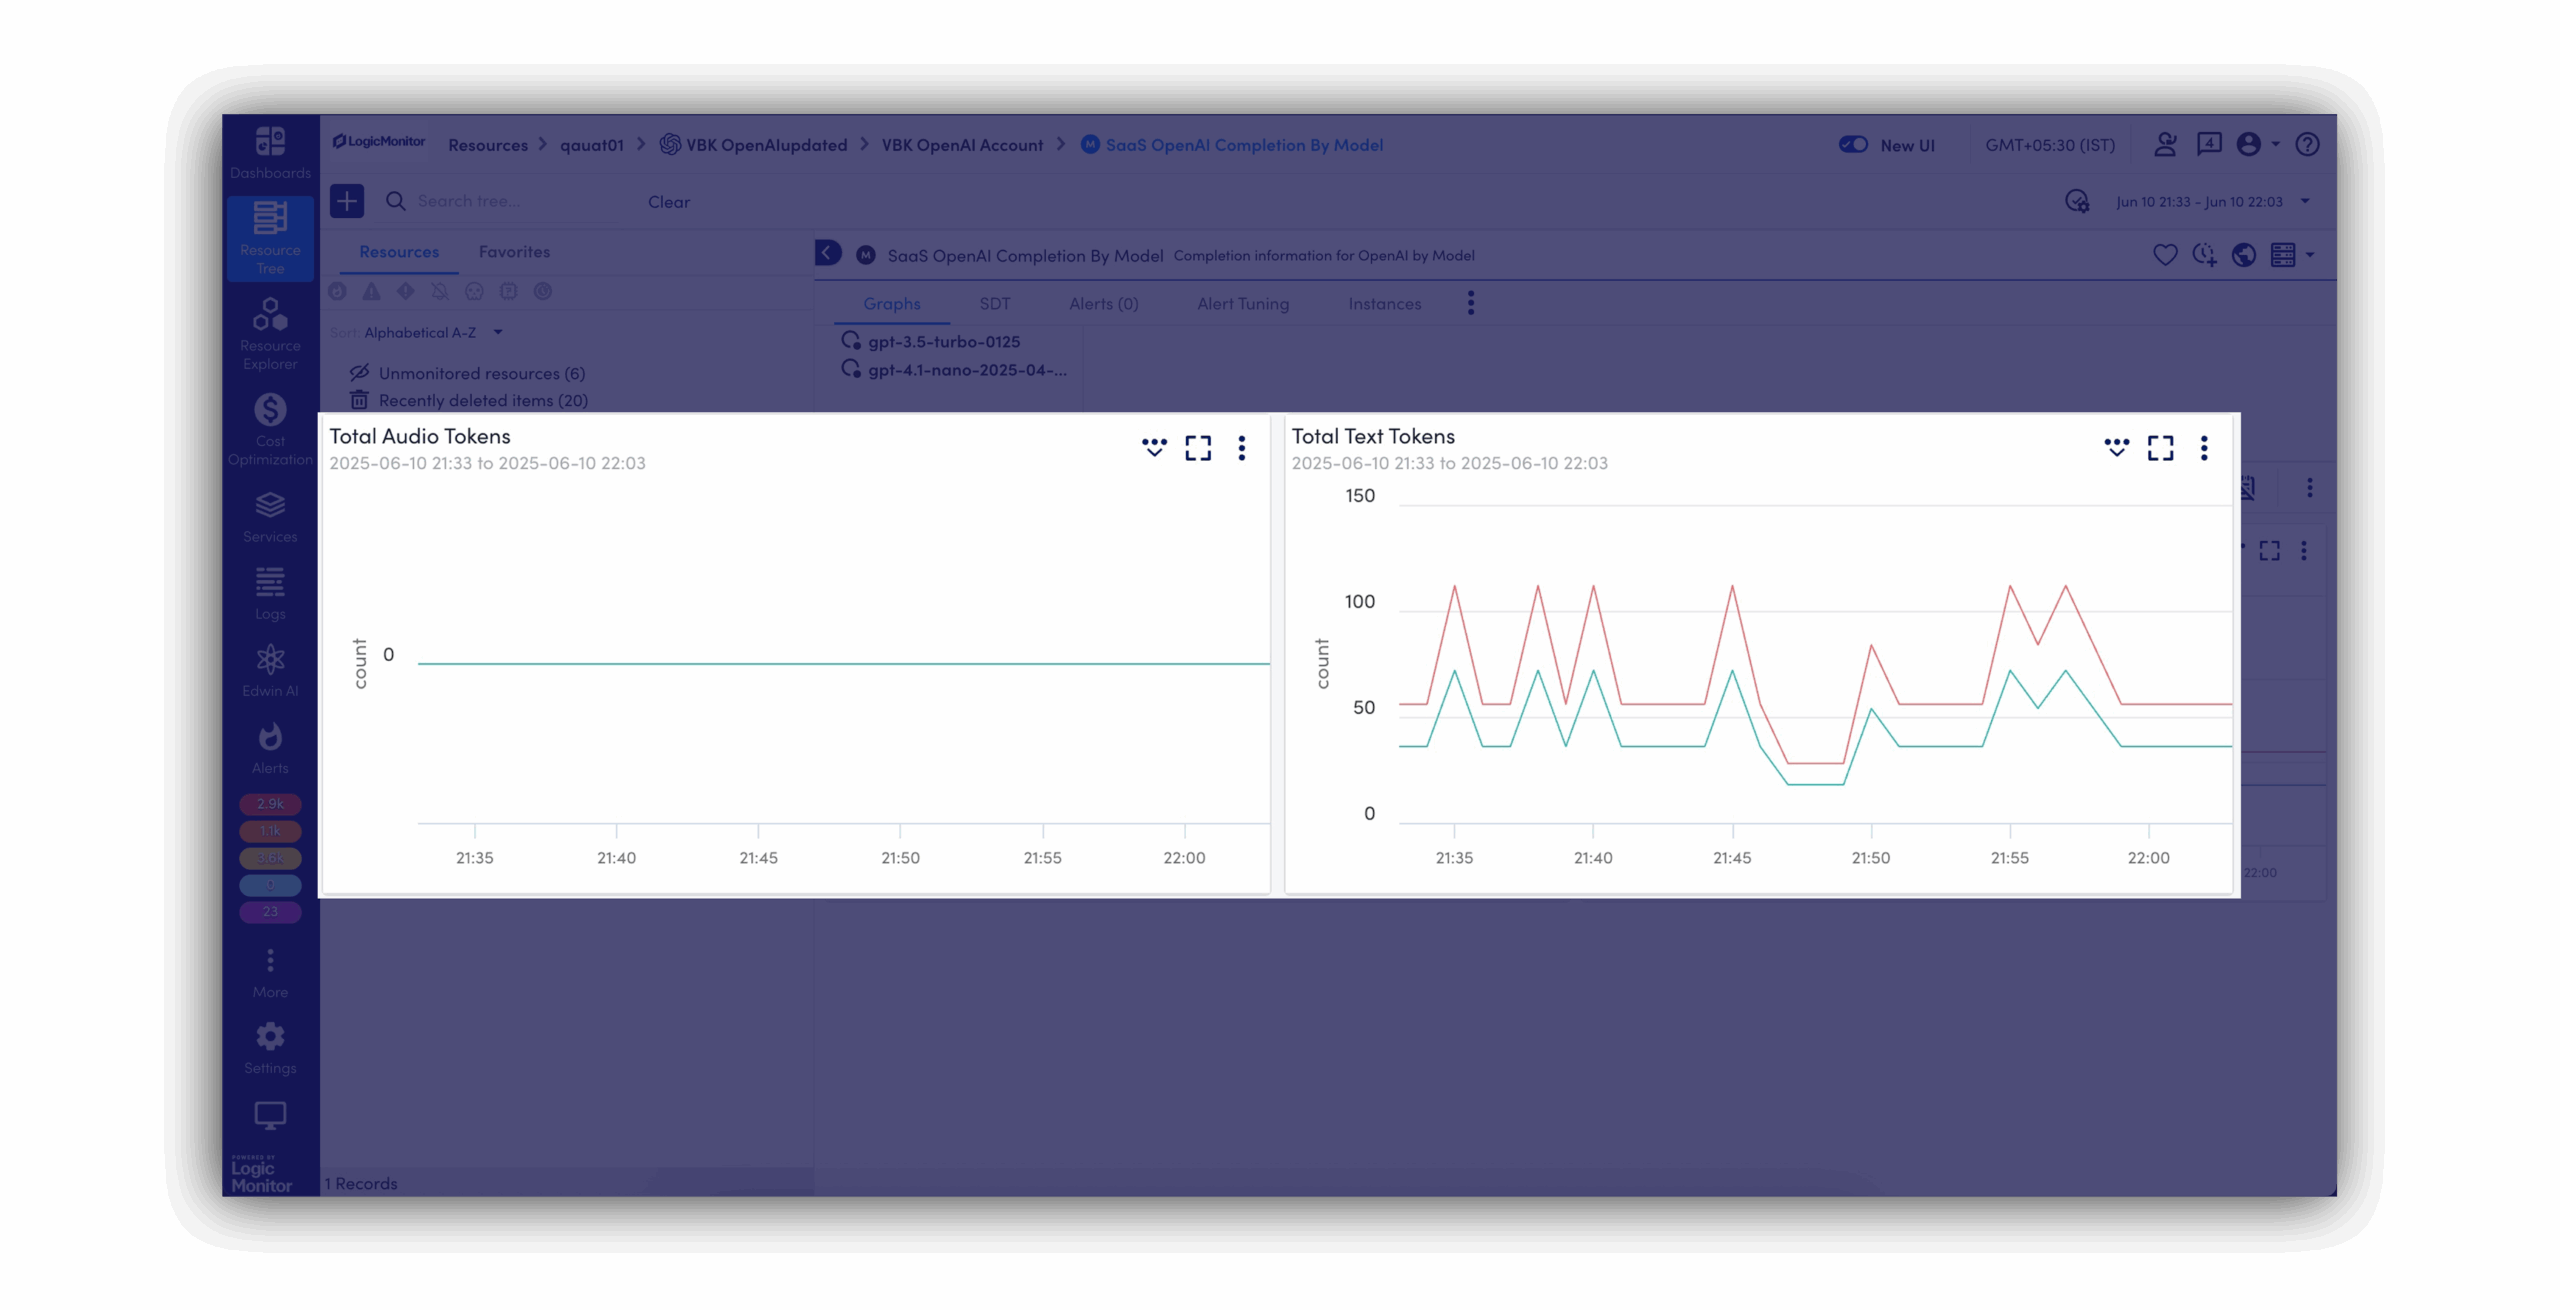
LogicMonitor Envision gives you real-time visibility into LLM performance, token usage, and failure points, so you can resolve issues faster, optimize performance, and deliver more reliable AI experiences.
BY THE NUMBERS
Avoid latency spikes, broken responses, or bot outages by spotting anomalies early and acting fast before customers notice anything’s wrong.
Whether you’re powering customer service chatbots or internal tools, you’ll deliver faster, smarter responses by keeping your LLMs healthy and performant.
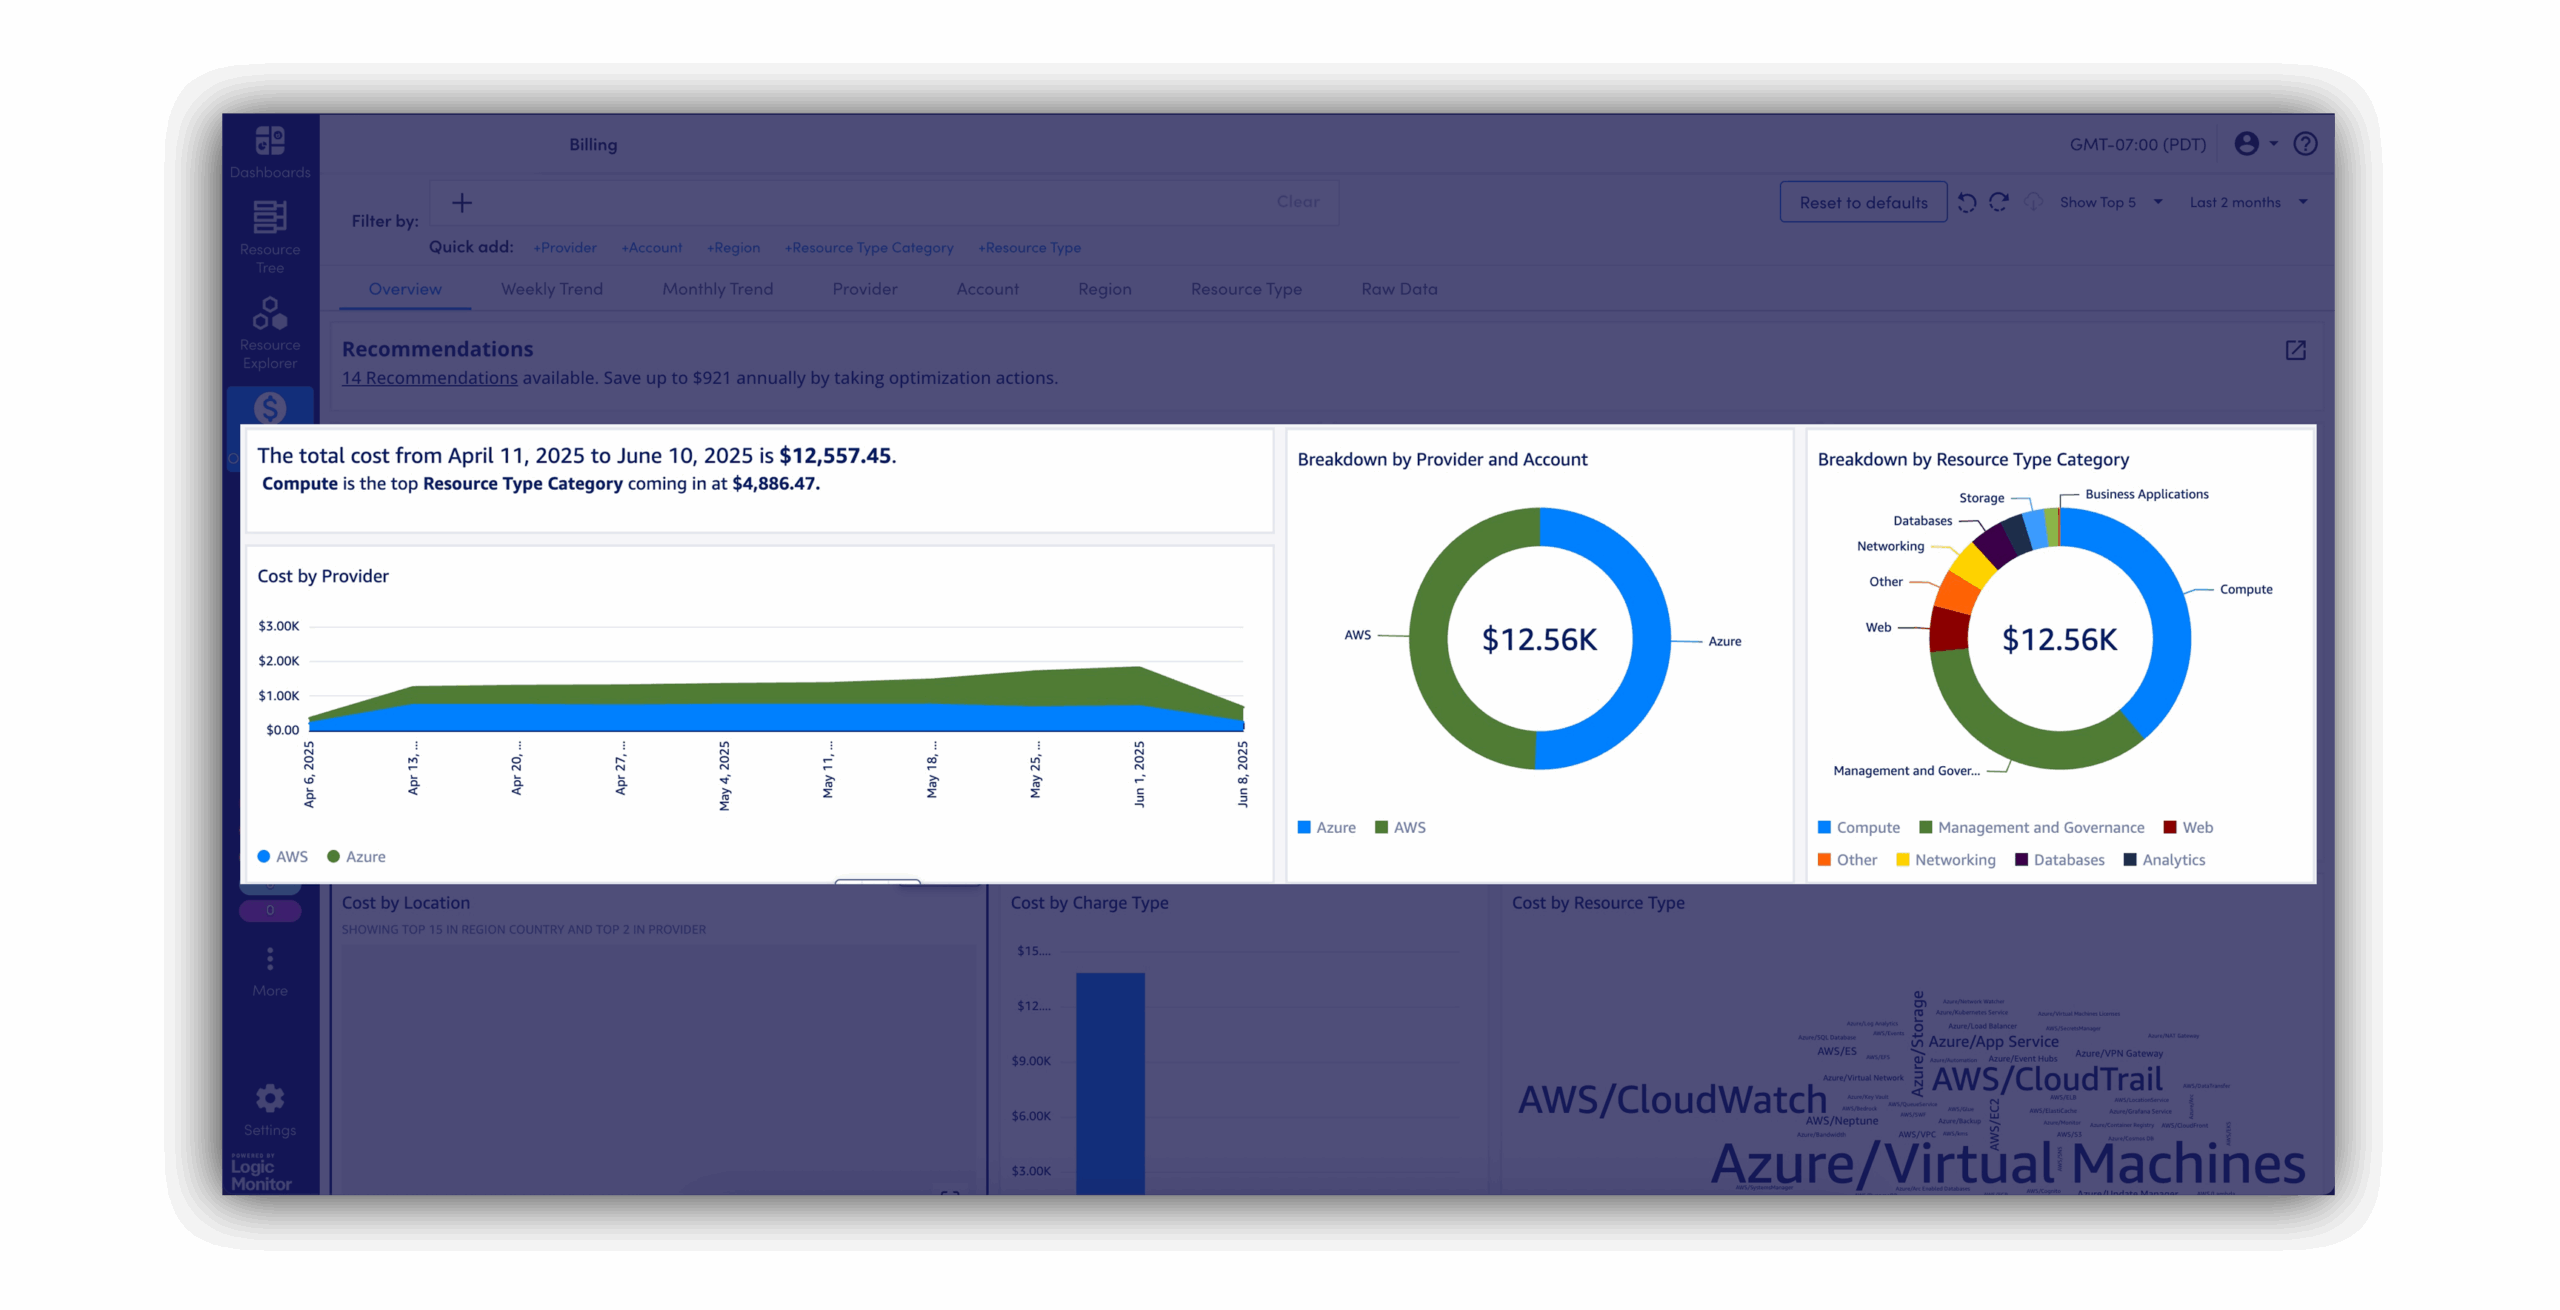
Stay on budget as usage grows. With visibility into token spend and API inefficiencies, you can cut waste without sacrificing quality or scale.
As your AI footprint expands, you won’t need new tools or teams to manage it. LM Envision grows with you, automatically monitoring new endpoints and services as they come online.
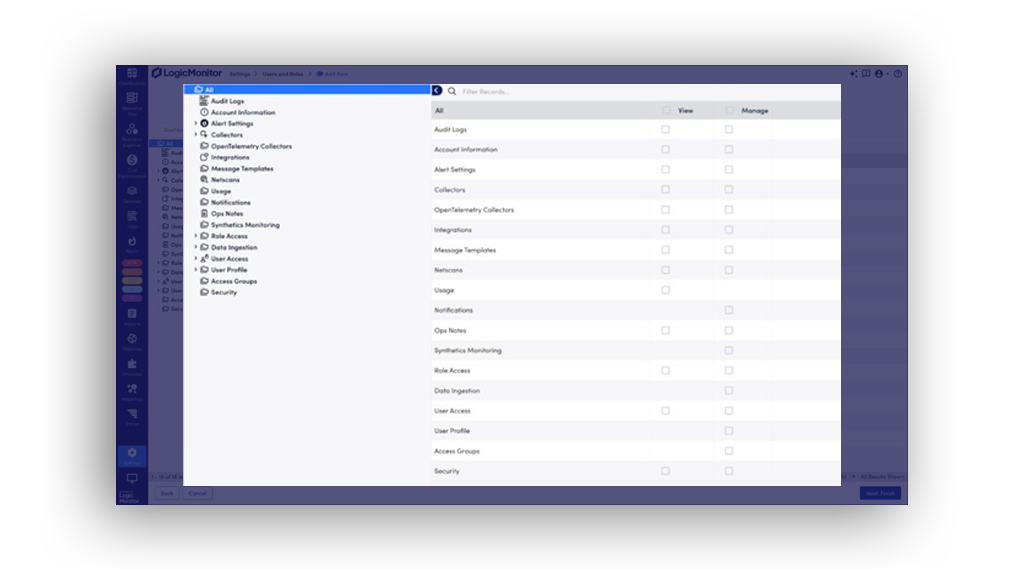
Avoid unintentional exposure, data misuse, or shadow AI. With visibility into access patterns and workload behavior, you can enforce responsible use and stay compliant.
Transform usage trends, spend reports, and model performance into clear, real-time dashboards that drive informed decisions across teams.
MAKE YOUR LLM OBSERVABILITY SMARTER
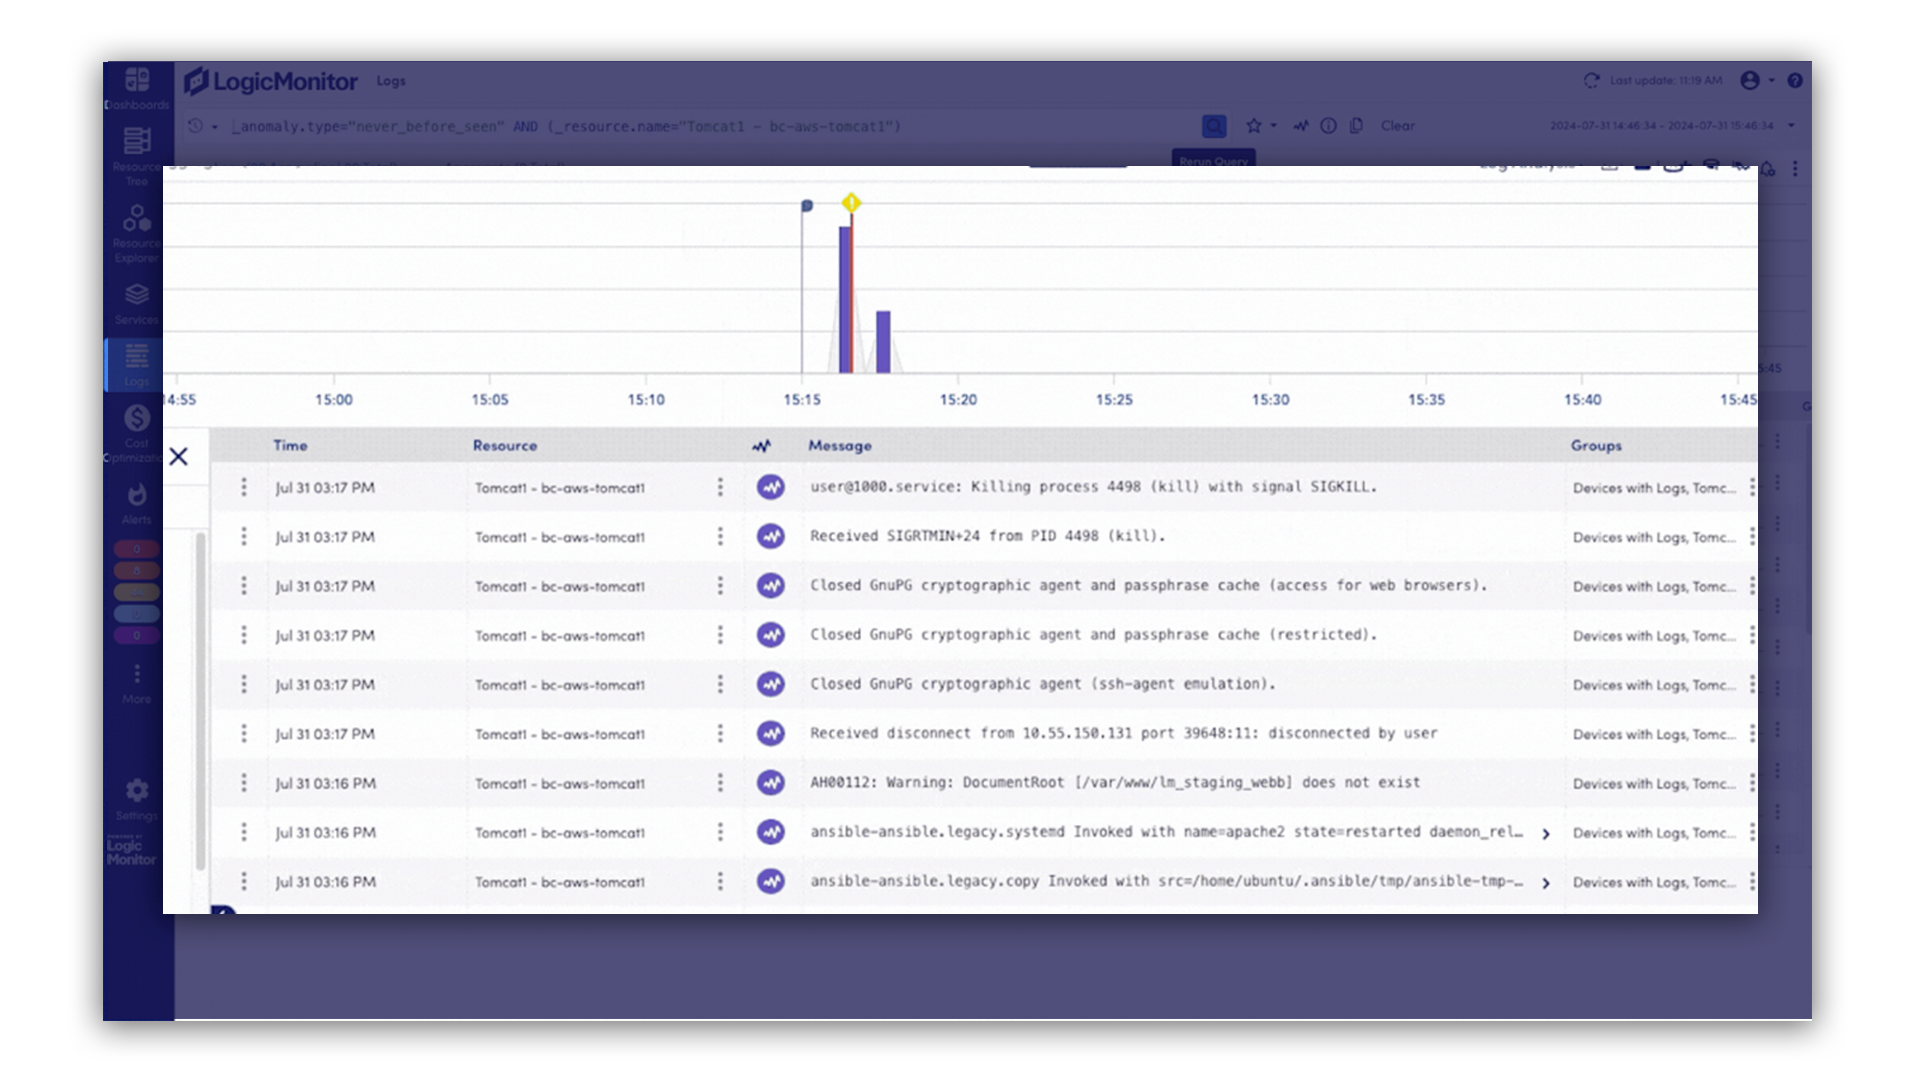
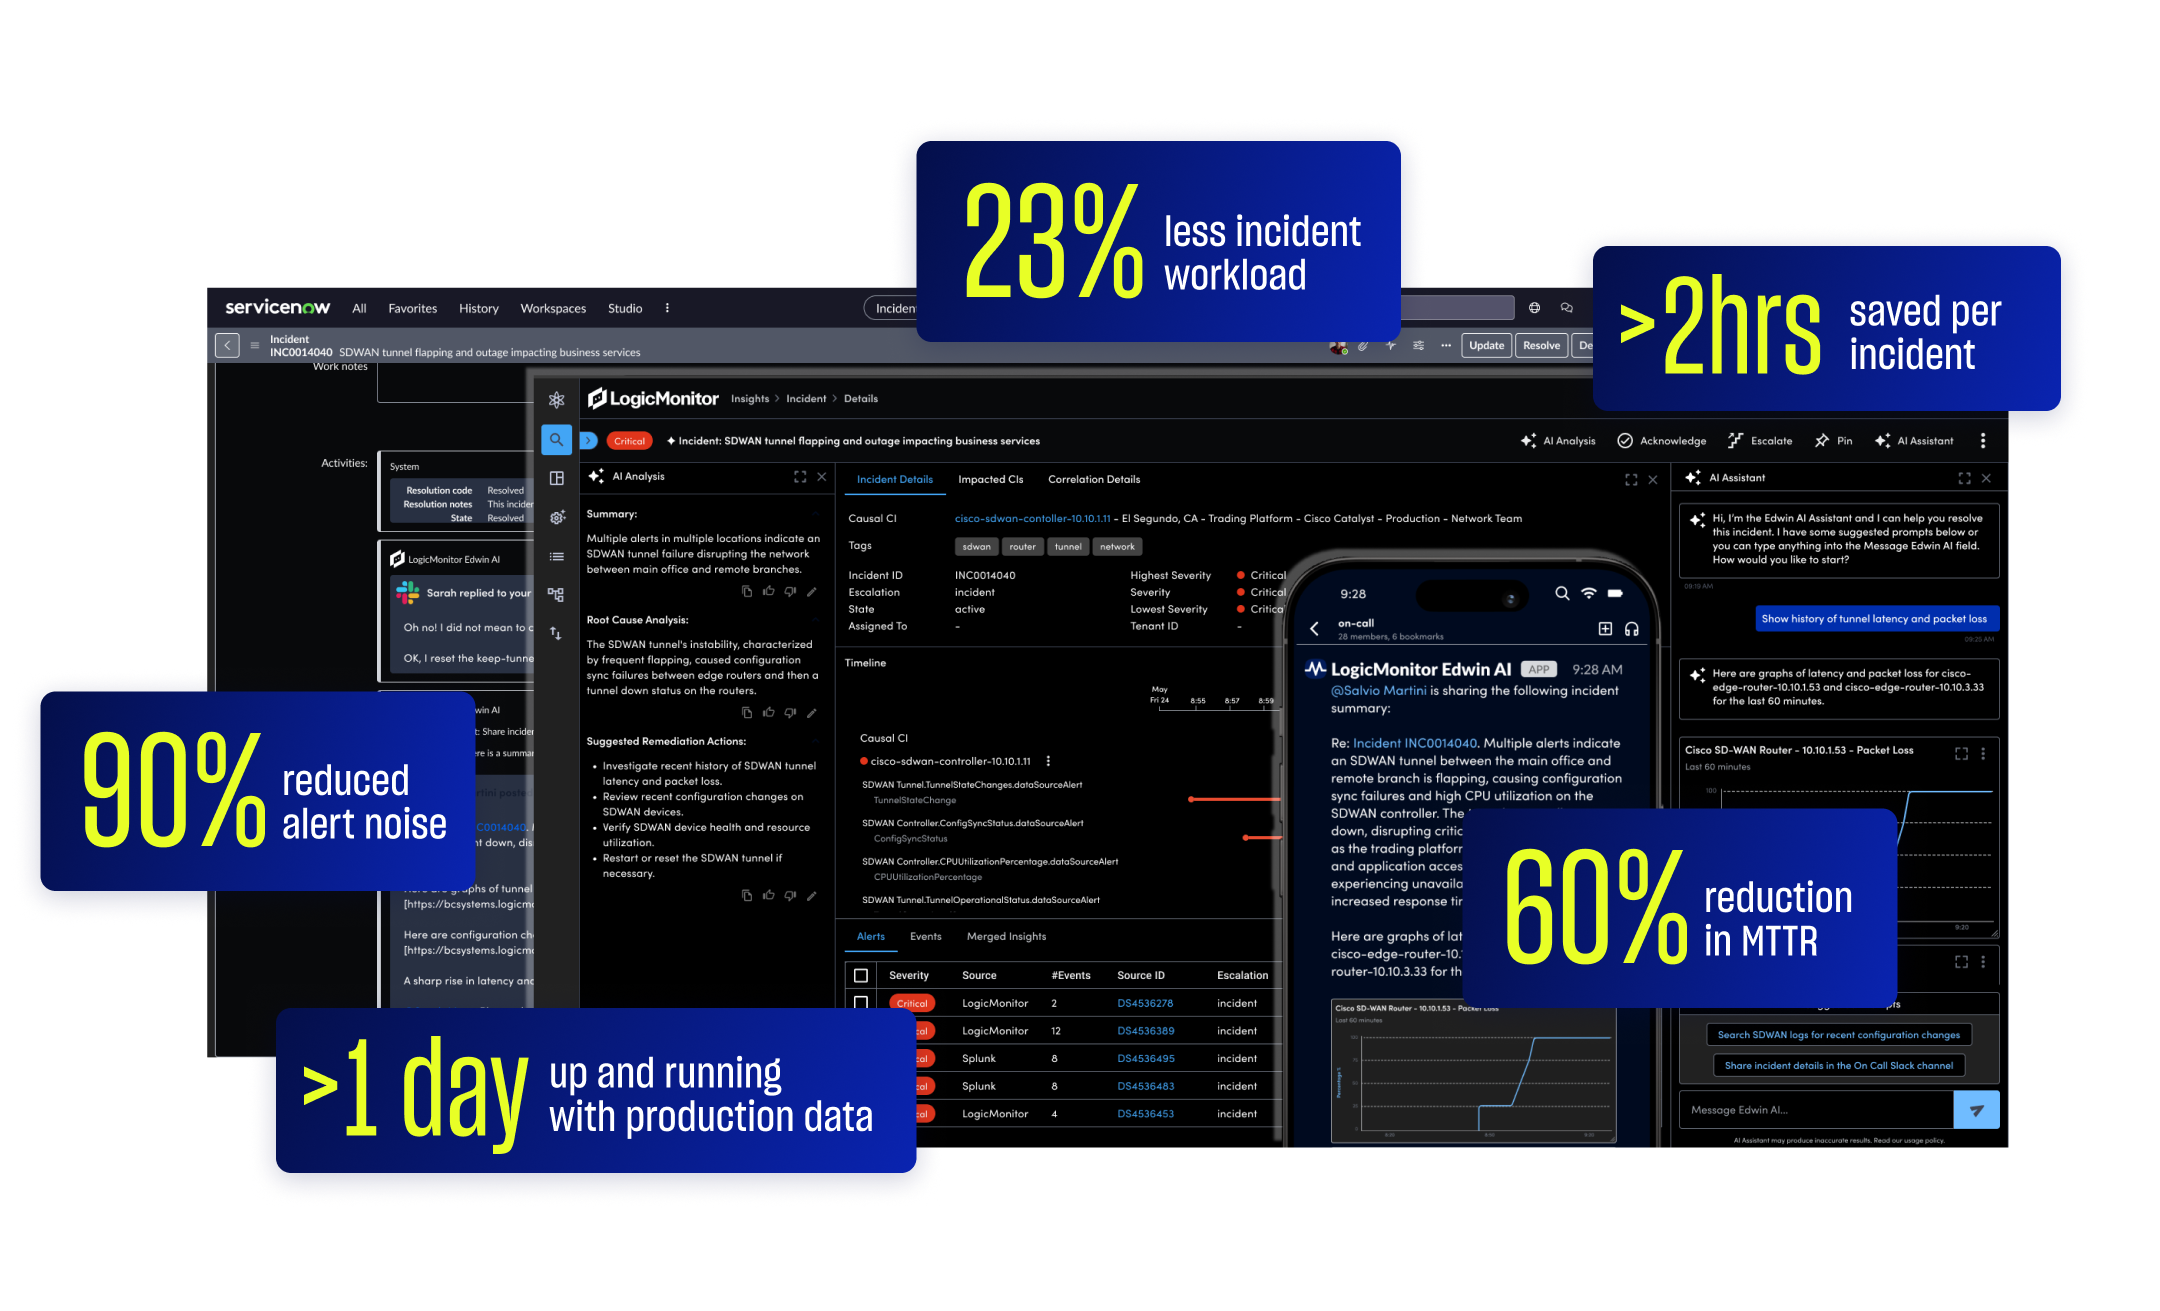
Edwin AI helps you catch issues early, cut through noise, and resolve incidents fast. With built-in generative AI, it auto-correlates alerts, surfaces root cause, and gives step-by-step guidance to fix problems before customers ever notice.
Everything you need to monitor, manage, and optimize AI
We couldn’t see the whole picture. Since deploying LogicMonitor, we have one tool and one location where we can see across all our infrastructure. The time savings are huge. I can’t even calculate them, but I would say hundreds of hours.
Leverage LM Envision’s 3,000+ existing integrations (servers, networks, storage, APM, CMDB) to feed infrastructure and application telemetry alongside AI data. Explore integrations
Push enriched incident details—complete with GPU, LLM, and database context—to ServiceNow, Jira, and Zendesk; maintain two-way sync for status updates.
Turn on plugins for OpenAI, AWS Bedrock, Azure OpenAI, GCP Vertex AI, Pinecone, ChromaDB, NVIDIA DCGM, and OpenLIT—each connector ingests the required metrics automatically.
See how LogicMonitor helps you monitor your AI systems in one place. Your team can move faster with fewer surprises.
GET ANSWERS
Get the answers to the top network monitoring questions.
LLM observability gives you visibility into how large language models behave in production, across API calls, token usage, latency, vector database queries, and the supporting infrastructure. It helps teams detect issues early, reduce time to resolution, and manage usage and cost with precision.
Traditional AI observability focuses on models, pipelines, and infrastructure. LLM observability goes deeper into prompt-to-response behavior, token consumption, and drift. It’s built for teams running generative AI apps in production, not just training ML models.
Yes. LM Envision integrates with OpenAI, Azure OpenAI, AWS Bedrock, and Vertex AI to monitor metrics like token usage, request latency, error rates, and API cost. Claude is on the roadmap for future development.
Edwin AI applies intelligent correlation across your LLM stack—connecting token anomalies, API performance, and infrastructure signals. It helps surface likely root causes and provides next steps, cutting down on manual triage.
You can monitor:
Yes. You can segment LLM API usage by team, app, or environment to stay ahead of billing spikes and optimize usage patterns.
LLM observability is built into the same LM Envision platform you use for infrastructure, cloud, apps, and networks—no need to spin up a new tool or context-switch.
