If Artificial Intelligence is the ultimate multi-tool for IT operations (as discussed in our first article), then DevOps, Network Ops, Site Reliability Engineers (SREs), and SecOps are the teams using it. How each team uses AIOps’ capabilities will improve interconnectivity across an organization’s digital landscape, accelerate the production of high-priority business objectives, and reduce downtime to pave the way for a smoother developer and user experience.
Understanding the teams driving IT operations success
Before we map capabilities to teams, let’s establish some broad team definitions as they may currently exist within IT operations:
- DevOps: Ensure smooth collaboration between development and operations.
Priorities include automation, issue detection, and optimizing workflows to speed up software development and delivery.
- IT operations: Manage and maintain the organization’s IT infrastructure.
Priorities include improving operational efficiency, reducing downtime, and improving system reliability.
- Network operations: Manage and maintain the operation’s network infrastructure.
Priorities include identifying bottlenecks and predicting potential network issues.
- SRE: As an operational group, SREs own the back-end infrastructure responsible for the customer experience and consult with developer teams to ensure the infrastructure can support applications.
Priorities include avoiding downtime among revenue-critical systems, preventing bandwidth outages, and fixing configuration errors.
- Security operations: Protects the organization’s systems and data from security threats.
Priorities include security log analysis and response, as well as identifying anomalies or vulnerabilities.
Establishing a strong foundation: Key AIOps capabilities by team
AIOps uses artificial intelligence, machine learning, and consolidated operational platforms to automate repetitive or mundane tasks and streamline cross-team communications. An AIOps deployment is the scaffolding IT operations use to build evolving workflows so the teams can be more proactive, innovative, and able to accelerate the delivery of high-priority projects. That’s why we are seeing more AIOps success stories about how AIOps can liberate 40% of your engineering time through the automation of labor-intensive analysis or how Managed Service Providers (MSPs) are implementing AIOps’ intelligent alerting capabilities to dramatically reduce downtime.
So let’s dig into which three AIOps capabilities each team may leverage first:
DevOps
- Enhanced efficiency: Automating repetitive and manual tasks frees up time to focus on higher-value initiatives, increasing efficiency and productivity across the entire team.
- Faster mean time to resolution (MTTR): Streamlining incident management processes ensures faster issue identification, analysis, “next steps,” cross-team communications, and, ultimately, issue resolution. With automation doing the heavy lifting, these steps can happen outside of work hours. This 24/7 approach reduces the time to resolution, minimizing any impact on operations.
- Scalability and adaptability: AI and machine learning’s self-learning properties are made to handle complex and rapidly evolving technology stacks in dynamic environments.
Watch the 3-minute video below for more on how DevOps can use AIOps for faster issue resolution through integration with open-source provisioning and configuration management tools.
IT Operations
- Incident management: AIOps streamline incident identification and root cause analysis and escalate incidents to the right teams and people who can pinpoint the source of an issue and quickly fix it. Post-incident reviews are used to build resilience in systems to prevent future occurrences of similar incidents. Faster resolution reduces MTTR and operational impact.
- Scalability and adaptability: IT infrastructure has to adapt to business needs. AIOps systems handle the complexity of evolving modern stacks and dynamic environments, including hybrid and multi-cloud architectures. Faster scaling sets ITOps up for success in that they can effectively manage and monitor expanding IT landscapes at any stage of growth.
- Resource and cost optimization: Capacity planning and the automation of tasks lets ITOps teams allocate resources more efficiently, freeing up budget and personnel for new endeavors or headcount strategies.
Network Ops
- Streamlined troubleshooting: Automated root cause analysis capabilities quickly pinpoint the root causes of network issues, accelerating troubleshooting and improving uptime.
- Capacity planning: Historical and real-time data analysis on network use patterns, forecasted future demands, and resource allocation enables the team to reassign assets as needed to prevent network congestion and keep operations consistent while supporting business growth.
- Network security enhancement: Leveraging AI-driven algorithms that analyze network traffic, detect anomalies, and identify potential security threats enables Network Ops teams to take proactive measures ahead of a breach.
SRE
- Elasticity: As SRE teams manage complex and dynamic environments, including cloud-based systems and microservices architectures, AIOps provides the ability to scale and adapt to changing demands. AIOps ensures the SRE team can effectively monitor, manage, and optimize the system’s performance as it grows and evolves.
- Continuous optimization: AIOps analyzes data from various sources, including logs, metrics, and events, then identifies optimization opportunities that SRE teams can enact. Leveraging AI insights to make data-driven decisions, implement proactive measures, and continuously refine their infrastructure to achieve greater reliability.
- Collaboration and knowledge sharing: By providing a centralized platform for data collection, analysis, and visualization, AIOps facilitates communication and sharing of information so associated teams (such as developers) can align their efforts towards common goals, leading to improved teamwork and faster problem-solving.
SecOps
- Advanced threat detection: AIOps enhances threat detection capabilities by analyzing vast amounts of security-related data from various sources, such as logs, network traffic, and user behavior. AI-driven algorithms can identify patterns, anomalies, and potential security threats in real time, enabling SecOps teams to respond promptly to security incidents, minimizing damage caused by cyber threats.
- Threat intelligence integration: AIOps integrates with threat intelligence feeds and external security sources to enhance the effectiveness of security operations. By leveraging external threat intelligence data, AIOps enriches its analysis and detection capabilities, allowing SecOps teams to stay updated on the latest threats and attack vectors. This integration strengthens the overall security posture and enables proactive defense against emerging threats.
- Compliance and regulatory requirements: AIOps automate compliance monitoring and reporting processes and then compare them against predefined standards and regulations to evolve the automation and compliance process so teams consistently meet compliance and regulatory requirements.
Integrating AIOps for teams with existing tools
Seamless integration for unified operations
One of the standout advantages of AIOps is its ability to integrate with existing IT tools, providing a unified platform for monitoring, automation, and insights. Whether you’re leveraging monitoring tools like LogicMonitor, managing hybrid or multi-cloud environments, or maintaining CI/CD pipelines, AIOps can enhance and extend their functionality rather than replace them.
Compatibility with monitoring tools
AIOps platforms, such as LogicMonitor, act as a central hub, aggregating data from multiple monitoring tools to provide a unified view of IT operations. For example, integrating LogicMonitor with AIOps capabilities allows teams to consolidate alerts, correlate events, and automate responses—all from a single dashboard. This integration reduces manual intervention and provides actionable insights in real-time.
Enhancing cloud platforms
AIOps is designed to operate seamlessly in hybrid and multi-cloud environments. By analyzing data from cloud-native tools, AIOps systems provide predictive analytics, helping IT teams optimize workloads, prevent resource exhaustion, and identify anomalies before they escalate into problems.
Streamlining CI/CD pipelines
For DevOps teams, AIOps tools integrate with CI/CD platforms to enable continuous monitoring and intelligent automation throughout the development lifecycle. This ensures faster feedback loops, reduces downtime caused by deployment errors, and optimizes application performance.
Addressing legacy system concerns
One common concern when adopting AIOps is its compatibility with legacy systems. AIOps platforms are built with integration in mind, offering APIs and connectors that bridge the gap between older systems and modern tools. By applying machine learning to data generated by legacy tools, AIOps can derive valuable insights while extending the life of existing systems.
Laying the groundwork for success
To fully unlock the transformative potential of AIOps, organizations need to establish a strong foundation. These best practices ensure that teams can effectively leverage AIOps capabilities while minimizing disruptions and maximizing impact.
1. Prioritize data quality and accessibility
AIOps thrives on accurate and comprehensive data. Ensure all data sources—whether from legacy systems, monitoring tools, or cloud platforms—are clean, consistent, and consolidated. By breaking down data silos and standardizing formats, teams can enable AIOps to deliver actionable insights with precision.
2. Foster cross-team collaboration
AIOps works best when IT teams such as DevOps, Network Ops, and SREs collaborate seamlessly. Establish shared goals and encourage open communication to align team efforts. Unified dashboards, like those offered by LogicMonitor, help bridge gaps and provide everyone with a clear view of the operational landscape.
3. Start with targeted use cases
Rather than implementing AIOps broadly, begin with specific high-impact applications. Use cases such as automated incident management or anomaly detection are excellent starting points for demonstrating value and gaining stakeholder buy-in.
4. Balance automation with human oversight
While AIOps excels at automating repetitive tasks, human judgment remains critical for nuanced decision-making. Pair automated workflows with manual checks for complex scenarios to ensure both speed and accuracy in IT operations.
5. Commit to continuous improvement
AIOps systems evolve over time. Regularly monitor performance metrics, gather team feedback, and refine algorithms to adapt to changing environments. This iterative approach ensures long-term success and sustained benefits.
AIOps Use Cases
Here are some of the key use cases of AIOps in IT operations:
1. Identifying problems based on anomalies or deviations from normal behavior
AIOps enhances IT systems by using machine learning to detect anomalies and potential issues, unlike traditional tools that rely on manual configuration and threshold alerts. It analyzes data in real-time, flags deviations from normal behavior, and allows IT teams to address problems before they escalate.
2. Forecasting the value of a certain metric to prevent outages or downtime
AIOps forecasts crucial metrics like server capacity and network bandwidth, alerting IT teams before they reach critical levels. This proactive approach helps prevent outages and disruptions. By using machine learning algorithms, AIOps monitors data trends to predict threshold breaches, enabling preemptive actions to mitigate issues.
3. Improving incident response and resolution times
AIOps substantially improves incident response and resolution times by automatically correlating events from various sources and providing intelligent insights for root cause analysis. Machine learning algorithms effectively process large volumes of data from logs, alerts, and metrics to identify the root cause of incidents. This methodology not only expedites incident response but also reduces the mean time to resolution (MTTR), thereby minimizing the impact on business operations.
4. Enhancing IT operations through automation
AIOps presents substantial benefits by automating routine tasks and processes within IT operations, allowing IT teams to focus on higher-value activities such as strategic planning and problem-solving. This automation ranges from fundamental tasks like ticket routing and categorization to more complex processes such as incident remediation based on predefined rules. Consequently, it enhances efficiency, reduces the risk of human error, and streamlines workflows.
Take your IT operations to the next level
AIOps give teams the tools they need to transform from reactive to proactive. The combination of artificial intelligence and machine learning accelerates issue mitigation, breaks through work silos, improves systems security and scalability, increases productivity, reduces error risk and optimizes resources and costs. Having an AI-empowered IT operation means an organization’s infrastructure is instantly ready to handle roadblocks for a smoother developer and user experience.
LogicMonitor’s AIOps platform empowers businesses to transition from reactive troubleshooting to proactive, intelligent operations. With AI and machine learning capabilities, LogicMonitor provides meaningful alerts, illuminates patterns, and enables foresight and automation. Spend less time resolving issues and more time driving innovation.
LogicMonitor is proud to power the journey to AIOps by offering these free educational resources:
What is AIOps and How is it Changing IT Operations?
Simplify Troubleshooting with AIOps
Monitoring and Alerting Best Practices Guide
Sensirion Goes from 8 Monitoring Tools to Just One
Comprehensive AIOps for monitoring
Unlocking the Path to Automation with LogicMonitor
Managing observability across hybrid and multi-cloud environments is like flying a fleet of planes, each with different routes, altitudes, and destinations. You’re not just piloting a single aircraft; you’re coordinating across multiple clouds, on-premises systems, and services while ensuring performance, availability, and cost-efficiency. AWS customers, in particular, face challenges with workloads spanning multiple regions, data centers, and cloud providers. Having a unified observability platform that provides visibility across every layer is critical.
This is where LogicMonitor Envision excels. Its ability to seamlessly integrate observability across AWS, Azure, Google Cloud, and on-premises systems gives customers a comprehensive view of real-time performance metrics and logs, such as EC2 CPU utilization or Amazon RDS database logs. Additionally, LM Envision delivers visibility before, during, and after cloud migrations—whether you’re rehosting or replatforming workloads.
Let’s dive into how LogicMonitor makes managing these complex environments easier, focusing on features like Active Discovery, unified dashboards, and Cost Optimization.
The challenge of hybrid and multi-cloud: Coordinating your fleet across complex skies
Hybrid and multi-cloud environments are like managing multiple aircraft, each with its own systems and control panels. AWS workloads, on-prem servers, and Azure or Google Cloud applications have their own monitoring tools and APIs, creating silos that limit visibility. Without a unified observability platform, you’re flying blind, constantly reacting to issues rather than proactively managing your fleet.
Working at LogicMonitor, I’ve seen many customers struggle to manage hybrid environments. One customer managed 10,000 assets across multiple regions and cloud providers, using separate monitoring tools for AWS, on-prem, and their private cloud. They described it as “trying to control each plane separately without an overall view of the airspace.” (The analogy that inspired this blog!) This led to constant reactive management. By switching to LM Envision, they eliminated blind spots and gained complete visibility across their entire infrastructure, shifting to proactive management—the dream for ITOps teams everywhere.
Active Discovery: The radar system for automatically detecting new resources
Think of your infrastructure as an expanding airport. New terminals (services), planes (instances), and runways (connections) are constantly being added or modified. Manually tracking these changes is like trying to direct planes without radar. LM Envision simplifies this by automatically discovering AWS resources, on-prem data center infrastructure, and other cloud providers like Azure and Google Cloud. This visibility provides a comprehensive real-time view across services like Amazon EC2, AWS Lambda, and Amazon RDS.
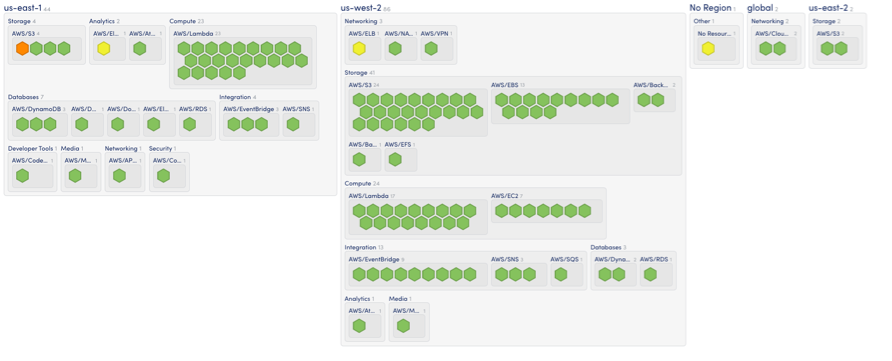
Now, think of LM Envision’s Active Discovery as the radar system that continually updates as new planes enter your airspace. For example, when you’re spinning up new AWS EC2 instances for a major campaign, you don’t have to worry about manually adding those instances to your monitoring setup. LM Envision automatically detects them, gathers performance metrics, and sends real-time alerts. It’s like flying a plane—LM Envision is the instrument panel, providing instant feedback so you can make quick decisions. You’ll always have a clear view of performance, allowing you to react immediately and prevent potential outages, ensuring smooth operations from takeoff to landing.
Unified dashboards: The control tower for complete IT visibility
In any complex environment, especially hybrid or multi-cloud setups, visibility is key. LM Envision’s unified dashboards act like the control tower for your fleet, offering a single pane of glass across AWS, on-premises systems, Azure, and Google Cloud. These customizable dashboards allow you to track key performance metrics such as CPU utilization, database performance, and network latency across all your environments.
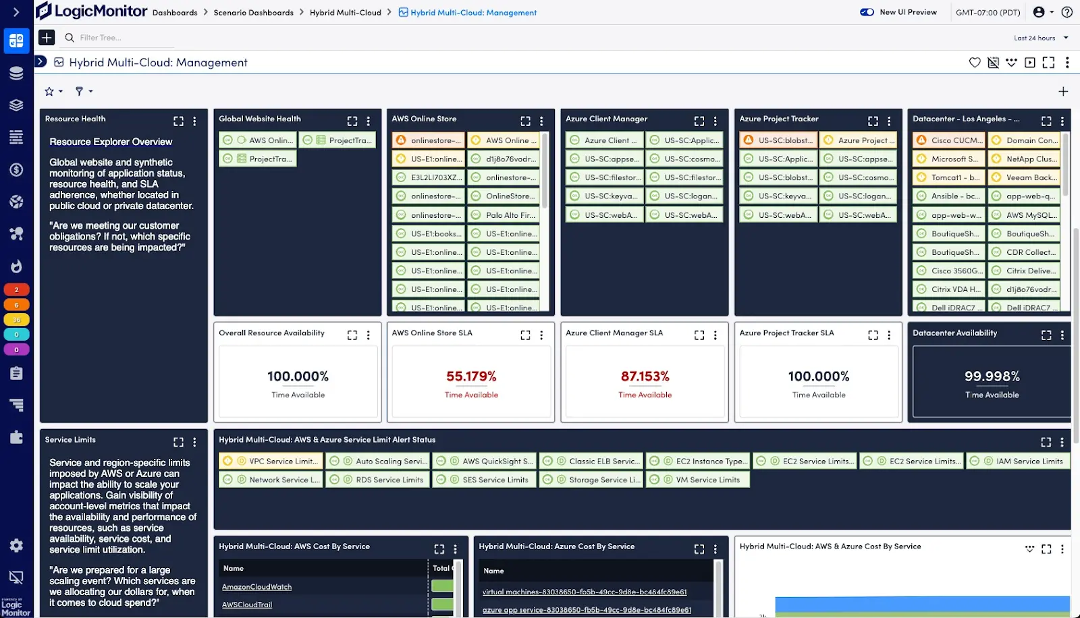
Think of these dashboards as your control tower. In a large airport, planes constantly land, take off, or taxi, and the control tower ensures everything runs smoothly. With LM Envision’s dashboards, you can monitor the health of your entire infrastructure in real time, from AWS EC2 instances to on-prem database health.
I’ve seen first-hand how these dashboards can transform operations. In one case, application latency spiked across multiple regions, but a customer’s traditional monitoring tools were siloed. They couldn’t easily tell if it was a network issue, a load balancer problem, or an AWS region failure. Once they implemented LM Envision, they built custom dashboards that provided insights into each layer of their stack, from the application down to the server and network level. When this issue happened again, within minutes, they isolated the root cause to an AWS load balancer misconfiguration in one region, drastically cutting troubleshooting time.
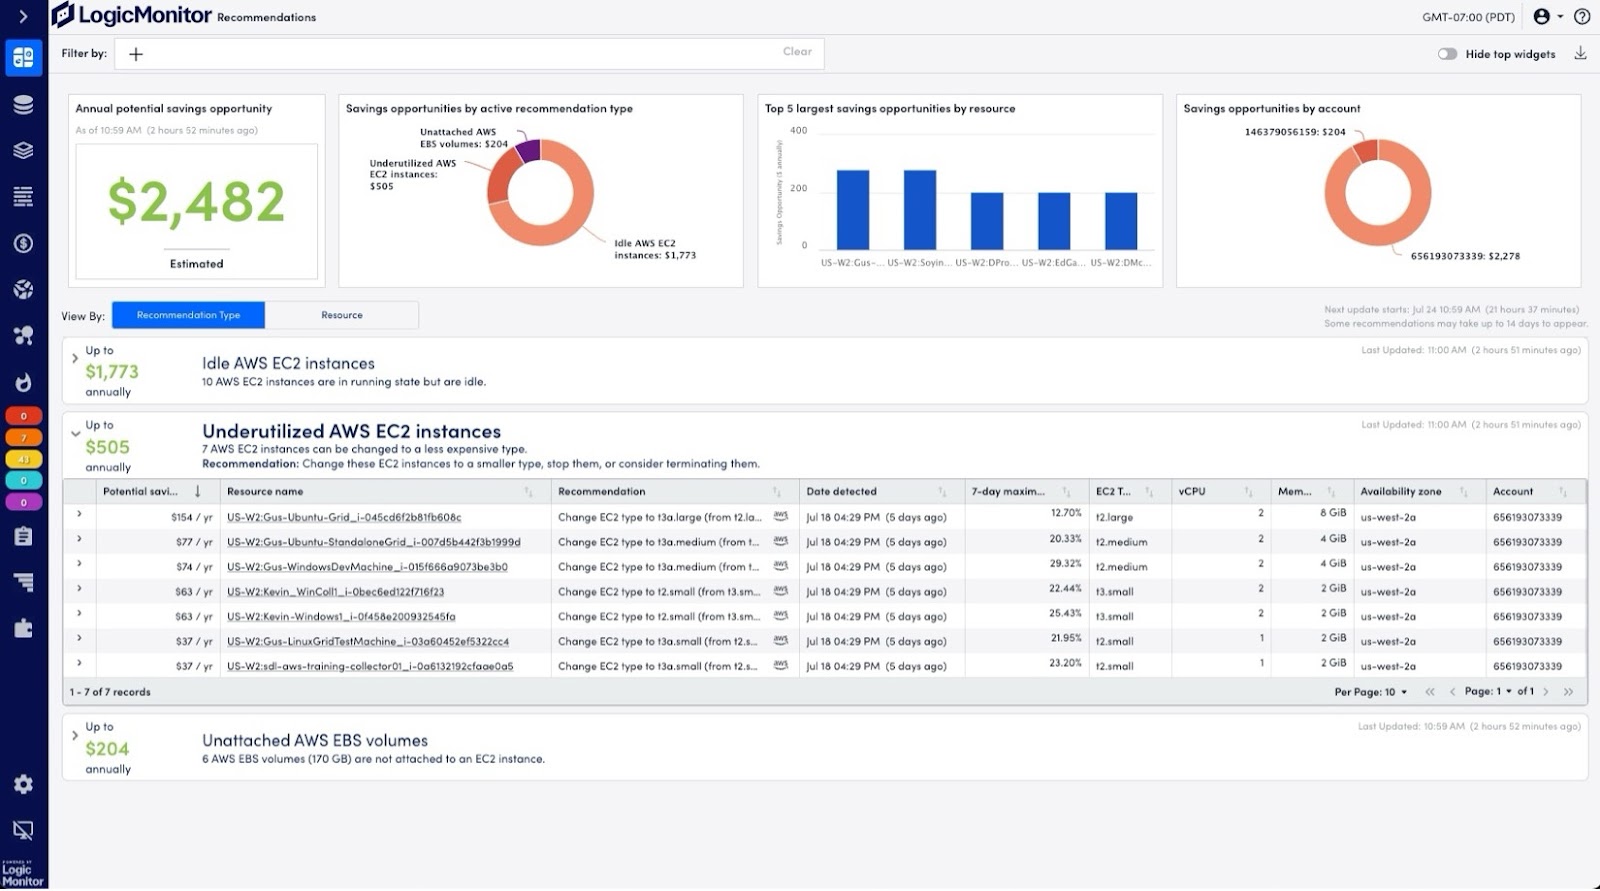
Cost optimization: The fuel gauge for efficient cloud spending
Managing costs in multi-cloud environments is like monitoring fuel consumption on long-haul flights—small inefficiencies can lead to massive overruns. AWS and Azure bills can quickly spiral out of control without proper visibility. LM Envision’s Cost Optimization tools, powered by Amazon QuickSight Embedded, provide a real-time view of your cloud spending. These dashboards enable you to identify idle EC2 instances, unattached EBS volumes, and other underutilized resources, ensuring you’re not wasting capacity.
LogicModules—with over 3,000 pre-configured integrations for technologies such as HPE, Cisco, NetApp, and AWS services—help monitor your infrastructure for the latest efficiencies. This allows you to right-size your cloud infrastructure based on real-time usage data.
In fact, a customer identified thousands of dollars in savings by using LM Envision’s cost forecasting tools, which provided actionable insights into resource usage. It’s like ensuring your planes fly with just the right amount of fuel and optimizing their routes to avoid costly detours.
Monitoring cloud migrations: Navigating turbulence with real-time insights
Cloud migrations can feel like flying through turbulence—downtime, cost overruns, and performance degradation are some common challenges. With LM Envision, you can monitor each step of the migration process, whether you’re rehosting or replatforming workloads to AWS.
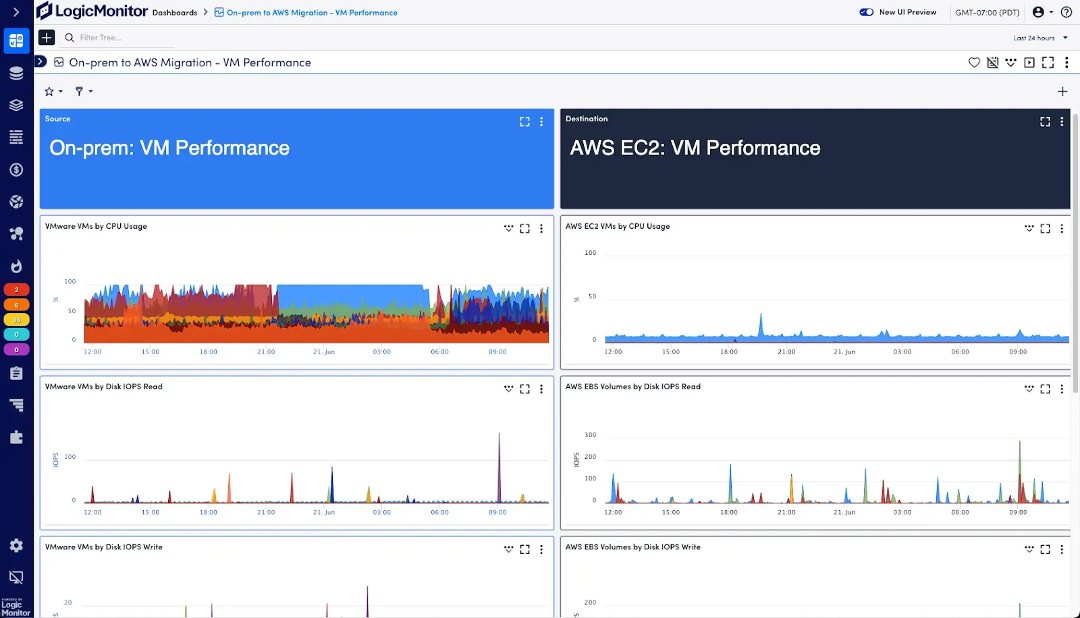
I’ve seen multiple cloud migrations where resource usage spiked unpredictably. In one migration to AWS, a customer saw sudden increases in EC2 CPU usage due to unexpected workloads. LM Envision allowed them to monitor the migration in real-time and adjust instance types accordingly, avoiding major downtime. The system’s real-time alerts during migration help you navigate smoothly, much like flight instruments helping pilots adjust their routes during turbulence.
Wrapping up
Managing hybrid and multi-cloud environments is now the standard, and effective management requires an observability platform that scales with your infrastructure. LM Envision not only provides real-time visibility and cost optimization but also reduces complexity, making it easier for IT teams to manage distributed workloads proactively.
With LM Envision, you transition from being a reactive firefighter to a skilled pilot managing your fleet from the control tower. It ensures you keep your operations running smoothly, whether monitoring performance, scaling your infrastructure, or optimizing costs.
The recent CrowdStrike outage highlights the urgent need for robust observability solutions and reliable IT infrastructure. On that Friday, employees started their days with unwelcome surprises. They struggled to boot up their systems, and travelers, including some of our own, faced disruptions in their journeys. These personal frustrations and inconveniences were just the beginning. The damage was much deeper with businesses facing operational downtime, financial losses, and reputational damage as a result of the outage. This incident surfaces the importance of a unified observability view across IT infrastructure to mitigate risks effectively.
Why enterprise-grade IT observability matters
While basic monitoring systems that focus solely on “up/down” status provide limited visibility, they often fail to identify the root cause of issues. Enterprise-grade IT observability goes beyond traditional monitoring by offering deep insights into system health, performance, and dependencies, which are crucial for effective troubleshooting.
Enterprise-grade IT observability capabilities, enhanced by advanced logging tools and generative AI companions, provide a single pane of glass view that reduces complexity and enables more effective problem resolution. By integrating various data sources and offering contextual insights, proactive observability tools significantly shorten Mean Time to Identification (MTTI) and Mean Time to Resolution (MTTR).
How LogicMonitor customers worked through major disruption during the CrowdStrike IT outage
During the CrowdStrike outage, LogicMonitor provided meaningful contextual information through the Windows log data ingested at or around the time the issue occurred, enabling customers to take the relevant course of action. Here’s a detailed account of how we helped one of our customers navigate the issue with LogicMonitor’s help.
A customer’s immediate response and resolution
During out-of-working hours, LogicMonitor detected a critical “down” condition on the servers across a customer’s Windows environment, ensuring no critical warning went unnoticed. As part of the troubleshooting process, the anomalies and logs provided by LM Envision offered additional context. The ‘message’ field in each anomaly highlighted unusual patterns, helping to identify potential issues more effectively.
The IT team was alerted immediately and able to detect the exact extent of the affected systems. The detailed, meaningful, and insightful context provided by the LM Envision dashboards allowed for rapid analysis and quick decision-making. This enabled them to efficiently monitor the restoration process, significantly improving their MTTI/MTTR.
With LogicMonitor’s proactive monitoring and detailed alert system, the customer was able to minimize downtime and mitigate potential breaches of SLAs during the outage. The detailed insights provided by LM Envision enabled the IT team to respond swiftly and effectively, reducing the impact on business continuity despite the widespread scope of the CrowdStrike incident.
How Edwin AI enhancements saved the day
One customer leveraging Edwin AI was able to correlate over 500 alerts to the CrowdStrike incident, showcasing the platform’s efficiency in reducing alert noise. Edwin AI’s advanced analytics and correlation capabilities were instrumental in quickly identifying the cause and effects of the situation.
Another customer using Edwin AI successfully identified the root cause of the failed CrowdStrike Falcon service. This customer used LogicMonitor to identify process-level failures, allowing them to correlate and pinpoint the exact cause of the disruption. Edwin AI’s proactive insights and detailed analysis significantly shortened their troubleshooting time.
The real-life stories of our customers emphasize the significance of not only advanced AI capabilities but also the crucial role of enterprise-grade IT observability in effectively managing widespread IT incidents. The CrowdStrike incident is a stark reminder of the pressing need for comprehensive observability solutions, not just for a select few businesses but for all enterprises to thrive in the digital era.
LogicMonitor’s capabilities for outage management
Hybrid Observability powered by AI
LogicMonitor’s approach to hybrid observability combines agentless monitoring with logs in context to provide a unified view of the IT landscape. The complexity in synthesizing various disparate data sources allows LM Envision to provide superior situational awareness. This streamlined approach reduces tool sprawl and enhances operational efficiency, simplifying security management and providing a comprehensive overview of your IT environment.
Proactive detection and response
Leveraging AI and machine learning (ML), LM Envision identifies anomalies in metrics and logs to help provide early warnings of potential problems. When a critical issue triggers an alert, LogicMonitor automatically ensures that teams are promptly notified. Additionally, monitoring out-of-band hardware controllers offers extra visibility into hardware health, facilitating faster issue resolution.
An added layer—Reducing alert noise and providing early warnings with Edwin AI
By analyzing vast amounts of data, LogicMonitor Edwin AI acts as a super IT operations (ITOps) teammate, working 24/7 to reduce alert noise and deliver actionable insights. Edwin AI prioritizes critical issues, thus reducing alert fatigue and accelerating root cause analysis. This capability is crucial during incidents like the CrowdStrike outage, where early warnings and proactive responses can significantly minimize business impact.
Wrapping up
The CrowdStrike outage has reinforced the critical importance of enterprise-grade IT observability. LogicMonitor’s hybrid observability platform, powered by AI, provides businesses with what they need to detect issues early, respond proactively, and maintain business continuity. By empowering customers during outages and preventing potential disruptions, LogicMonitor helps protect brand reputation and customer satisfaction.
by Beth Winters, Senior Product Marketing Manager
Enterprise hybrid IT environments are complex beasts, plagued by blind spots, siloed data, and slow incident resolution. Enterprise organizations need a comprehensive solution that provides hybrid observability within a single pane of glass to reduce MTTR/MTTI, eliminate those blind spots, correlate insights across their entire IT infrastructure, and achieve more granular control.
LogicMonitor goes beyond basic monitoring to deliver exactly that. LogicMonitor’s LM Envision platform delivers AI-powered insights that help IT teams accelerate troubleshooting, improve efficiency, and take a more proactive approach to monitoring.
Our latest innovations further extend this vision:
- Log Analysis: Empower your team with AI-guided insights for faster incident resolution.
- SNMP Traps as Logs: Extend hybrid visibility into legacy network technology to streamline troubleshooting.
- Role-based access control (RBAC) for Modules, Security Settings, and Recommendations: Enhance control and reduce administrative burden.
With LM Envision, you’re not just reacting to problems; you’re preventing them.
Let’s dive deeper into how these innovations are transforming IT operations.
Log Analysis: AI-powered troubleshooting for Level 1 support
Log data is a goldmine of insights, but without AI it is nearly impossible to mine all that data and find the insightful gold nuggets. Our new Log Analysis feature harnesses the power of natural language processing (NLP) and other machine learning (ML) techniques to create meaning from the vast troves of unstructured data that can be ingested into LM Logs, and expedite troubleshooting across the entire IT stack by surfacing and sorting problematic logs in a simple visual interface.
Log Analysis automatically sorts through thousands of logs and leverages AI to plot error codes, negative phrases, or keywords and extract numeric values from text. In the past, engineers had to manually create queries in a search bar with advanced parsing or regex capabilities. Log Analysis automates this previously manual and time-consuming process for users of all skill levels.
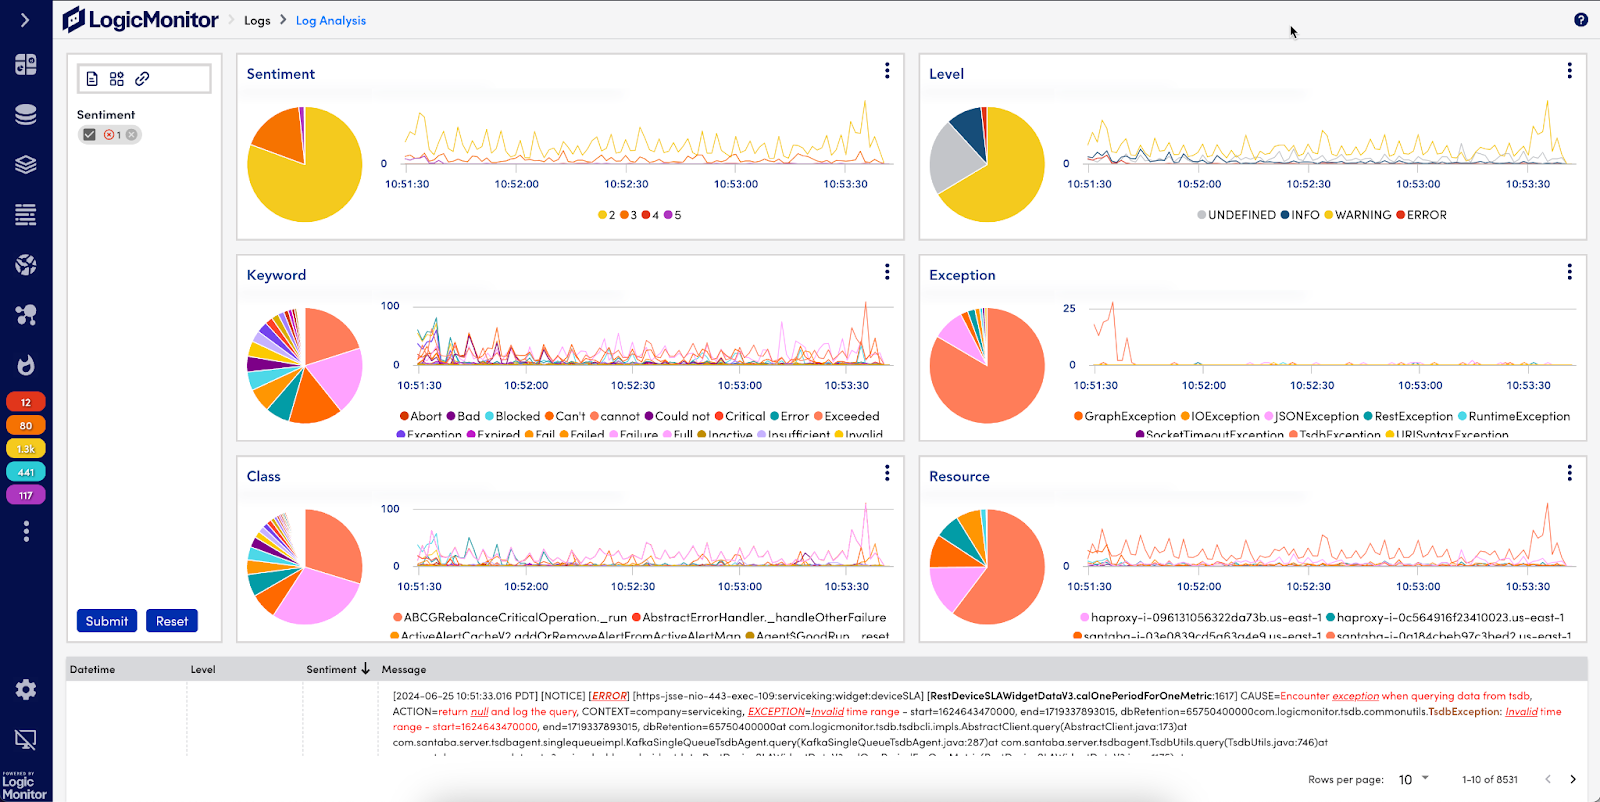
Log Analysis uses visual diagrams to quickly surface problematic logs.
Within Log Analysis, logs are now grouped into intuitive visual diagrams based on Sentiment, Level, Keyword, Exception, Class, and Resource. The Sentiment diagram allows you to view logs weighted by severity level on a scale of 1 to 5 (with 5 being the most critical) to help you prioritize and troubleshoot faster. The Keyword diagram groups logs by negative phrases like “error,” “failed,” or “critical” in a single view to help customers quickly identify issues and facilitate faster root cause analysis (RCA).
The intuitive visual interface allows for easy customization of specific log phrases and associated severity, so you can incorporate your own policies, dimensions, or user-defined keywords to tailor the groupings and sentiment scores for your specific environment.
Navigate seamlessly to Log Analysis from the Logs, Alerts, or Resource Explorer pages within LM Envision, and effortlessly exclude a term, drill down for details, and view log summaries with timestamps and frequency—all just a few clicks away. Log Analysis also works hand-in-hand with Log Anomaly Detection. Once an alert triggers, simply launch a Log Analysis session – without leaving the alert info screen or writing a complex log query – to pinpoint the problematic logs and identify the negative keywords and errors that contributed to the alert. Log Analysis will then apply machine learning and layered intelligence to scan the logs associated with the alert and serve up the most problematic logs in a simple visual diagram.
Key benefits:
- Empower Level 1 support: Enable less experienced team members to quickly identify and resolve issues with AI-guided troubleshooting, democratizing log insights.
- Accelerate root cause analysis: Pinpoint the source of problems faster with automatic log categorization, severity scoring, and the extraction of numeric values from text.
- Reduce Mean Time to Repair (MTTR): Get systems back up and running faster with actionable insights at your fingertips, presented in visual diagrams and summaries.
- Optimize efficiency: Free up your senior engineers for more strategic work by automating routine log analysis, improving Enterprise efficiency, and lowering administrative costs.
To learn more about Log Analysis, watch a quick demo video.
Please note that users must toggle on the latest UI to take advantage of this feature.
Putting our own features to the test
At LogicMonitor, we leverage our own products to monitor our infrastructure, applications, and services. So it comes as no surprise that LogicMonitor engineers have been using Log Analysis as part of LogicMonitor’s use and test approach, which allows us to stress test new releases with internal and external early adopters. Internal users have amazing things to say about this new feature. Nick Johnson, Senior Software Engineer, is “loving the tool so far” and has “been using it extensively for Cloud Recommendations.” He is especially excited about the negative phrases panel, which he says “has been huge in seeing where we’re over-logging, double-logging, and finding commonalities.” William Shipman, Site Reliability Engineer, stated that “the ability to extract numeric values from logs is one of the coolest things I’ve seen yet. I really like the negative phrase analysis, but the ability to plot counts over time and extract numeric values from text is game-changing.”

SNMP Traps as Logs: Unlocking comprehensive Network Monitoring
We knew the 90s were making a comeback from fashion to TV with “That 90’s Show” – but SNMP traps? They never went away. That’s because SNMP traps are still an essential part of Network Monitoring, and the market for network devices continues to grow. Traps measure network performance and health while providing timely information about important events across the vast network devices that keep your organization running.
In the past, NetOps managers and administrators have viewed SNMP monitoring as a necessary evil, requiring specialized (and often outdated) on-premises software that generates more alerts than the engineers could act upon. LogicMonitor has brought SNMP traps into the modern age by transforming them into Logs. This eliminates monitoring gaps and unlocks instant insights into Network issues in a user-friendly interface. Now, you can easily integrate traps into your overall Network Monitoring strategy in a single SaaS platform to immediately identify and troubleshoot network latency, hardware health, packet loss, or interface flapping issues.
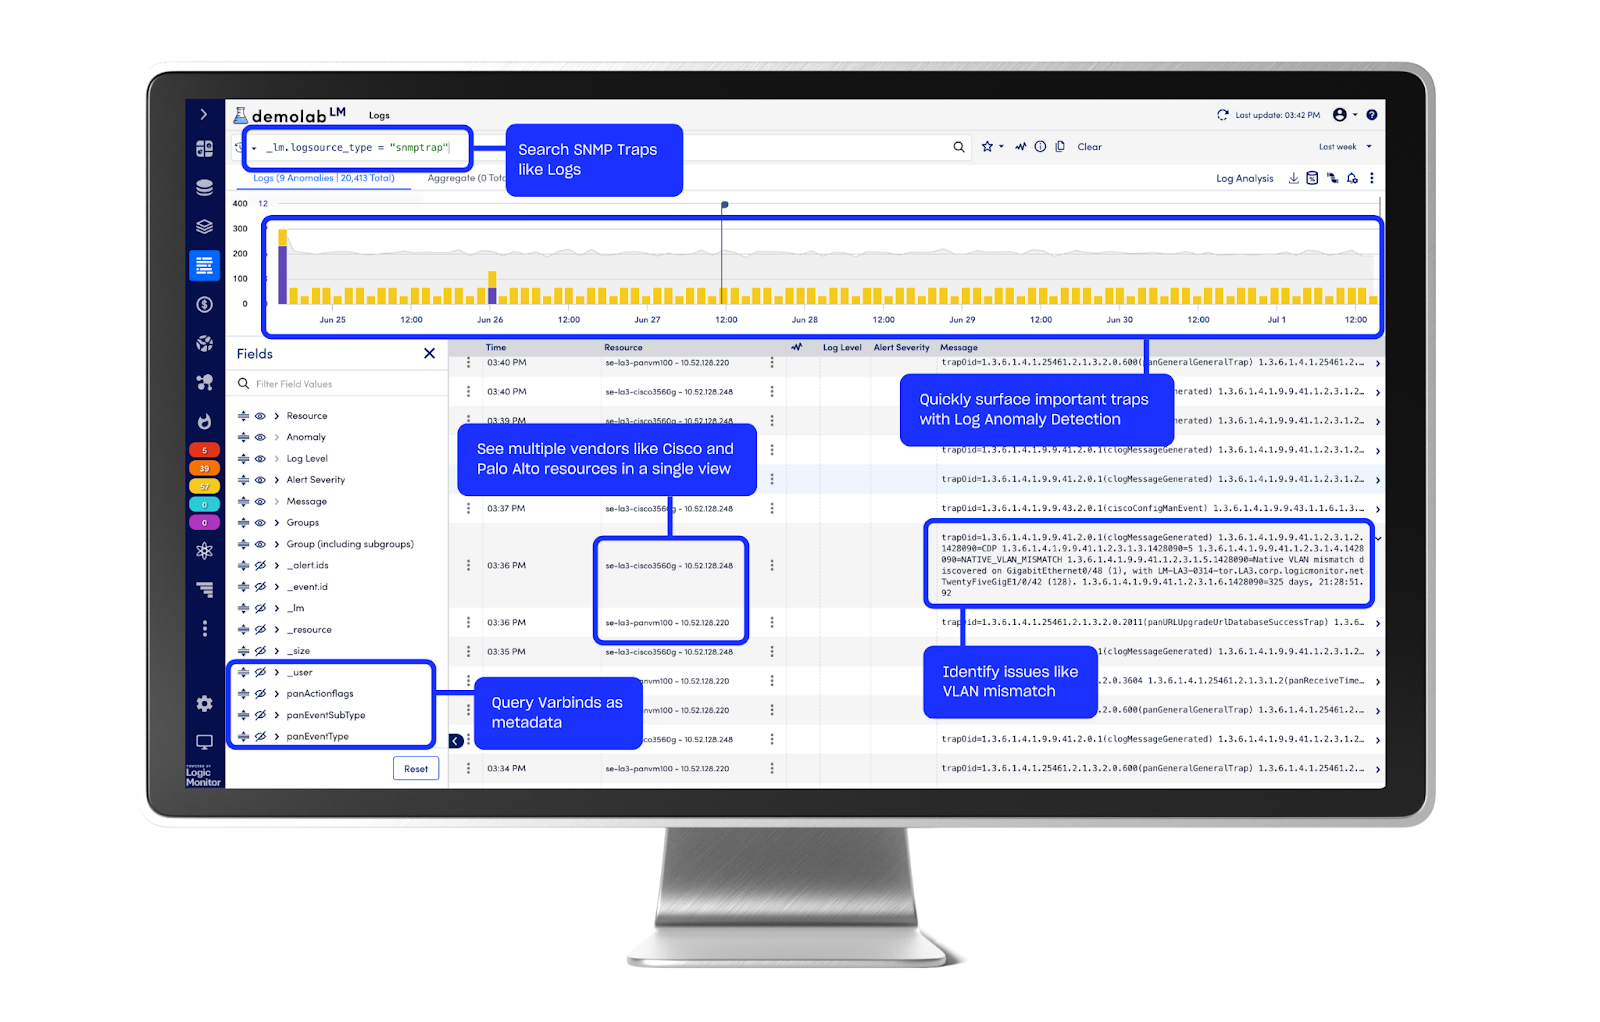
Search traps, create queries, identify anomalies, and more with SNMP Traps as Logs.
SNMP Traps as Logs are easily ingested via the LM Collector with no configuration required. With LogicMonitor’s flexible retention policies, there’s no need to maintain storage hardware for traps.
Key benefits:
- Centralized monitoring to reduce tool sprawl and data silos: Replace your old Enterprise trap management system and centralize your network monitoring approach in LogicMonitor. View SNMP traps alongside logs, metrics, and traces in real time, all in a single platform.
- Rich context for fast, proactive troubleshooting: Leverage logging features like Log Anomaly Detection, Log Analysis, queries, filters, data retention, and more for quicker incident resolution. Search historical traps and identify trends to remediate, predict, or prevent future issues. Edwin AI, LogicMonitor’s new generative AI product, can ingest logs and correlate related issues into a single ITSM ticket with a simple summary and recommendations that fast-track RCA.
- Reduced alert fatigue: With stateful alarm clearing, SNMP Traps as Logs will automatically close alerts when a related “clear” trap comes in, eliminating noisy alerts while retaining a record of duplicate alerts.
- 3,000+ seamless integrations: LogicMonitor’s LM Envision platform integrates seamlessly with SNMP Traps (v1, v2, and v3), standard encryption methods, your existing Network Devices, and incident resolution workflows through ServiceNow, Jira, PagerDuty, Slack, and more. For more information, check out our Integrations page.
- Parse and map OIDs and VarBinds: LogicMonitor pulls in critical information from SNMP Trap OIDs and variable bind values and translates them into user-readable values out of the box. LM Envision supports vendor-proprietary log formats as well as Syslog, providing a holistic log solution for Network Operations and Engineering teams.
- Custom MIB support: Users can upload their own proprietary or custom MIB files within the LM Envision platform, extending translation and visibility into any other product that sends SNMP Traps.
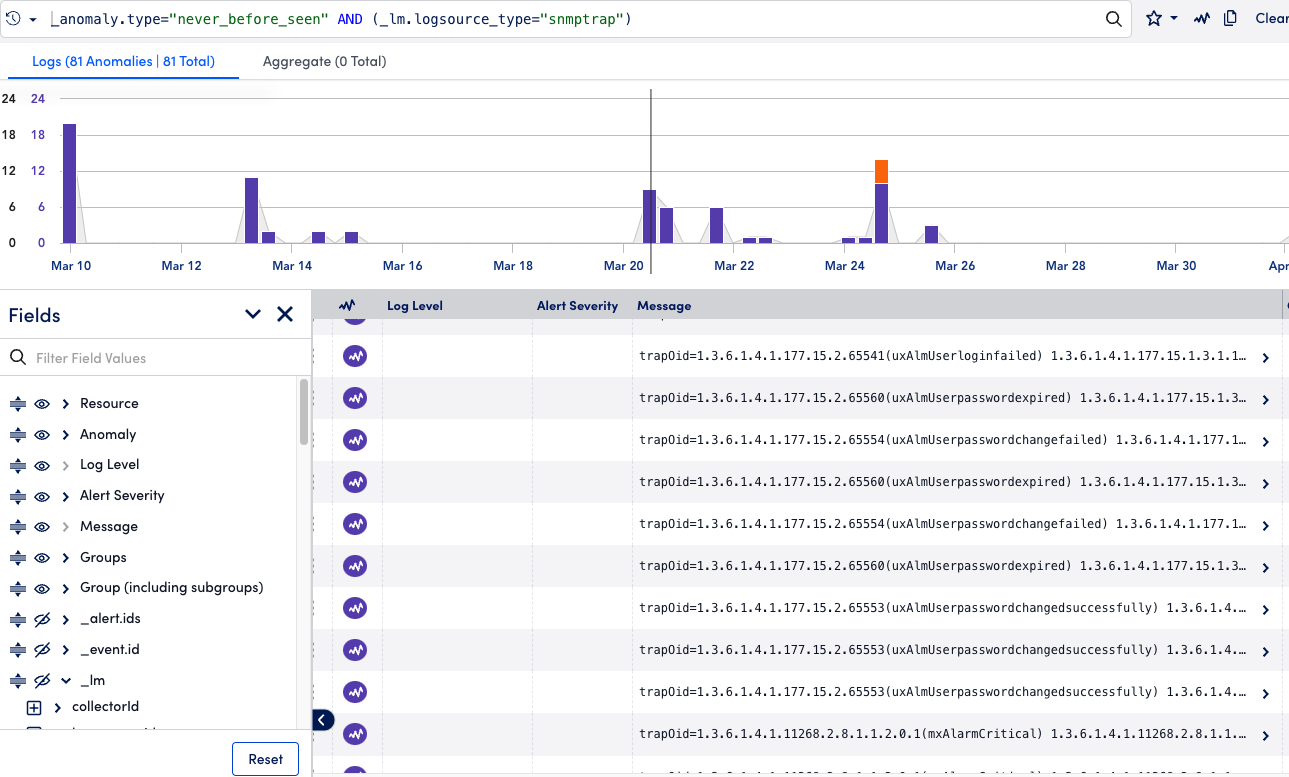
SNMP Traps as Logs leverages powerful log features like Anomaly Detection to quickly troubleshoot network issues.
SNMP Trap monitoring is a must-have for enterprises. Treating Traps will unlock much more value for our customers through existing log features. Simply send the traps through the LM Envision—no configuration needed—and let LogicMonitor do the heavy lifting for you to surface actionable insights and important alerts like equipment vendor certification changes, notification failures, or repeated login failures.
Watch our short demo video or visit the documentation site for more information about SNMP Traps as Logs.
RBAC for LogicModules: Granular role-based access controls to minimize risk
Large complex organizations like enterprises and MSPs have greater RBAC and security needs. With RBAC for LogicModules, these organizations can now set more granular permissions, ensuring that the right team members have the appropriate access level to view or edit specific LogicModules and the underlying data.
This enhanced granularity strikes an ideal balance between minimizing monitoring and outage risks while giving teams the control to monitor the correct data to maximize performance and visibility. Using the module editor, administrators can assign Access Groups to modules directly within the LM Envision platform. After assigning Access Groups, you can filter and view modules by these groups in ‘My Module Toolbox’.

RBAC for LogicModules extends the principle of least privilege to Modules.
The flexibility of Access Groups allows you to tailor permissions to your organization’s structure. You might give a user the ability to update alert thresholds for resource groups, or create “view only” permissions for specific modules. You can also create groups to ensure that:
- The database team can only edit modules related to database monitoring.
- The server team can only edit modules related to server monitoring
- And so on…
This targeted approach prevents teams from accidentally interfering with each other’s monitoring configurations, ensuring comprehensive coverage and reducing the risks of gaps in visibility.
For more information, visit the documentation site.
Security Settings and Recommendations: Protecting your portal with better security visibility and control
We are excited to announce Security Settings and Security Recommendations to help our customers get the most value from LogicMonitor and stay current with security best practices.
Security Settings is your new launchpad for managing security and RBAC within LogicMonitor. This centralized page simplifies the process of reviewing and modifying your environment’s security configuration, providing those with Security permissions with granular control and enhanced visibility over their portal security configuration.
Within Security Settings, you’ll also find Security Recommendations, a proactive tool displaying recommended actions to protect your portal better.
These recommendations can include suggested actions like enabling two-factor authentication (2FA), which adds an extra layer of security by requiring users to verify their identity through a third-party application or an authentication token delivered using SMS, voice, or email. You can apply 2FA globally for all portal users or on a per-user basis.
Important Note: If you’re using Single Sign-On (SSO), 2FA behavior depends on your SSO configuration.
- If SSO is not set to “Restrict Single Sign-On,” users can choose between SSO or 2FA for login.
- If SSO is set to strict access, users can only log in using SSO.
- To enable 2FA with SSO, you must configure it through your SSO provider.
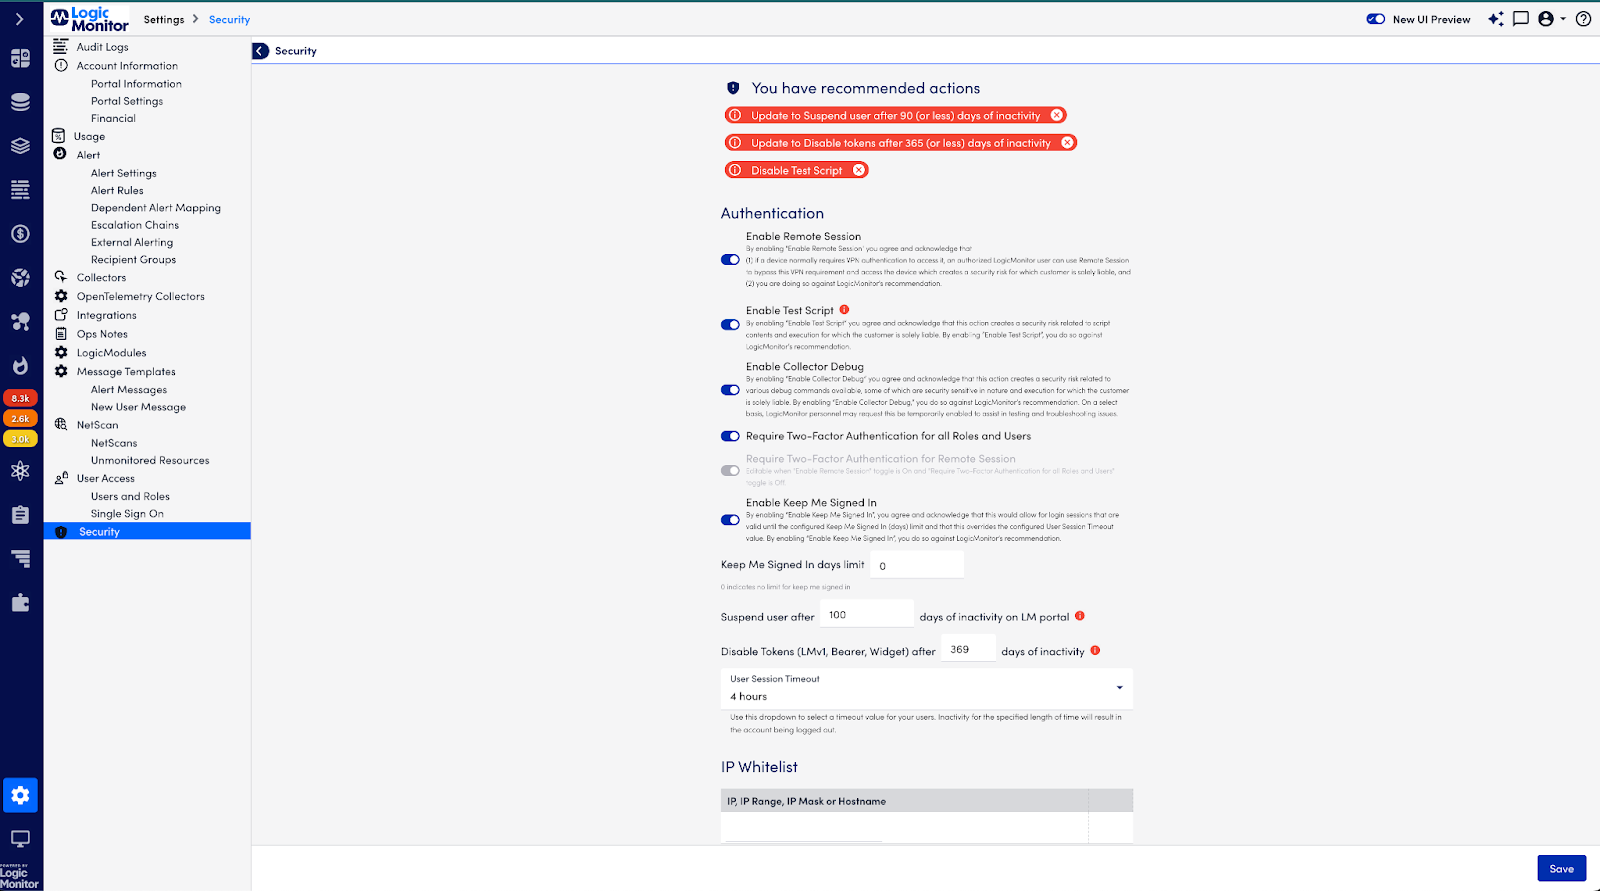
Security Recommendations gives you recommended actions that enhance the security posture of your LogicMonitor portal.
Other recommendations may include:
- Suspending inactive users after a specified period.
- Turning off inactive tokens after a specified period.
- Configuring an email domain allowlist.
By following these recommendations, you can proactively strengthen your LogicMonitor portal’s security and protect your valuable data.
For more in-depth guidance on securing your LogicMonitor portal, refer to LogicMonitor Best Practices or visit the Security Settings documentation site.
Fostering continuous innovation
With the latest enhancements to the LM Envision platform, LogicMonitor is committed to making it easier for customers to identify and troubleshoot issues quickly, monitor their network infrastructure, and ensure the security of their data. We are excited to see how our customers use these new features to improve their operations and achieve their business goals. Stay tuned for more exciting updates as we continue to innovate and provide our customers with the tools and resources they need to succeed.
If you’re a current customer and need help enabling a new feature, please reach out to your Customer Service Representative or engage directly with the product team in the LogicMonitor Community! If you’re new to LogicMonitor, take the next step on your journey toward Hybrid Observability powered by AI today by watching a quick overview of the platform and requesting a free trial.
This article kicks off a 4-part series on leveraging AIOps to provide a more efficient, cost- and resource-saving, reliable, and agile IT infrastructure.
- How Artificial Intelligence Supercharges IT Operations (AIOps)
- How IT Teams Leverage AIOps’ Capabilities
- Pump the Brakes: Some Key Considerations in Your Journey to AIOps
- The Road Ahead: 4 Ways AIOps Will Build More Resilient IT Operations
In today’s interconnected digital landscape, IT Operations teams have the herculean task of building smooth, well-constructed connections for networks, applications, infrastructures, and environments and then deploy the tools that will give visibility into how all those systems are performing. This is where Artificial Intelligence can play the role of an early warning system and advisor for your IT Operations (AIOps). AIOps use artificial intelligence and machine learning to intelligently predict slowdowns, warn of impending bottlenecks, and remove redundant, mundane, or repetitive roadblocks. AIOps reduce outages, issue early warnings ahead of slowdowns, and reduce Mean Time to Resolution (MTTR). When an organization uses AIOps, they’re signaling a desire to prioritize efficiency, reliability and agility. Integrating artificial intelligence is the difference between a desert road trip without air conditioning, and that same road trip with a/c and a cooler of water within arms length of both the passengers and driver.
So buckle up and explore the key components of AIOps, look at a real-world use case which illustrates its benefits, and discuss how AI could shape the future of IT operations.
Key Components of AIOps: Building the Road to Success
AIOps are highly effective at collecting a myriad of data from a multitude of sources to detect patterns, gain predictive insights, and automate solutions with the end goal of reducing the length of downtime episodes. Platforms that include AIOps use fewer resources, processes, and tools while experiencing better visibility, improved response times and better consistency within their infrastructure and networks. Most AIOps deployments include three main components:
Data collection and aggregation: The volume, variety, and vastness of data is beyond the capabilities of human interpretation, but machines are built to handle this velocity. AI effortlessly analyzes information from logs, applications, user behavior analytics, and other valuable insights, to create a virtual map of your technology stack. The drawback here is if the data is compromised or outdated, the result will be inaccurate analysises, false positives, false negatives, and incorrect predictions. Data governance and quality monitoring are critical to ensure the accuracy of AI-driven operations.
Machine Learning: Organizations that pair machine learning algorithms and AI’s evolutionary self-learning techniques enable their operational systems to recognize patterns, detect anomalies, and even predict system issues so IT teams can resolve them before they become a negative disruption to the developer or user experience.
Automation and remediation: AIOps incorporates intelligent remediation capabilities with root cause analysis that can automate a resolution. Like a road crew working through the weekend in shifts, self-learning AI is always detecting mundane work and automating it. With AIOps determining which issues are a priority and need to be escalated, IT teams can pave the way for innovative growth and high-priority projects.
0 to 60mph: AIOps Accelerates A Real-World Use Case for AIOps
Let’s take a look at how AIOps resolved a fragmented and inefficient IT operation at a global energy management leader.
Challenge: The organization was operating across 30 platforms responsible for 25,000 network devices. This created inefficiencies, painful complexity, and no unified view into the tech stack. Efforts to fix visibility only resulted in adding redundant tools that further complicated data aggregation, operational communications, and issue detection and resolution.
Solution: The organization defined its prioritization of hybrid observability as “everybody looking at the same set of metrics.” Efforts to add platforms to improve monitoring only worsened tool sprawl and complexity. So the company invested in a single platform which is able to deploy their entire IT cloud and network infrastructure. Now the organization has reduced all their clusters, pods, and projects from 30 different platforms to just five. They have hybrid observability in a single pane of glass and the organization has seen massive wins in downstream operations, including:
- 40% reduction in false alerts (went from 17,000 to 10,000 after AIOps deployment)
- 83% consolidation in monitoring tools
- Full stack visibility across:
- Network infrastructure
- Cloud infrastructure
- Kubernetes
- On-Premises
In the 2-minute video below, hear first-hand how the organization built a roadmap to better observability, reduced MTTR, and is closer than ever to achieving their goal of “self-healing” with AIOps.
The Road Ahead: The Future of AIOps
Artificial intelligence and machine learning tools will pave the way for exponential growth as future business workloads require improvements to operating systems both in the cloud, on-prem, and in hybrid environments.
As the implementation of AIOps grows, the technology sector will benefit from:
- Data Silo Demolition
- Less Operational Noise
- Improved Customer Satisfaction
- Improved Financial Performance
Data Silo Demolition: AIOps processes and aggregates inputs at speeds the technology industry has never seen before. Putting this cumbersome task on the plates of AI frees up business-critical IT teams for innovation as their work streams become partially automated and the removal of redundant tasks allow them to focus on “the next big thing.”
Less Operational Noise: This is both the literal sense of fewer false alarms and warnings being issued, and the philosophical sense of AIOps prioritizing and filtering alerts based on relevance. With fewer alerts to tend to, and levers being pulled for more relevant issues, IT teams will have more time to focus on the most critical issues within their operations.
Improved Customer Satisfaction: AIOps proactively mitigate issues which could disrupt the overall user experience, service, or delivery processes. This mitigation practice provides customers and prospects with a digital experience that surpasses the competition.
Improved Financial Performance: AIOps improve resource usage, remove roadblocks and inefficiencies, and forecast demands or possible performance issues. All of this improves an organization’s bottom line. AIOps can also be deployed to identify patterns, trends, and obstacles within an organization’s financial management, improving cost savings through better management of financial strategies, investments, and operational costs associated with any expansion plans.
Next Steps
LogicMonitor is proud to power the journey to AIOps by offering these free educational resources:
Proactive Monitoring with AIOps Early Warning System
Why the visibility gap is holding your IT operations back
What is AIOps and How is it Changing IT Operations?
Comprehensive AIOps for Monitoring eBook
How to Eliminate Tool Sprawl Without Causing a Rebellion
The AIOps early warning system demo
Why does reducing MTTR matter?
Depending on your business, MTTR stands for mean time to repair or mean time to recovery – but it can also mean resolution, resolve, or restore. No matter how you define it, the basic measurement is the same: it’s the time it takes from when something goes down to when it is back and fully functional. This includes everything from finding the problem to fixing it. For ITOps teams, keeping MTTR to an absolute minimum is crucial. And the biggest obstacle to lowering MTTR is correlating information from disparate sources. You can’t fix what you don’t understand.
The right monitoring solution brings information from your entire stack into a single, centralized view to increase efficiency when resolving problems, not swiveling between tools and solutions looking to find where the problem lies. Ops teams can’t reduce MTTR without understanding connectivity across IT environments and removing guesswork at every step. It’s difficult in modern, complex IT environments to know precisely why a failure occurred so you can quickly identify, fix, and leverage learnings to maximize service availability.
A modern infrastructure stack contains a large number of resources, servers, and services all generating large amounts of data. When a problem occurs, it’s reported from multiple sources at different severity levels, and often missing some crucial data for identification, troubleshooting, and resolution. As an ITOps team striving for improved service availability and efficient response times, you must find ways to seamlessly correlate such diverse data across the complex network and cloud environment you manage.
Is your monitoring today enough to hit your MTTR goals?
Traditional IT monitoring alone leads to long, costly, high MTTR for Ops teams and your overall business. While ITIM (IT Infrastructure Monitoring) tools can help assess the impact and severity of a problem, monitoring alone is no longer enough to quickly resolve issues. Monitoring dashboards and alerts simply do not provide enough information to move quickly from diagnosing to resolving incidents across complex hybrid IT environments. Ops teams aren’t equipped with the right solution to analyze the noise and connect the data across IT to know where to investigate and troubleshoot. Instead they are forced to switch between tools and sift through siloed data streams trying to find connections.
IT metrics and alerts only acknowledge that a problem is happening, not necessarily where and how. Alerts are often based on manual static thresholds to determine the severity and don’t provide enough connection to the primary issue. With just IT metrics and signals alone, Ops teams rely on inefficient, manual processes to fill in the gaps in IT health, wasting time blindly troubleshooting to resolve issues.
Here is an example of a failure that could impact your Ops teams today. What happens when one of your most important Database servers stops consuming messages from Kafka and service is interrupted across your customer base? Metrics and alerts show that something has gone wrong but your Ops teams can’t quantify how many customers are affected or the root cause. The team can’t spend hours manually troubleshooting the situation by looking at the servers because your customers are affected and you can’t guess since the impact is unknown. There is a solution – but it requires filling in the visibility gap of IT monitoring with a context-rich data source: logs.
Reducing MTTR with actionable, contextual data
Context is key to reducing MTTR. Teams need the right information at the right time in a single solution to troubleshoot IT issues faster and reduce overall MTTR. IT monitoring provides information around the health of your environment, but logging IT data for devices generates and records specific events that occur in your environment. Logging helps explain what was happening at the time the log was created. IT monitoring without log data for devices and cloud services isn’t enough to connect data across complex hybrid IT environments to pinpoint root causes for troubleshooting.
Integrating as much context-rich information about your modern IT environment will strengthen the impact of your metrics and alerts to provide intelligence for Ops.
Modern monitoring solutions support integrations with visibility into hybrid and multi-cloud solutions from applications or IT infrastructure devices, such as syslogs, Windows Event logs, and cloud services logs.
- Syslogs are one of the most common log data sources in enterprise environments and help optimize network performance
- Windows Event logs help fill immediate gaps in valuable data for systems built around Windows servers and VMs
- Collecting logs from AWS, Azure, or GCP services provides insight into specific events happening across your cloud services that may impact your infrastructure health
- Application logs, and all other types of custom logs, fill in the gap of data possible to record for a better understanding of what is happening alongside IT metrics
Contextual log data helps Ops teams follow alerting to increase detection of the issue across devices, cloud services, and applications, for faster problem resolution, and ensure there are no dead-end investigations.
Radically reducing MTTR requires a modern monitoring solution that centralizes log data for Ops teams from both on-prem and cloud, correlates metrics and logs, and creates new practices to understand root causes of problems. Surfacing this log data alongside existing monitored resources makes it possible to know what is wrong with your system with key IT health metrics that show you why the problem is happening.
Log data helps detect and reduce MTTR across modern IT environments
A system with unified logs and metrics gives Ops teams full visibility into their entire infrastructure ecosystem with context and correlation to analyze log data so they can increase efficiency and resolution. Compiling logs and IT infrastructure data in one monitoring solution helps to eliminate context switching so Ops teams can meet and accelerate their business objectives to focus on innovation.
It’s critical to empower your Ops teams with insights and context alongside infrastructure metrics for rapid troubleshooting. For example IT performance metrics dashboards allow Ops users to analyze spikes in key health indicators like memory and CPU usage dropping, page load time, and disk utilization increasing, and hop over to log data for the specific devices to read error messaging and identify the root cause faster.
The result? Ops teams become a stronger first line of defense with log data available at their fingertips when issues occur, and can ultimately decrease MTTR by comparing log data alongside IT metrics. Ops teams can see which logs are important to identify further and continue the investigation.
In short, access to log data helps detect and solve issues faster by providing guidance on precisely where the problem is occurring with detailed, timestamped information for each device.
Fixing problems once and for all requires log data
There are many tools and solutions out there to take control of complex environments, but traditional IT monitoring is no longer enough.IT faces a landscape of increasingly challenging business continuity, MTTR, and performance requirements. Organizations must deal with the complexity of modern IT environments, the large number of devices and applications, with cross-site operations and disaster recovery requirements. Ops teams need centralized access to the log data information relevant to their specific functions.
Unified logs and metrics give Ops teams full visibility into their entire infrastructure ecosystem with context and correlation to analyze log data to actually increase efficiency and reduce MTTR. As you plan for the future, it’s crucial to remove existing blindspots and streamline workflows within a single monitoring solution to enable IT teams to work efficiently, without swivel chair switching between monitoring and logging solutions.
To truly unlock the power of IT Ops and significantly reduce MTTR, however you define it, the solution is a long-term investment in log data infrastructure that can both collect and respond to the diverse, complex log data generated by increasingly complex IT environments. So, what are you waiting for?
Performance monitoring has become increasingly important for operations teams in today’s rapidly changing digital landscape. The DORA metrics are essential tools used to measure the performance of a DevOps team and ensure that all members work efficiently and collaboratively toward their goals.
Here, we’ll explore what exactly DORA metrics are, how they work, and why companies should be paying attention to them if they want to set up an effective DevOps environment.
What are DORA metrics
DORA (DevOps Research and Assessment) metrics are performance indicators used to measure the effectiveness of DevOps processes, tools, and practices. They provide valuable insights into the state of DevOps in an organization, helping teams understand which areas need improvement and where they can optimize their processes.
What are the 4 DORA metrics?
The four main DevOps metrics—Deployment Frequency, Lead Time for Changes, Mean Time To Resolution, and Change Failure Rate—are crucial performance indicators that you should be tracking to ensure a thriving DevOps environment. Let’s take a closer look at each of these metrics so that you can gain a better understanding of why they are important.
Deployment frequency
Deployment frequency is an essential metric for ITOps teams to monitor and measure. It measures how often code changes are released into production, which can have a dramatic impact on the quality of the end product and user experience. Deployment frequency also helps identify potential issues with development processes that could slow down the release process.
The benefits of increasing deployment frequency include faster delivery of customer value, better uptime, fewer bugs, and more stability in production environments. By increasing deployment frequency, ITOps teams can improve customer satisfaction, lower costs, and speed up time-to-market for new products or features.
Best practices for improving deployment frequency include:
- Automate as much of the deployment process as possible to reduce manual tasks and human errors
- Create a clear release process with defined roles and responsibilities – everyone should understand who is responsible for what to reduce delays in the deployment process
- Develop effective monitoring strategies to quickly detect issues with newly-released code and fix them before they become widespread
- Monitor for any regressions that could occur after a new release – if there are any, roll back the release and take corrective action
- Test early, test often – conduct rigorous testing to make sure that any new code releases are safe and reliable
Lead time for changes
Lead time for changes is a measure of how long it takes between receiving a change request and deploying the change into production. It’s an important metric because it’s related to both customer experience and cost efficiency. If there are long delays between receiving a request and making changes, customers will suffer from poor service or delays and businesses can incur extra costs due to inefficient processes.
To reduce lead time for changes, ITOps teams should focus on improving their processes in several key areas:
- Automation: By automating as many manual tasks as possible, ITOps teams can streamline the process and reduce the amount of time needed to make changes. This includes automation tools such as configuration management systems and infrastructure-as-code solutions.
- Infrastructure provisioning: Provisioning infrastructures can add significant delays to the change process, so it’s important to streamline and optimize this part of your workflow. Look into using tools like containers or serverless solutions to reduce the time needed for infrastructure setup and configuration.
- Monitoring/alerting: Having good monitoring and alerting systems in place can help ITOps teams identify problems quickly and take corrective action faster, reducing lead times for changes. Make sure you have good logging and monitoring practices in place to ensure your team is aware of any issues as soon as they occur.
Mean time to resolution
Mean time to resolution (MTTR) is a measure of the time it takes from initially detecting an incident to successfully restoring customer-facing services back to normal operations. This is a measurement of the overall effectiveness of an organization’s Incident Response and Problem Resolution Process. For IT operations teams, MTTR is an important metric that can provide insight into how efficiently they can identify and fix problems as soon as possible.
MTTR serves as a direct indicator of customer satisfaction, since customers will be more likely to remain loyal if their issues are addressed quickly. Additionally, too much downtime can result in lost revenue opportunities from the inability to sell or deliver products or services.
There are several best practices that teams can employ to reduce the amount of time it takes to restore service after an incident. These include having an established Incident Response plan, setting up automated triggers and notifications, assigning a single point of contact responsible for managing incidents, and training team members on incident response processes.
Change failure rate
Change failure rate (CFR) is a measure of how often changes to a system cause problems. It is calculated as the number of issues divided by the total number of changes attempted in a given period.
Understanding change success rates helps organizations understand where resources and efforts should be focused for improvement. High success rates indicate that processes and procedures around making changes to the system are working well. Low success rates indicate areas for process improvement or increased training on specific technologies.
Organizations can track their CFR over time and compare it against benchmarks from other organizations in the same industry. This helps identify areas where their change processes can be improved. It also provides insight into potential causes of failure, such as a lack of resources or training for personnel involved in making changes to the system.
The DORA metrics are essential for the success of ops teams, and it’s important to keep them healthy. With understanding what each metric means, you can use it as a guide on how your team is performing and identify areas that need to be improved. While there are many methods for refining your system efficiency or finding better solutions, gaining insight from these four metrics gives you a structural approach and clear view of optimization.
Importance of DORA metrics for ITOps teams
DORA metrics are key performance indicators that help ITOps teams measure the effectiveness of their processes. These metrics are considered essential to successful DevOps initiatives because they provide valuable insight into how well an organization is succeeding in its digital transformation efforts.
By using these metrics, ITOps teams gain insight into where their processes need improvement, allowing them to focus their efforts on specific areas. The ability to monitor progress towards goals, identify opportunities for improvement, and optimize existing processes is essential for successful DevOps initiatives. Ultimately, the use of DORA metrics by ITOps teams helps them become more efficient and effective at delivering value to customers.
Importance of monitoring and improving these metrics
The importance of monitoring and improving DORA metrics cannot be overstated. Since the introduction of DevOps, organizations have been striving to improve development cycles, reduce risk, and deliver deployments with higher speed, reliability, and quality. As a result, software delivery has become an increasingly important factor in driving organizational success.
These metrics allow teams to track how quickly they’re releasing code changes into production environments, how long it takes from code commit to deployment, how often those changes fail, and finally, how quickly the team responds when a deployment fails.
Increasingly, organizations are investing in proactive monitoring and alerting tools to monitor their DORA metrics on an ongoing basis. These tools can provide quick visualizations of performance trends across the four key metrics, enabling teams to spot opportunities for improvement earlier and make better decisions about optimizing their processes.
In addition, certain types of tooling can help automate a number of tasks associated with managing and optimizing DORA metrics. For example, automated deployments simplify the process of deploying code into production environments, reducing cycle time by eliminating manual steps from the process. Test automation helps reduce failure rates, and automatic rollbacks enable teams to quickly restore services in the event of a failure.
A Year in Review for LM Logs
A new year means a new set of goals. In 2022, we set some lofty goals to help our customers achieve clarity across their modern IT infrastructure. We set out to do this by improving our log collection and analysis within LM Envision, our hybrid observability platform, which was announced at LogicMonitor’s Elevate user conference this summer. At the conference, we gathered feedback to understand the various ways our customers access and review log data. The difference maker was in the ability to find the root cause faster and provide contextual analysis for front-line Ops teams. Our log analysis and searching options are now easier than ever to use, and customers have noticed the impact to their workflows and ability to innovate. Now it’s time to reflect on several product innovations and accomplishments within LM Logs and consider how we’ve helped our customers this year. We hope you’ll enjoy seeing some of the highlights from 2022.
Unified logs and metrics
Need to catch up on LM Envision’s unified logs and metrics workflow? LM Envision and LM Logs offer intelligent log analysis for all layers of the tech stack in hybrid and multi-cloud environments. LogicMonitor streamlines access to log data for Ops teams to provide contextual insights into the connection across IT devices and services, runs anomaly detection at time of ingestion to surface insights worth investigating, and reduces MTTR with rapid troubleshooting.
Key pillars of customer value
When we decide what to build, we make sure every product improvement hits one of three goals:
- Make it easier to use – consider what IT Ops teams can do with the knowledge instead of simply learning how to use the software
- Provide quick value – ingesting log data into LM Envision should show immediate benefits from contextual analysis and insights
- Integrate seamlessly into existing IT Operations workflows – log analysis should naturally flow into the next stage in LM Envision to take action, remediate a problem, or improve your proactive monitoring and alert conditions
Let’s explore the main ways that LM Logs improves IT Ops workflows.
Make it easier to use: usability improvements
LM Logs now offers several feature enhancements to make log analysis easier for Ops teams. Logs tables and graphs load asynchronously for faster loading for devices that emit large amounts of logs. Additionally, selecting a time range for analysis runs log queries automatically. Log event columns in the aggregate results view can be sorted in ascending or descending order with a single click, eliminating the need to define sorting parameters in the query. These usability improvements add on to the existing query and searching capabilities that support Ops teams and help them focus on what matters.


Provide quick value: advanced search
LM Logs provides a starting point for analysis with keyword and autocomplete search, and advanced searching includes new operators for aggregate results. Advanced searching now allows users to apply additional filtering by using aggregation functions such as average, minimum, maximum, and sum. This allows users to see a total count of search results in the aggregate tab, giving a comprehensive overview of their log data.
LM Logs also offers multiple visualization options such as bar, line, and area graphs to display aggregate results – with more options coming soon. Customers can now gain more insights when visualizing log data results to easily detect any potential issues and take appropriate action.
Finally, users can use the new timeslice aggregation function to group log query results by fixed time intervals (such as minutes and hours) to more accurately examine and analyze their log, allowing them to quickly identify and remediate any IT issues.

Integrate seamlessly into existing IT Operations workflows: alerting
Another product innovation we’re focusing on is minimizing noisy IT alerts within LM Envision. Users can create log pipelines – directly within the LM Logs tab – to extract meaningful data from their log data sources and define and create alert conditions that notify when certain logs are received. This contextual workflow within LM Logs helps users quickly create, test, and refine log pipelines and immediately create specific conditions that trigger LM Envision alerts when certain events or anomalies occur within the log data. This control over alert conditions creates a more tightly integrated workflow within LogicMonitor’s platform between logs and metrics, allowing customers to take advantage of its powerful log analysis capabilities to make faster and better informed decisions.


Enhanced Log data retention
LM Logs has always enabled customers to access their historical data for fast analysis. To further support customer needs, LogicMonitor now offers multiple options for data retention to ensure customers have access to the data they need when they need it, without having to worry about limits. Seamlessly uniting on-demand historical log data with the rest of LM Envision’s metrics and logs adds clarity across IT.
This past year, we had the pleasure of seeing many of our customers get tremendous value out of LM Envision’s unified logs and metrics workflows. Here are just a few of the successes we witnessed throughout the year, thanks in part to the product enhancements for our logging capabilities.

Schneider Electric reduces MTTR and alerts by 40%
Schneider Electric, a multinational energy management organization, reduced their MTTR of IT incidents and reduced alerts by 40%, thanks to LM Envision’s unified logs and metrics workflow. Schneider Electric found value quickly after configuring setup for log analysis. Sankeet Lokhande, Senior Engineer at Schneider Electric, said that the out-of-the-box “anomaly detection has helped us get to the root cause quickly” and “dynamic thresholds and AI forecasting let us pinpoint the issue and troubleshoot. Otherwise we’d waste hours reviewing stuff manually.” LM Logs helped Schneider Electric ensure system uptime and reliability, as well as provide teams with timely, accurate data. Accessing log data within a dynamic observability platform is invaluable for a company as large as Schneider Electric, supporting 20,000+ network and cloud devices.
Read the full case study: https://logicmonitor.com/resource/schneider-electric-consolidates-monitoring-tools-by-83-with-logicmonitor
Loyola University of Maryland saves $3k per year in tool consolidation
Loyola University of Maryland, home to more than 5,000 students, is now saving almost $3,000 per year after consolidating tools with LM Envision. Loyola University gained immediate visibility into their campus network performance across their hybrid IT environment with LM Logs. Loyola University also consolidated their hardware switches after LM Logs provided a centralized repository for their aggregated log data for easy analysis. According to Mike Dieter, Senior Systems Engineer, LM Logs helped ensure system reliability and “free up time to spend on things that add value back into our operations, instead of trying to figure out why this isn’t working.” Mike also saved precious time with LM Envision’s integrated workflow to save searches, create log pipelines, and refine log alert conditions.
Read the full case study: https://logicmonitor.com/resource/loyola-university-maryland-connected-campus
RaySearch Labs of America reduces MTTR by 60%
RaySearch Labs of America is advancing cancer treatment through their innovative research software. John Burriss, Senior IT Solutions Engineer, found their previous log analysis solution inefficient and time-consuming for troubleshooting, but with LM Logs, MTTR time was reduced by 50-60% with faster root cause analysis. “50 to 60% of my time was spent looking through logs to find the issue,” said Burriss. “I didn’t have time to work on system upgrades or make sure users were having a good experience.” During the LogicMonitor trial, LM Envision’s log-based anomaly solution detected application configuration issues. RaySearch Labs continues to drive innovation by expanding visibility into potential issues in their cancer research applications with LM Logs.
Read the full case study: https://logicmonitor.com/resource/unified-observability-helps-raysearch-advance-pioneering-cancer-treatment-software
Preparing for 2023
As we look ahead to 2023, LogicMonitor will continue to invest in LM Envision’s unified logs and metrics workflows to strengthen ease of use, time to value, and integrated Ops workflows. Areas of focus in the new year include:
- Streamlined log data ingestion into LM Envision for various log data sources
- Improved dashboarding to visualize log data directly alongside IT metrics
- Smarter platform intelligence to surface log data in context throughout other workflows
- Creating log anomaly profiles for new insights into opportunity for analysis
- Improved reporting with actionable insights into log data usage and trends
If you’re still unsure how ingesting and analyzing logs in LM Envision helps your teams reduce MTTR, LogicMonitor makes it easy to trial and view this contextual data for your existing IT devices.
We are excited to deliver more product enhancements in LM Logs to further improve the overall Ops workflows within LM Envision. Check back soon for announcements from LogicMonitor as each new product capability is released.
So your team has access to a logging tool? Great! What’s the first thing you want to find? The latest config change gone wrong? Data from 30 days ago when a specific server was at high capacity? Or maybe you’d like to access logs for a certain IP on a certain day for specific HTTP and servers with counts and averages.
Hopefully there was training to teach you the specific query languages and expert skills required to answer these questions. After all, you wouldn’t want to blindly dig through 180gb of Logs with 2.5 million entries per day for your 66 Windows servers collecting Application, System, Security, and Audit logs. Are you filtering to the right error and warning levels? Probably not.
The truth is, having a logging tool isn’t the same as knowing how to use it to analyze log data. How can your team effectively manage your log tool if you don’t know how to search and find the right data to analyze?
Where do you start?
If you can’t query your log data, then you won’t be able to drill into your data, analyze it, or pinpoint what’s wrong. It doesn’t stop there. Without taking control of your log data, you won’t be able to create a baseline for log analysis, and you won’t be able to configure your alerting rules or investigate anomalies in your infrastructure.
If you can’t query, you can’t do any troubleshooting, optimization, or performance monitoring. Unfortunately, traditional logging tools require proprietary query knowledge to search and filter log data for effective troubleshooting, delaying identification and resolution of business-critical issues. The art of querying often involves very specific institutional knowledge that’s not easy to share across teams that need to effectively manage the tool.
LM Logs is for everyone
LM Logs includes querying capabilities for ALL experience levels – from simple to advanced to everything in the middle. For users looking to do simple log analysis, querying knowledge isn’t required. For users who want to show off their querying skills, you can dive right in.
Unified logs and metrics within LM Envision connect Opts team to context-rich data to remove the guesswork from troubleshooting. LM Logs empowers Ops teams to start analysis directly from metric performance dashboards. Identify the resource in question, hop over to Logs, and begin to search and filter your data to begin analysis.
From here, options include
- Filtering logs based on the infrastructure resource, time range, or metadata to help identify anomalies
- Searching on keywords (via autocomplete) or using advanced logical search operators (like regex statements) to find relevant data
- Advanced search functionality to control what log data is returned and to modify the results format

Don’t know where to start?
Need help finding specific information or seeing patterns in your logs? Logs solutions can help you get valuable information out of your logs, not add more work to your ITOps team. That’s why LogicMonitor offers autocomplete capabilities based on your log data. You can quickly identify problems and outliers in your environment while spending more time focusing on the task at hand: fixing them.
Autocomplete offers up suggestions based on your IT environment. Just begin typing into the query bar, and the autocomplete menu will open and provide a list of options based on lgo data and the information that you’ve entered. And whether you select a field from the list or directly type in the name, autocomplete will suggest possible values for that same field.
Start by typing an underscore into the query bar. The autocomplete function will display a list of reserved fields, like resource names, resource groups, anomaly type, alert severity, and more. The filtering query can even include values and fields combined with logical operators.
As you enter in more keywords, autocomplete will continue making suggestions to help you drill down into your log data for further analysis. In the example below, LM Logs offered up different types of alert severities, resource groups, and resource names to analyze.


Log-based anomaly detection cuts through the noise
LM Logs anomaly detection is an entirely different approach to diving through your massive amount of log data. Out-of-the-box log-based Anomaly Detection surfaces issues requiring attention and eliminates the need for excessive searches and parsing to get the information you need.
Simply click the ‘view anomalies’ button, and discover unseen behavior within log data right before your eyes – with relevant IT context – so you can find the root cause faster. LM Logs uses proprietary algorithms to analyze log and event data automatically at ingestion. Log events are deemed anomalous if they have not previously shown up on a particular device, system, Kubernetes pod, or cloud instance. This ensures total log visibility and enables teams to proactively manage system health. Alerts can also be configured based on certain event patterns to show how many events happened, when they happened, and why. The log event details are clearly displayed for your analysis.
LM Logs correlates key log events alongside the metric-based alerts and corresponding infrastructure resources for immediate context for active troubleshooting. Follow the log anomalies to investigate what requires more attention, all without a single query.

You can also search by using Keywords. A simple free-text search will only search raw log messages for matches. The Keywords function only searches and displays logs in which the keyword is found in the message field. This is helpful when you want to search all log messages for a particular string or value.
A great way to start is to search for the keyword “Error.” This search would only display log data where the keyword “Error” exists in the message.
Easy to get started, easier to continue
All of your hard work doesn’t go to waste when you identify interesting and relevant log results. At any time, you can view recent searches and even save searches within LM Logs. You can also view and manage recent searches by clicking the clock icon to the left of the query bar. This menu displays the last 10 searches in your history. You can also clear searches from the list or remove certain individuals from it.
Another great feature is the ability to save a log search for future analysis. Save searches by clicking the star icon to the right of the query bar.
Picking up where you left off can help you take control of your log data, and you can build this data into larger LM Envision workflows like creating new log alerting.

Take control of your log data with advanced searches
Logs for everyone also includes more precise ways of narrowing down your log volume for searching. Autocomplete, anomaly detection, and keyword searching are the building blocks to continue your search . Simple operators of “and/or/not” create the beginning of queries; pattern matching helps you search for specific field values; and advanced operators provide full control over your searches.
There are two types of patterns you can search: exact match or fuzzy matches.
Exact matches only return events if the pattern exactly matches the field value. For example, searching “field=exact” would search and only display logs where the field has the value “exact.”
This would be a great search pattern to use when you know the exact value you want to match on, like _resource.name=winserver01. This search would only return logs associated with resource “winserver01” in the logs table.
Perhaps you know what you want to search but need help filtering. The Fuzzy Matching feature returns events using glob expressions that match similar field values. This type of matching is not case sensitive. Use this type of search when you don’t want an exact match; that’s why it’s called a fuzzy match. For example, can you spot the difference? Searching for “_resource.name~winserv01” with fuzzy matching would return logs associated with resources that contain “winserver,” which includes “winserver01,” “winserver02,” etc. Hint: the difference was ~winserver instead of =winserver.

Logical operators for intuitive filters
Another way to search is to add basic logical operations like “and,” “or,” or “not” to filter down your log data. Here are three common examples you can try out within your own environment:
- AND Search for logs containing all of the fields and values specified. _resource.name=winserver01 AND type=winevents. This displays all log data associated with winserver01 and also contains winevents in the type field.
- OR Search for logs containing one or more of the fields and values specified. _resource.group.name=”Linux Servers” OR _resource.name~linux. This displays all logs for resources in the “Linux Servers” Resource Group or any resource that would contain the phrase “linux” in the Resource Name.
- NOT Search for logs except any of the fields or values specified. NOT _resource.name=winserver01 would display all log data from any resource except winserver01.

Need more control over your queries? Try advanced searches
LM logs advanced searches include aggregation, processing, and formatting operators to refine ways to search your log data and modify the results.
After filtering, add advanced search operations to your query. These operations work sequentially based on a set of events, where the result from one operation is baked into the next one. Some operations work on an event at search time (parsing fields), while others require a partial set, known as a limit, or the full set, known as a sort, to yield a result. You can view advanced search results in the Aggregate tab.
Some examples of Aggregates include avg, count, max, min, and sum.
There are endless possibilities for the type of queries you can create with these advanced operators.
Example 1: You can calculate the sum of the size field for each unique resource name and sort the results with the following query:
* | sum(_size) as log_volume by _resource.name | sort by log_volume desc
Example 2: Or write a search that counts the number of events for each unique resource but only limit to 15 results:
* | count by _resource.name | sort by _count desc | limit 15
Example 3: Here is a search to display the resource group names with the count of logs and sum of log size, that is sorted by count of logs, and only limited to 25:
* | count(_size), sum(_size) by resource.group.name | sort by _count desc | limit 25
Example 4: Display the minimum, maximum, and average response times for HTTP requests, broken down by HTTP Response Code

Example 5: Parse out values from the log message using regex and aggregate the results.

You can’t reduce MTTR if you can’t get started analyzing your log data! No matter what your experience level is with searching, writing queries, or parsing log data, it’s time to ditch the frustration that traditional log analysis tools have brought and get on with taking control of your log data.
If your organization is considering or has just started to use a logging tool, you could save hours of time and frustration and reduce MTTR by using LM Logs to surface issues that require attention.
Don’t worry about not knowing what to do next. LM Envision’s unified logs and metrics ensure you always have the means to continue your path to troubleshooting and analyzing. If your Ops team is considering or just getting started with log data, there’s no better time than now.
The Windows Event log is an essential tool for administrators to investigate and diagnose potential system issues, but it can also be a daunting task to gain real value and separate useful log entries from noisy non-essential activity. Depending on the level of logging that can be useful, Windows events can span system issues, application-specific issues, and also dive into security type issues around unauthorized access, login failures, and unusual behavior. Administrators must understand the concept of channels, logging levels, and the lens through which to view the data to make this data useful in day-to-day troubleshooting and root cause analysis.
For today’s discussion, we are going to apply the lens of a Windows system administrator using the Windows Event logs to identify the root cause for system failures, performance issues, configuration issues that lead to outages, or service disruptions.
Noise vs. Value
The comment I hear most often around the subject of noise vs. value is that 99% of logs are never searched or used. I suppose this is mostly true but also reinforced because of how people typically use logs, which is avoiding them until there is a problem or outage and then the logs become a necessary evil. As most logging vendors bill based on ingest, log consumers go to great lengths to filter out the repetitive, audit success events, or even drop all information level logs and only keep warning, critical, and error logs. All of which reduce ingest and cost, but also reduce visibility into the dark spot of configuration changes. Configuration changes have been linked to 40% of all outages in IT today and are mostly written as information level in their various log sources. Windows is no exception, with a great deal of these “noisy” events being written to the information channel (more on channels to come).
One could argue that if you could leverage AI, machine learning, and anomaly detection you could increase the value of 99% of the logs that are never searched until a problem arises. Using anomaly detection to scan configuration change logs or information level logs could show real insight around new behaviors that can be addressed or known about. This could help avoid outages in the first place and also resolve things more quickly when there are service disruptions. If you are only ingesting and holding error, warning, and critical level logs you are missing out on the proactive value that can be gained from the 99%.
Centralize and Aggregate
The first step in any Windows Event management strategy is to centralize and aggregate these logs from across the environment into a single location. While retention times can vary based on use cases, having them central and searchable is key to success.
Windows Events are located locally at each windows server which means there can be a fairly large degree of non-value-added engineering time involved just to get the right server at the right time. Non-value added engineering time is the amount of time a tech or admin will spend connecting to systems, downloading log files, searching, or parsing any tasks required before analysis and triage can be done. There are a variety of means to consolidate but for purposes of our discussion, we will assume that log ingestion means are in place and we can move the conversation into noise vs. value and what kind of logs to consume.
What Are Event Channels?
Channels are essentially buckets that classify event types. Putting them into categories makes them easier to collect, search, and view. Many Windows-based applications are written to be configured to log into one of Microsoft’s pre-defined channels, but we also see applications creating their own channel as well. For purposes of monitoring Windows Event log through the eyes of a system administrator and troubleshooting, the best practice approach is to ingest logs from the application, system, and security channels. However, there could be many additional channels based on the functions and other applications installed on the system. A quick PowerShell command from the administrator PowerShell prompt can show you a quick list of available channels on the system in question.
Enter the following command into PowerShell:
# to see channels listed in the standard order
Get-WinEvent -ListLog *

# to sort more active channels to the top of the list
Get-WinEvent -ListLog * | sort RecordCount -Descending

# to see channels present on a remote computer
Get-WinEvent -ListLog * -ComputerName <hostname>
The output will include a list of channels, along with the number of event records currently in those channels:
LogMode   MaximumSizeInBytes RecordCount LogName
-------   ------------------ ----------- -------
Circular            20971520       59847 Application
Circular            20000000       29339 Microsoft-Windows-Store/Operational
Circular            20971520       21903 Security
Circular             4194304       10098 Microsoft-Windows-GroupPolicy/Operational
Circular             5242880        9568 Microsoft-Windows-StateRepository/Operational
Circular            15728640        7066 Windows PowerShell
Circular             5242880        4644 Microsoft-Windows-AppXDeploymentServer/Operational
Circular             8388608        4114 Microsoft-Windows-SmbClient/Connectivity
Circular             1052672        2843 Microsoft-Windows-EapHost/Operational
Circular             1052672        2496 Microsoft-Client-Licensing-Platform/Admin
Event Types
Now that we’ve defined channels, it’s time to discuss the Event Types that are pre-set by Microsoft and apply them to each channel. Microsoft has categorized the Event Types as Information, Error, Warning, Critical, Security Audit Success, and Security Audit Failure. The first thing of note here is that event types Security Audit Success and Security Audit Failure only apply to the Security Channel and are only present in the Security Channel. Another important item to point out is that not all security events are written into the Security Channel. Security-related events could also be written to the System or Application channel or any of the other function-specific channels that could reside on a system.
Windows Events for Ops vs. SIEM
Traditionally, the SIEM requests any and all logs and log types with the exception of debug level logging. This could work in a perfect world where cost is not a prohibitive factor, but most companies don’t have unlimited funds and they make exclusions. As mentioned above, security-type events can be written across channels. The SIEM typically needs to grab logs from all of these channels, but often times will exclude information level alerts as a cost-savings method.
The typical stance from an operational perspective is that the security channel is often excluded from ingestion. As we’ve mentioned above, information level alerts can be highly valuable to operations staff, especially if the idea of anomaly detection is applied.
Best Practices
While the usual approach outlined above will offer value, LogicMonitor’s best practice approach goes a little further in capturing additional value from these logs. We recommend grabbing any channel, but certainly starting with the application, system, and security channels, even for operations teams. The key channel here is the security channel. It is essential to define the event types we want to ingest and our recommended approach is to accept the information level log events and higher for any channel. This means we want to bring in the following event types: Information, Warning, Error, and Critical events for all channels, including the security channel. Let’s go a little deeper into why we might grab any security events for the operations team and how we can tune out some of the audit success noise.
The security channel is hands down the largest event volume and highest talker. When we investigate further, we know it is overwhelmingly the security audit success event type. Security audit successes are extremely chatty and essentially give us a record of who logged in where/when, what they accessed, and expected behavior. This level of logs may come in handy for a security analytics investigation but is rarely helpful or used in a break/fix type of triage. This leads us to the security audit failure and the other side of the coin. Security audit failures show us failed access, or login failures, and can indicate suspicious activity which could be the first indicators of an attack or hacker activity. Any or all of the above can lead to larger issues affecting both operations and security teams.
One additional thought here to wrap up event types and best practices is debug level logs. Debug level logging could be useful if a specific use case comes up and could be turned on temporarily to assist in the deep dive triage. It should only be used during these ad hoc cases.
Become More Proactive Than Reactive With LM Logs
LogicMonitor’s LM Logs capabilities combined with our best practices approach give customers a winning and sensible approach to aggregate Windows event logs quickly and efficiently into a single, searchable pane of glass. Collect the right level of log to help focus Windows administrators for better MTTR, use root cause analysis during triage of an issue, and use anomaly detection to drive proactive use of the logs to catch unusual behavior or changes that could lead to larger issues down the road. These are just a few features of LM Logs that address some of the Windows Event Log challenges:
- Easy to ingest with LM Logs via WMI using existing LogicMonitor monitoring infrastructure and collectors already in place.
- Combine logs with server metrics for more in-depth views in a single pane of glass.
- Daily, weekly, or monthly anomaly review sessions help gain valuable insight into unusual behavior.
- Intuitive and simple means to define channels using the LM Logs DataSource and applying properties at either the individual server or server group levels.
- Trigger Alerts on specific conditions with keywords, eventIDs, or Regex.
- Use data source properties to quickly filter out repetitive events by EventID, Event Type, or Message String.
Check out our on-demand webinar to learn more about how LM Logs can help your teams decrease troubleshooting, streamline IT workflows, and increase control to reduce risk.