As enterprises scale in complexity, the infrastructure landscape is no longer just cloud or on-premises, it’s both. Hybrid is the new normal and it’s here to stay. And with that shift comes a new demand: a unified, scalable observability solution that works across the entire tech stack, from legacy hardware to cloud-native workloads.
That’s where LogicMonitor comes in. Designed to be cloud-native, but built with today’s hybrid reality in mind, LogicMonitor enables deep observability across public cloud, private cloud, and everything in between.
LogicMonitor is “Deployed on AWS” certified and has achieved the AWS Qualified Software badge. This designation not only reflects our seamless deployment in AWS environments but also enables customers to apply their AWS committed spend toward a unified observability platform, one that delivers actionable insights, performance optimization, and business value at scale.
With LogicMonitor’s AWS Qualified Software badge, enterprises benefit from a platform that meets AWS’s stringent security and compliance standards. Our partnership ensures that your observability and AI operations are protected by enterprise-grade security and governance, including robust identity management, encrypted agent communications, and continuous threat monitoring, ensuring you meet regulatory requirements and mitigate modern AI-driven risks.
And, spoiler alert, there’s more. Building on our deep integration with AWS, we’re proud to share that Edwin AI is now available in the AWS AI Agent Marketplace—advancing our strategic collaboration and reinforcing our commitment to delivering agentic AIOps within AWS-centric environments.
Elevating AI Capabilities with Edwin AI and Amazon Bedrock
Why it matters to you:
LogicMonitor is accelerating the future of AI-powered operations with the integration of Edwin AI, our agentic AIOps product, into Amazon Bedrock. This integration gives our team the flexibility to evaluate and deploy the best AI models for your unique operational challenges, ensuring Edwin AI evolves in step with your needs in a rapidly changing IT landscape.
What this means for your team:
Cut through noise: Reduce alert fatigue by 80–95%, so your teams stay focused on what matters most.
Resolve faster: Shrink Mean Time to Repair (MTTR) by up to 60%.
Operate smarter: Improve operational efficiency by 20%.
See value fast: Deploy in under 24 hours, no training required.
Designed for scalability and speed, Edwin AI– as part of the LogicMonitor Envision platform – and supports 3,000+ technologies, making it a powerful fit for complex hybrid environments. For Managed Service Providers, its built-in multi-tenancy ensures secure, efficient service delivery across customer portfolios.
Unlike traditional AIOps tools, Edwin AI merges agentic AI, generative AI, and machine learning in a single product, offering every team member, regardless of technical depth, access to conversational insights that accelerate decision-making and drive business results.
This integration with Amazon Bedrock reflects not just innovation, but a commitment to responsible, enterprise-grade AI, delivered in alignment with AWS, so you can scale AI with confidence.
With the rise of hybrid IT, visibility challenges have exploded. Multiple monitoring tools often lead to silos, blind spots, and missed SLAs. LogicMonitor solves this by providing a single, unified observability platform, LM Envision that:
Discovers resources automatically with collector-based, zero-touch setup across data centers, cloud regions, and Kubernetes clusters.
Integrates seamlessly with both cloud-native and legacy systems, from EC2 and AWS Lambda to ESXi and Cisco switches.
Visualizes dependencies in real time with topology-aware observability and intelligent alert correlation.
Deploy fast, monitor everything, and operate smarter
LogicMonitor designed LM Envision for scale, performance, and simplicity, no matter where your workloads live.
Monitor consistently across multi-cloud and on-premises environments with cloud-native and cloud-agnostic architecture.
Gain deep visibility into container health and application performance through automatic discovery of Kubernetes clusters and microservices.
Leverage AI-powered intelligence to detect anomalies, anticipate issues, and reduce alert fatigue, enabling teams to focus on what matters most.
A Strategic Fit for AWS-First Enterprises
Now that LogicMonitor is a validated AWS Partner Solution, AWS customers can apply their Enterprise Discount Program (EDP) or committed spend toward LogicMonitor licenses, helping optimize both cost and performance.
Whether you’re migrating to AWS or already running mission-critical workloads in the cloud, LogicMonitor helps you:
Optimize committed AWS spend.
Maintain visibility across your entire technology stack.
Accelerate deployment and insights without adding operational complexity.
One Platform. Total Visibility
Observability shouldn’t stop at the cloud boundary. With LogicMonitor, you can:
Unify monitoring across hybrid and multi-cloud environments with a single, scalable platform.
Leverage hundreds of prebuilt integrations for infrastructure, applications, and services.
Gain real-time visibility and automation through powerful dashboards and AIOps-driven insights.
No more blind spots. No more context switching. Just total control of your environment, wherever it runs.
Optimize your AWS investment with full-stack observability
In today’s hospitals, technology is woven into every touchpoint of patient care. Nurses check vitals through digital monitors. Physicians review test results in the EHR. Medications get ordered, verified, and delivered through a network of connected systems. But when even one link in that chain fails, the impact isn’t just inconvenient—it’s dangerous.
Downtime doesn’t just slow operations. It delays diagnoses, derails treatment plans, and puts both patient trust and clinical safety at risk.
When healthcare IT goes down, it has a profound impact on patient care and your bottom line.
TL;DR
These disruptions cost millions daily, leading to delayed treatments, eroded patient trust, and overwhelmed clinicians.
Current and often fragmented monitoring solutions simply don't offer the complete visibility needed to prevent these big problems.
To truly safeguard patient outcomes, healthcare IT leaders must embrace hybrid observability infused with artificial intelligence.
This enables healthcare IT teams to proactively spot and fix issues, building genuinely resilient digital environments.
The Real Cost: Money and Human Well-being When Healthcare IT Goes Down
When healthcare IT systems fail, the financial impact is significant. A single day of downtime, on average, can cost healthcare organizations around $1.9 million. These costs quickly add up from lost revenue, inefficient operations, and potential fines. What’s more, getting things back up and running often takes over 17 days per incident. However, beyond the financial impact, the human toll is substantial.
Remember the 2024 CrowdStrike update? That global IT disruption caused hospitals worldwide to cancel procedures, delay treatments, and even revert to old paper workflows because critical systems were simply unavailable. In moments like those, routine care gets compromised, putting patient safety and smooth operations at risk.
Additionally, these disruptions erode patient trust. Patients often feel frustrated, anxious, and vulnerable when essential systems fail to function properly, especially when they expect real-time, seamless experiences. Our healthcare professionals also face immense stress, wrestling with manual workarounds and unreliable systems, which can contribute to burnout.
The Limitations of Older IT Approaches
Modern healthcare IT environments are incredibly complex, combining on-premises infrastructure, multiple cloud platforms, medical devices, and edge environments. Keeping a clear view of performance and security across this vast landscape is demanding. Legacy monitoring often falls short in this regard, creating critical “blind spots” that hinder quick resolution and put patient care at risk.
For a deeper dive into why older IT approaches can’t keep pace with today’s demands, we’ve covered it in more detail, including real-world examples like the critical outage affecting an infant protection system, where 25 engineers spent five hours trying to pinpoint a root cause—90% of that time just identifying the issue. During those five hours, the system designed to safeguard newborns from risks like abduction or unauthorized movement was offline, leaving hospital staff without automated safeguards. In a high-stakes environment like neonatal care, every minute without protection adds anxiety and risk. This incident underscores why healthcare IT teams need complete, correlated visibility across infrastructure and clinical systems because when safety systems fail, there’s no room for guesswork.
Building for Today and Tomorrow with Hybrid Observability
Hybrid observability fundamentally changes how healthcare organizations monitor their IT ecosystems. It unifies perspectives across your entire hybrid environment, connecting every part of your healthcare IT regardless of location. This approach bridges data gaps and simplifies complexity by consolidating information from across your data centers, clouds, applications such as Epic, networks, and end-user experiences.
With AI, hybrid observability can proactively identify issues before they impact care by detecting anomalies and providing in-depth system intelligence for clinical workflows. This means better efficiency, enhanced patient safety, dramatically cut troubleshooting times, and improved compliance by streamlining audit preparation and reducing security risks.
Read the full healthcare IT Leader’s guide to see what resilient systems really look like.
From bedside monitors to cloud-based EHRs, every part of the healthcare IT ecosystem plays a role in patient outcomes. When any link breaks, the consequences go far beyond inconvenience—they compromise patient safety, delay treatments, and add pressure to already burdened care teams.
Yes, the financial stakes are high—millions lost per day, thousands per minute—but the clinical stakes are even higher. Every outage is a risk to patient trust, clinician performance, and system-wide safety.
That’s why leading healthcare organizations are shifting from reactive monitoring to proactive observability. They’re breaking down silos, gaining visibility across hybrid environments, and resolving issues before they interrupt care.
The next generation of healthcare won’t just rely on IT. It will rely on resilient, intelligent systems that support clinicians every step of the way.
Because when IT works, care works. And that’s what matters most.
See how LogicMonitor’s hybrid observability solutions can help you transform your healthcare IT operations and deliver better patient outcomes.
Healthcare IT environments have become incredibly complex. Think about everything running simultaneously in your organization: physical medical devices, cloud platforms, clinical applications like Epic, and patient-facing applications. Each component needs to work together seamlessly, much like how ICU monitors track multiple vital signs at once.
Many healthcare organizations still use monitoring solutions designed for simpler times, when systems were more isolated. Unfortunately, these tools often miss critical warning signs and can significantly slow down response times when every second counts.
Hybrid observability brings together visibility across every part of your healthcare IT infrastructure, regardless of where it lives. It provides the comprehensive, real-time insights that healthcare leaders need to maintain resilient, compliant systems that support quality patient care.
Hybrid observability is the new essential for navigating complex healthcare IT.
TL;DR
Traditional monitoring falls short, creating blind spots and hindering quick responses in today's intricate healthcare IT environments.
Hybrid observability provides a unified, comprehensive view across all systems—from medical devices to cloud EHRs across on-premises infrastructure, cloud services, or edge—giving a complete picture of your IT health.
Powered by AI, it proactively detects anomalies and anticipates issues, allowing IT teams to prevent problems before they impact patient care.
Embracing hybrid observability means less downtime, stronger compliance, and empowering your teams to build a truly resilient and innovative healthcare IT future.
Why Healthcare IT Needs Hybrid Observability
Healthcare IT systems require exceptional reliability, yet many organizations still work with fragmented monitoring solutions. This disconnect offers limited views without proper context, making problem identification much harder and extending downtime. This creates real risks for patient safety and regulatory compliance.
Consider this real example: A hospital’s infant protection security system went down. While the infrastructure looked stable on paper, it took 25 engineers and five full hours just to find the root cause. During that time, the hospital’s most vulnerable patients—newborns in the NICU and maternity wards—were left without automated security monitoring that prevents infant abductions and ensures immediate response to medical emergencies. Clinical staff had to perform manual security checks and constant visual monitoring, diverting critical resources from direct patient care and creating dangerous gaps in protection. For five hours, every minute posed potential life-threatening risks to infants who depend on continuous, automated monitoring for their safety and survival.
This is where hybrid observability makes a difference. Unlike traditional monitoring, hybrid observability extends beyond just tracking technology layers. It covers all the distributed environments typical in healthcare IT: on-premises medical devices, cloud-hosted EHRs, network infrastructure, and patient portals across hospitals, clinics, and remote care locations.
Read the full healthcare IT Leader’s guide to see what resilient systems really look like.
Instead of juggling separate data silos, hybrid observability provides one consolidated view. It’s similar to how clinicians integrate multiple diagnostic inputs such as vital signs, lab results, imaging data, patient history, and clinical observations to build a comprehensive clinical picture. Just as no single metric tells the complete story of a patient’s condition, isolated IT monitoring tools can’t reveal the full health of your healthcare technology ecosystem.
For healthcare IT, this translates to:
Complete clinical visibility: A single dashboard that correlates infrastructure health, application performance, and clinical workflows, revealing how issues cascade through your systems.
Early warning and prevention: AI continuously analyzes data from across your healthcare IT ecosystem. It detects unusual patterns specific to healthcare workflows, anticipates potential failures before they affect patient care, and provides actionable recommendations.
Simplified compliance: Continuous, unified monitoring makes it easier to meet HIPAA, HITRUST, and other regulatory requirements.
Reduced alert fatigue: Smart filtering separates truly critical alerts from background noise, helping IT and clinical teams focus on issues that actually impact patient care and staff productivity.
By bringing together alerts and performance metrics from different systems into one dashboard, hybrid observability dramatically reduces investigation time and enables faster, safer problem resolution. Healthcare organizations gain clear insight into how backend infrastructure and network performance directly affect patient care, helping IT teams work more effectively.
How AI Powers Hybrid Observability in Healthcare
Unified visibility across healthcare IT systems significantly improves how we detect and resolve issues. However, the complexity of healthcare IT demands something more: artificial intelligence that can identify and address potential problems before they affect clinical care.
AI strengthens hybrid observability by adding intelligent, automated insights across your entire IT ecosystem.
Anomaly detection: AI continuously examines real-time data streams, quickly spotting unusual patterns in systems like medical device networks or EHR platforms, which helps catch developing issues early.
Dynamic thresholds: Rather than using fixed alerts, AI adjusts thresholds based on actual healthcare workloads, reducing false alarms during predictable usage spikes.
Forecasting and prediction: By analyzing historical data alongside current metrics, AI anticipates potential bottlenecks—like approaching storage limits or network congestion—that could interrupt patient care.
Root cause analysis (RCA): AI automatically connects alerts, logs, and metrics from different IT components, dramatically speeding up the process of finding underlying problems.
Event intelligence: AI groups related alerts into single, actionable insights, reducing alert overload and helping IT teams respond effectively to complex, interconnected issues.
These AI capabilities transform hybrid observability from a reactive monitoring approach into a proactive strategy for healthcare IT resilience. With AI support, teams can address issues before they escalate, maintaining stable, compliant clinical systems optimized for patient care.
Edwin AI takes your healthcare IT data from scattered signals and turns it into proactive insights.
Getting Started with Hybrid Observability in Healthcare
Successful implementation starts with connecting your observability efforts to your healthcare organization’s core priorities: patient safety, system reliability, and regulatory compliance.
Look for a platform that provides:
Unified visibility across on-premises, cloud, and edge environments
Role-based access configured for clinical staff, IT professionals, and leadership
AI-powered analytics explicitly built for healthcare’s unique complexity and regulatory requirements
Work closely with your vendor to ensure:
A smooth, phased rollout that minimizes disruption to clinical and administrative workflows
Thorough training and change management that helps your staff view observability as a strategic advantage, not just another tool
Continuous support and optimization that evolves with your healthcare IT needs
These steps help transform observability from a simple monitoring requirement into a core component of healthcare IT resilience and innovation.
Building a Resilient Healthcare IT Future with Hybrid Observability
Modern healthcare IT goes beyond keeping systems operational. It’s about delivering seamless, secure, patient-centered care within an increasingly complex digital environment. Hybrid observability provides the comprehensive visibility and AI-driven insights necessary to meet this challenge effectively.
By implementing a unified, intelligent observability platform designed for healthcare, IT leaders can minimize downtime, improve compliance, and give their teams the tools to act proactively before small issues become major incidents.
The future of healthcare IT requires resilience, flexibility, and innovation. Hybrid observability powered by AI provides the foundation for achieving all three.
See how LogicMonitor’s hybrid observability solutions can help you transform your healthcare IT operations and deliver better patient outcomes.
Supporting every hospital chart, scan, and bedside alert is a web of digital systems—EHRs, lab interfaces, clinical apps, networks, and connected devices—all working in sync or struggling to. When something slips, say, an Epic interface queue backs up and lab results don’t reach the attending physician on time, the consequences aren’t theoretical. That delay might mean a sepsis alert gets missed. A treatment window closes. A patient’s outcome changes. The impact is immediate, measurable, and personal.
Despite this complexity, many healthcare organizations are still relying on legacy monitoring tools built for a much simpler time.
Today’s healthcare infrastructure spans on-prem, cloud, SaaS, and edge. Legacy tools weren’t built to monitor systems this interconnected.
When visibility fails, care suffers. One hospital spent five hours diagnosing a single infant protection system outage. 90% of that time was spent just finding the issue.
Siloed monitoring delays root cause identification, especially when critical apps like Epic are involved.
CIOs need more than uptime dashboards—they need system-wide observability that connects performance data to clinical impact in real time.
TL;DR
Legacy monitoring is undermining healthcare IT resilience.
Today’s healthcare infrastructure spans on-prem, cloud, SaaS, and edge. Legacy tools weren’t built to monitor systems this interconnected.
When visibility fails, care suffers. One hospital spent five hours diagnosing a single infant protection system outage. 90% of that time was spent just finding the issue.
Siloed monitoring delays root cause identification, especially when critical apps like Epic are involved.
CIOs need more than uptime dashboards—they need system-wide observability that connects performance data to clinical impact in real time.
These environments are distributed, dynamic, and deeply interconnected, making it nearly impossible for siloed monitoring tools to surface root causes fast enough.
When Visibility Fails, Patient Care Suffers
When the tools can’t see the problem, patients feel the impact.
At one U.S. hospital, an infant protection system went offline. While the underlying infrastructure appeared healthy, it still took five hours and 25 engineers to identify the issue. Ninety percent of that time was spent just locating the root cause. During the outage, staff had to rely on manual security protocols to monitor and safeguard infants, increasing the risk of errors such as unauthorized movement or mother-infant mismatches—risks that the infant protection and security system is designed to prevent in this highly sensitive care environment.
90% of a five-hour outage was spent just finding the root cause for 25 engineers working to restore an infant protection monitoring system.
A single day of downtime costs healthcare systems an average of $1.9 million, not including reputational damage and regulatory exposure. Beyond the financial impact, system outages put patients directly at risk, delaying critical treatments, interrupting vital monitoring, or causing medication errors. When patient safety is compromised, clinicians also face serious consequences, including potential liability and threats to their professional licenses. In a healthcare system already stretched thin by staffing shortages, these delays are costly and dangerous.
Healthcare IT is no longer confined to a single data center. It now spans cloud platforms, mobile devices, and edge sensors. Monitoring tools must evolve to provide comprehensive visibility across this hybrid environment.
Dr. John Halamka President, Mayo Clinic Platform
Visibility That Matches the Moment
Healthcare IT leaders are responsible for more than just keeping systems online. They’re leading digital transformation, enabling AI-powered diagnostics, and supporting 24/7 hybrid care delivery.
To do that, they need more than status checks and isolated alerts. They need a unified view that connects infrastructure, applications, and clinical workflows in real time. This means correlating data across networks, cloud services, EHR systems like Epic, and end-user devices, so IT teams can understand how performance issues ripple through complex clinical environments and impact patient care.
Consider an Epic latency issue during morning rounds. Without hybrid observability, IT might see alerts about server load or memory spikes but miss how those translate into delayed physician logins or documentation bottlenecks. Hybrid observability brings all data into a single pane of glass, integrating on-prem and cloud systems, devices, and applications. Advanced AI analyzes this data continuously, detecting anomalies and pinpointing root causes before they escalate. This lets teams resolve issues like backend database bottlenecks, misfiring APIs, or cloud latency fast, avoiding disruptions that could delay care.
That’s the difference between reacting to noise and preventing clinical interruptions altogether.
Read the full healthcare IT Leader’s guide to see what resilient systems really look like.
From Reactive to Ready
Healthcare isn’t slowing down. Workloads are rising, and tech stacks are expanding. Patients accustomed to digital-first experiences expect seamless care, and regulators are watching closely.
Legacy monitoring wasn’t built for this pace. Hybrid observability is.
Forward-looking IT teams are replacing guesswork with real-time insight. They’re preventing care disruptions, protecting sensitive data, and giving clinicians the confidence to trust their tools.
And they’re proving that IT resilience isn’t just about uptime—it’s about protecting patient safety, accelerating time to treatment, and building clinician trust in the systems they use every day.
As AI adoption accelerates across Europe, enterprises need infrastructure that’s powerful, trusted, compliant, and close to home. That’s why LogicMonitor is excited to announce the expansion of our global footprint with a new data center in Frankfurt, Germany – our seventh worldwide. This launch reflects surging demand for LogicMonitor’s AI-powered observability platform, particularly in compliance-driven industries across the EU and DACH region (Germany, Austria, Switzerland). It’s a key milestone in our commitment to helping European businesses monitor, optimize, and scale complex hybrid environments, on your terms.
Serving the Needs of the European Market
Germany enforces some of the strictest data protection and residency requirements in the world, and continues to influence policy across the EU. With this new data center, LogicMonitor shows our ongoing commitment to aligning with key in-country regulations—including the Federal Data Protection Act (BDSG), GDPR, and internal mandates to keep operational data within national borders.
“The new German data center brings us closer to customers and makes it easier for them to adopt LogicMonitor under the compliance frameworks they already trust,” said Matt Tuson, General Manager, EMEA at LogicMonitor. “This investment aligns with data sovereignty expectations, ensuring observability data stays governed by German and EU law. For many organizations, in-country hosting is a prerequisite—not just for compliance, but for vendor selection.”
This launch directly supports LogicMonitor’s existing roster of DACH customers and further benefits sectors across the EU like banking, manufacturing, and the public sector, where infrastructure location is often non-negotiable.
Half of Germany’s top 10 most valuable enterprises—spanning software, insurance, manufacturing, and healthcare—rely on LogicMonitor to power resilient, high-performance IT across complex hybrid environments. With the addition of the German data center, these leading LogicMonitor customers meet compliance requirements while also gaining faster performance, lower latency and more responsive hybrid observability across the region.
Supporting Growth Across DACH and the Greater EU
The DACH region is one of LogicMonitor’s fastest-growing markets, with a customer base that includes industry leaders like Migros, Switzerland’s largest retail enterprise. This new data center removes adoption barriers for companies with strict data residency rules and reinforces our value to compliance-heavy industries.
“We’ve built a strong local presence—including growing our team in Munich—and this expansion continues that momentum. It signals to customers and internal teams alike that we’re investing in long-term success across Europe.” Says Vice President DACH, Oliver Henecka.
As part of our global infrastructure, Frankfurt is now LogicMonitor’s seventh region, contributing to a data residency footprint in six distinct countries: Australia, Germany, Ireland, Singapore, the United Kingdom, and the United States. This network enables customers to maintain local control while benefiting from scalable cloud performance—whether motivated by compliance, risk mitigation, or strategic trust.
As we prepare to onboard customers to the new data center, we’re excited about what this means for our customers: faster performance, stronger compliance, and deeper partnership. Local data hosting in the EU is a strategic priority, and we’re just getting started.
An operations team at one of the Asia-Pacific’s largest managed service providers (MSPs) was drowning in their own success. Years of investment in monitoring tools and automation had created comprehensive visibility—and comprehensive chaos. Engineers opened dashboards each morning to find thousands of alerts waiting, with critical incidents buried somewhere inside.
The scale of the problem was overwhelming their capacity to respond effectively. As the business grew, meeting SLAs became increasingly difficult, and service quality suffered under the weight of alert fatigue.
The MSP needed a fundamental change in approach. That change came in the form of Edwin AI, an AI agent for ITOps. Implementing this AI-powered incident management product achieved measurable results within weeks. Alert noise dropped by 78%, incident volumes decreased dramatically, and the team shifted from reactive firefighting to strategic problem-solving.
Here’s how they transformed their IT operations.
TL;DR
A leading MSP in APAC used LogicMonitor's Edwin AI to reduce noise, streamline triage, and reclaim engineering time.
Their team saw: 78% reduction in alert noise, 70% fewer duplicate tickets in ServiceNow, 67% correlation across systems for faster root cause identification, 85% drop in overall ITSM incident volume.
Engineers shifted from reactive triage to proactive, high-value work.
The Solution: Let Edwin AI Do the Sorting
The MSP implemented Edwin AI, LogicMonitor’s AI agent for ITOps, to process alert streams from their existing observability infrastructure. Edwin AI operates as an intelligence layer between their current tools, ingesting raw alerts from across the technology stack, identifying patterns, eliminating duplicate issues, and surfacing incidents that require human attention.
Instead of engineers manually connecting related events across different systems, Edwin AI performs correlation work automatically and routes consolidated incidents directly into ServiceNow.
The implementation created immediate operational changes:
Alerts from multiple monitoring tools flow into a unified stream
Redundant notifications are grouped together before ticket creation
Related events from different systems are connected to provide complete incident context
Each actionable event arrives in ServiceNow with full background information
Engineers now receive incidents with the context needed to begin troubleshooting immediately. Edwin AI eliminated the need to hunt through multiple systems to understand system failures. By converting fragmented alert streams into structured incident workflows, it allows technical teams to apply their expertise to resolution rather than information gathering.
Edwin AI delivered measurable improvements within weeks of implementation, including:
78% reduction in alert noise. Engineers focus on genuine issues rather than filtering false positives
70% deduplication rate. Repetitive tickets eliminated at the source, reducing confusion in ServiceNow
67% alert correlation across systems. Related incidents linked automatically for complete context
85% drop in ITSM incident volume. Fewer, more meaningful tickets reduce cognitive load on engineering teams
These improvements freed up significant engineering time. The team can now concentrate on high-impact incidents and resolve them more efficiently. With fewer context switches between low-priority alerts, engineers gained capacity for proactive system improvements.
The operational transformation benefited both customers and staff. Service quality improved while engineer burnout decreased. The MSP gained a clearer path toward operational excellence through intelligent incident management.
How to Create a Smarter Workflow, Not Just a Faster One
Edwin AI restructured the MSP’s entire incident management process by converting raw alerts into comprehensive, contextual incidents. Engineers receive complete information packages rather than fragmented data requiring manual assembly.
Each incident now includes:
A clear timeline showing when alerts triggered
Correlated signals demonstrating how issues connect across systems
Guided actions with suggested resolution steps
Engineers work with complete narratives that explain what happened, the business impact, and recommended responses.
ServiceNow evolved from a ticket repository into a comprehensive source of truth. Edwin AI feeds deduplicated and correlated events into the ITSM system, ensuring each ticket contains full context rather than isolated alert fragments.
According to the operations lead: “Edwin AI gives us clarity on what’s actually meaningful. We see the complete picture instead of puzzle pieces.”
This workflow transformation changed how the team approaches incident management, shifting from information gathering to solution implementation.
What’s Next: Building Toward Autonomous Operations
The MSP’s success with Edwin AI has opened the door to even more ambitious operational improvements. With alert noise under control and workflows streamlined, they’re now exploring how AI can move beyond correlation to autonomous decision-making.
Their roadmap includes agentic AIOps capabilities that will surface instant, context-aware answers pulled from telemetry data, runbooks, and historical incidents. Root cause analysis summaries will be delivered directly in collaboration tools like Slack and Teams, accelerating team decision-making. And Edwin’s GenAI Agent will also provide runbook-based recommendations that combine Edwin’s pattern recognition with the MSP’s own operational expertise.
The long-term vision extends beyond faster incident response to fundamentally different operations. Instead of engineers reacting to system events, AI will handle routine remediation while humans focus on complex problem-solving and strategic improvements. This evolution from reactive to proactive to autonomous operations represents the next phase in IT operations maturity.
Their operations lead frames it simply: “We’ve proven AI can sort the signals from the noise. Now we’re working toward AI that can act on those signals automatically.”
AIOps environments have reached a complexity threshold that challenges traditional management approaches. Hybrid architectures, escalating customer demands, and continuous service expectations create operational loads that strain human capacity.
This MSP’s transformation demonstrates a replicable approach: intelligent alert filtering eliminates noise before it reaches human operators, automated correlation and deduplication prevent redundant work, and engineers gain capacity for strategic initiatives that drive business value.
The operational model shift from reactive alert processing to proactive system management addresses the fundamental scalability challenge facing managed service providers today.
According to their operations lead: “Modern ITOps generates a storm of signals no human team can sift alone. AI lets our people do more with less and still raise the bar on service. It turns complexity into a competitive advantage.”
MSPs operating without AI-powered incident management face mounting pressure as alert volumes continue growing while human capacity remains fixed. Organizations implementing intelligent automation now establish operational advantages that become increasingly valuable over time.
For MSPs evaluating their incident management approach, this transformation offers a clear example of how AI can turn operational complexity from a burden into a competitive advantage.
There’s a common misconception in IT operations that mastering DevOps, AIOps, or MLOps means you’re “fully modern.”
But these aren’t checkpoints on a single journey to automation.
DevOps, MLOps, and AIOps solve different problems for different teams—and they operate on different layers of the technology stack. They’re not stages of maturity. They’re parallel areas that sometimes interact, but serve separate needs.
And now, a new frontier is emerging inside IT operations itself: Agentic AIOps.
It’s not another dashboard or a new methodology. It’s a shift from detection to autonomous resolution—freeing teams to move faster, spend less time firefighting, and focus on what actually moves the business forward.
In this article, we’ll break down:
What DevOps, MLOps, AIOps, and agentic AIOps actually mean
How they fit into modern IT (and where they don’t overlap)
Why agentic AIOps marks a transformational leap for IT operations
Let’s start by understanding what each “Ops” term means on its own.
Why “Ops” Matters in IT Today
Modern IT environments are moving targets. More apps. More data. More users. More cloud. And behind it all is a patchwork of specialized teams working to keep everything running smoothly.
Each “Ops” area—DevOps, MLOps, AIOps, and now agentic AIOps—emerged to solve a specific bottleneck in how systems are built, deployed, managed, and scaled and how different technology professionals interact with them.
Notably, they aren’t layers in a single stack. They aren’t milestones on a maturity curve. They are different approaches, designed for different challenges, with different users in mind.
DevOps bridges development and operations to accelerate application delivery.
MLOps operationalizes the machine learning lifecycle at scale.
AIOps brings intelligence into IT incident management and monitoring.
Agentic AIOps pushes operations further—moving from insights to autonomous action.
Understanding what each “Ops” area does—and where they intersect—is essential for anyone running modern IT. Because if you’re managing systems today, odds are you’re already relying on several of them.
And if you’re planning for tomorrow, it’s not about stacking one on top of the other. It’s about weaving them together intelligently, so teams can move faster, solve problems earlier, and spend less time stuck in reactive mode.
DevOps, MLOps, AIOps, and Agentic AIOps: Distinct Terms, Different Challenges
Each “Ops” area emerged independently, to solve different challenges at different layers of the modern IT stack. They’re parallel movements in technology—sometimes overlapping, sometimes interacting, but ultimately distinct in purpose, users, and outcomes.
DevOps is a cultural and technical movement that brings together software development and operations to streamline the process of building, testing, and deploying code. It’s responsible for replacing much of the slow, manual processes involved in automating pipelines for building, testing, and deploying code. Tools like CI/CD, Infrastructure as Code (IaC), and container orchestration became the new standard.
Bringing these functions together led to faster releases, fewer errors, and more reliable deployments.
DevOps is not responsible for running machine learning (ML) workflows or managing IT incidents. Its focus is strictly on delivering application code and infrastructure changes with speed and reliability.
Used by: Software developers, DevOps engineers
Purpose: Automate and accelerate the software delivery pipeline
DevOps automates the build-and-release cycle. It reduces errors, accelerates deployments, and helps teams ship with greater confidence and consistency.
AIOps consumes the telemetry—metrics, events, logs, and traces—that DevOps pipelines generate to power incident detection and analysis.
What is MLOps?
As machine learning moved from research labs into enterprise production, teams needed a better way to manage it at scale. That became MLOps.
MLOps applies DevOps-style automation to machine learning workflows. It standardizes how models are trained, validated, deployed, monitored, and retrained. What used to be a one-off, ad hoc process is now governed, repeatable, and production-ready.
MLOps operates in a specialized world. It’s focused on managing the lifecycle of ML models—not the applications they power, not the infrastructure they run on, and not broader IT operations.
MLOps helps data scientists and ML engineers move faster, but it doesn’t replace or directly extend DevOps or AIOps practices.
Used by: ML engineers, data scientists
Purpose: Automate and govern the ML model lifecycle
Key Tools: MLflow, Kubeflow, TFX, SageMaker
Why MLOps Matters:
MLOps ensures machine learning models stay accurate, stable, and useful over time.
How MLOps Interacts with Other Ops:
Adapts DevOps principles, borrowing ideas like pipeline automation and versioning for model management.
Supports AIOps use cases by providing trained models that can detect patterns, anomalies, and trends across IT environments. MLOps and AIOps can work together, but they solve very different problems for different practitioners.
MLOps is not an extension of DevOps, nor is it a prerequisite for AIOps. It addresses a unique set of needs and typically operates in its own pipeline and toolchain.
What is AIOps?
AIOps brought artificial intelligence directly into IT operations. It refers to software platforms that apply machine learning and analytics to IT operations data to detect anomalies, reduce alert noise, and accelerate root cause analysis. It helps IT teams manage the growing complexity of modern hybrid and cloud-native environments.
It marked a shift from monitoring everything to understanding what matters.
But even the most advanced AIOps platforms often stop short of action. They surface the problem, but someone still needs to decide what to do next. AIOps reduces the workload, but it doesn’t eliminate it.
Used by: IT operations, SREs, NOC teams
Purpose: Improve system reliability and reduce mean time to resolution (MTTR)
AIOps gives IT operations teams a critical edge in managing complexity at scale.
By applying machine learning and advanced analytics to vast streams of telemetry data, it cuts through alert noise, accelerates root cause analysis, and helps teams prioritize what matters most.
How AIOps Interacts with Other Ops:
Ingests telemetry from across the IT environment, including metrics, events, logs, and traces from systems managed by DevOps, but operates independently of DevOps workflows.
May use machine learning models—whether built-in, third-party, or homegrown—to improve anomaly detection and predictions, but does not rely on an internal MLOps process or teams.
What is Agentic AIOps?
Agentic AIOps is the next evolution inside IT operations: moving from insight to action.
These aren’t rule-based scripts or rigid automations. Agentic AIOps uses AI agents that are context-aware, goal-driven, and capable of handling common issues on their own. Think scaling up resources during a traffic spike. Isolating a faulty microservice. Rebalancing workloads to optimize cost.
Agentic AIOps isn’t about replacing IT teams. It’s about removing the repetitive, low-value tasks that drain their time, so they can focus on the work that actually moves the business forward. With Agentic AIOps, teams spend less time reacting and more time architecting, scaling, and innovating. It’s not human vs. machine. It’s humans doing less toil—and more of what they’re uniquely great at.
Used by: IT operations, SREs, NOC teams
Purpose: Close the loop between detection and resolution; enable self-managing systems
Agentic AIOps closes the loop between detection and resolution. It can scale resources during a traffic spike, isolate a failing service, or rebalance workloads to cut cloud costs, all without waiting on human input.
How Agentic AIOps Interacts with Other Ops:
Extends AIOps capabilities, taking incident insights and acting on them autonomously.
Operates on telemetry from across the IT environment, including systems built and managed with DevOps practices.
May incorporate ML models to inform decision-making, whether those models are homegrown, third-party, or built into the platform.
Agentic AIOps is not a convergence of DevOps, MLOps, and AIOps. It is a visionary extension of the AIOps category—focused specifically on automating operational outcomes, not software delivery or ML workflows.
These “Ops” Areas Solve Different Problems—Here’s How They Overlap
Modern IT teams don’t rely on just one “Ops” methodology—and they don’t move through them in a straight line. Each Ops solves a different part of the technology puzzle, for a different set of users, at a different layer of the stack.
DevOps accelerates application delivery.
MLOps manages the machine learning model lifecycle.
AIOps brings intelligence into IT monitoring and incident management.
Agentic AIOps pushes IT operations toward autonomous resolution.
They can overlap. They can support each other. But critically, they remain distinct—operating in parallel, not as steps on a single roadmap.
Here’s how they sometimes interact in a real-world environment:
DevOps and MLOps: Shared ideas, different domains
DevOps builds the foundation for fast, reliable application delivery. MLOps adapts some of those automation principles—like CI/CD pipelines and version control—to streamline the machine learning model lifecycle.
They share concepts, but serve different teams: DevOps for software engineers; MLOps for data scientists and ML engineers.
Example: A fintech company uses DevOps pipelines to deploy new app features daily, while separately running MLOps pipelines to retrain and redeploy their fraud detection models on a weekly cadence.
AIOps: Using telemetry from DevOps-managed environments (and beyond)
AIOps ingests operational telemetry from across the IT environment, including systems managed via DevOps practices. It uses pattern recognition and machine learning (often built-in) to detect anomalies, predict issues, and surface root causes.
AIOps platforms typically include their own analytics engines; they don’t require enterprises to run MLOps internally.
Example: A SaaS provider uses AIOps to monitor cloud infrastructure. It automatically detects service degradations across multiple apps and flags issues for the IT operations team, without depending on MLOps workflows.
Agentic AIOps: Acting on insights
Traditional AIOps highlights issues. Agentic AIOps goes further—deploying AI agents to make real-time decisions and take corrective action automatically. It builds directly on operational insights, not DevOps or MLOps pipelines. Agentic AIOps is about enabling true autonomous response inside IT operations.
Example: A cloud platform experiences a sudden traffic spike. Instead of raising an alert for human review, an AI agent automatically scales up infrastructure, rebalances workloads, and optimizes resource usage—before users notice an issue.
Bottom Line: Understanding the “Ops” Landscape
DevOps, MLOps, AIOps, and Agentic AIOps aren’t milestones along a single maturity curve. They’re distinct problem spaces, developed for distinct challenges, by distinct teams.
In modern IT, success isn’t about graduating from one to the next; it’s about weaving the right approaches together intelligently.
Agentic AIOps is the next frontier specifically within IT operations: closing the loop from detection to real-time resolution with autonomous AI agents, freeing human teams to focus where they drive the most value.
Want to see what agentic AIOps looks like in the real world?
Get a demo of Edwin AI and watch it detect, decide, and resolve—all on its own.
Your systems are getting faster. More complex. More distributed. But your tools are still waiting for something to go wrong before they do anything about it.
That’s the real limitation of most AIOps platforms. They highlight issues. They suggest next steps. But they stop short of action—leaving your team to connect the dots, chase down context, and manually fix what broke.
AI agents detect problems, understand what’s happening, and either fix it—or set the fix in motion. They learn from each incident and carry that knowledge forward. This is infrastructure that can think, respond, and improve in real time.
In this piece, we’ll break down the five core benefit areas of agentic AIOps to show how it helps teams move faster, stay more stable, and scale without the tool sprawl.
Let’s get into it.
TL;DR
Agentic AIOps is a smarter, more scalable way to run IT.
Most AIOps platforms surface problems; agentic AIOps solves them.
AI agents detect, decide, and act autonomously across your stack.
Incidents are resolved faster, with less noise and fewer handoffs.
Reliability improves, scale gets easier, and burnout goes down.
From automation to autonomy
Traditional AIOps helped teams move faster by spotting patterns, detecting anomalies, and speeding up root cause analysis. But under the hood, most of these products still rely on brittle logic—thresholds, static rules, and manual tuning that can’t keep up with constantly changing systems.
When those rules break or environments shift, teams are left scrambling to reconfigure alerts or intervene manually. This all means more noise, slower fixes, and growing maintenance overhead.
Agentic AIOps is a shift from suggestion to action. Instead of surfacing problems and waiting, agentic solutions take the next step: evaluating context, choosing the right response, and executing it autonomously—within the boundaries you set. They learn from every incident and continuously improve.
This doesn’t replace your team; it frees them. No more rule rewrites or repetitive triage. Just faster recovery, smarter operations, and systems that can keep up with change.
Here’s what that enables:
Faster resolution, with agents moving directly from detection to action
Higher uptime, through real-time, policy-driven remediation
Lower maintenance overhead, as systems learn and adapt instead of relying on fixed logic
Scalable operations, without more headcount
Next, we’ll break down why this shift matters and what agentic AIOps unlocks for modern IT teams.
The operational shift agentic AIOps makes possible
IT environments aren’t just growing; they’re accelerating. More data, more tools, more systems, more change. Every new microservice, cloud region, or release cycle adds complexity. And while the stakes rise, the number of skilled people available to manage it all? That’s not scaling at the same rate.
Teams today are navigating:
A constant stream of logs, metrics, traces, and alerts—often across dozens of systems
Hybrid and multi-cloud architectures that introduce visibility gaps and coordination overhead
Faster release cycles that can introduce regressions before anyone notices
Ongoing skills shortages, making it harder to recruit or retain engineers with the right expertise
It’s no wonder that IT operations are harder to manage, harder to scale, and increasingly reactive.
Instead of stopping at insight, agentic AIOps closes the loop—moving from detection to autonomous remediation. These agentic systems understand context, evaluate options, and execute the fix. Automatically. In real time. According to the policies and guardrails you set.
This is the foundation for next-generation, self-healing IT operations:
Systems that detect and resolve issues before they escalate
Workflows that adapt to real-time conditions
Teams that stay focused on strategic work, not endless fire drills
Agentic AIOps gives your IT organization the speed, resilience, and intelligence it needs to keep up with everything else that’s changing.
The benefits of agentic AIOps
Incident response & operational speed
Struggling to keep up with alerts, triage, and resolution? You’re not alone. Today’s IT teams are expected to resolve incidents faster, with fewer people, across more complex environments. Traditional solutions generate mountains of alerts—but leave the interpretation and response to human operators. That slows things down, increases risk, and pulls engineers away from strategic work.
By embedding intelligent agents that can observe, analyze, and act, agentic AIOps shortens every step of the incident lifecycle. Instead of waiting on manual triage, it detects issues early, understands context, and either recommends or initiates resolution—all in real time.
Here’s how that translates into tangible AIOps benefits:
Autonomous incident resolution
Agentic AIOps systems are designed to handle the entire resolution loop: from detection to diagnosis to action.
What it does: Detects anomalies across telemetry, identifies likely root causes using pattern recognition and statistical modeling, and triggers pre-approved remediation workflows.
What it replaces: Manual alert triage, root cause guessing, slow escalation chains.
The benefit: Dramatically reduced MTTR (mean time to resolution) with fewer incidents escalating to critical levels.
Accelerated root cause analysis
Even when teams know something is wrong, finding why can take hours.
What it does: Correlates logs, metrics, traces, and topology to identify the most probable root cause. Uses machine learning to filter irrelevant signals and highlight meaningful patterns.
What it replaces: Hours of log sifting, guesswork across systems, siloed team investigations.
The benefit: Speeds up decision-making and gives teams confidence in the fix.
Smarter triage, less escalation
.Legacy monitoring solutions flood teams with alerts—many of them false positives or duplicates.
What it does: Uses correlation and enrichment to group related alerts into meaningful incidents. Applies thresholds, context, and past behavior to assess urgency and impact.
What it replaces: Alert storms, endless queue triage, and noisy dashboards.
The benefit: Less burnout, more focused response, and fewer unnecessary escalations.
Consistent, repeatable incident handling
IT operations often depend on tribal knowledge—what worked last time, and who remembers how it was fixed.
What it does: Captures incident context, resolution steps, and outcomes. Reuses past remediations in future scenarios through similarity detection and recommendation models.
What it replaces: Inconsistent fixes, repeated investigations, and fragmented institutional knowledge.
The benefit: Standardized response quality, faster fixes, and better handoffs between shifts or teams.
Uptime & service reliability
When performance drops, so does trust. Today’s users expect applications and digital services to “just work”—with speed, stability, and no surprises. But maintaining reliability in dynamic, multi-cloud environments is no small task. With constant releases, shifting dependencies, and distributed infrastructure, even small misconfigurations can lead to major disruptions.
Agentic AIOps helps you stay ahead of failure—not just respond to it. By continuously monitoring system health, identifying risks, and taking autonomous action, agentic AIOps prevents downtime and safeguards user experience at scale.
Here are three agentic AIOps benefits that directly improve uptime and reliability:
Maintains service reliability in dynamic environments
Modern IT ecosystems are constantly changing—new code, new workloads, new traffic patterns. Static monitoring can’t keep up.
What it does: Continuously observes infrastructure and application health across cloud, hybrid, and on-prem environments. Detects performance anomalies, capacity risks, and misaligned thresholds in real time.
What it replaces: Reactive incident response, slow manual correlation, guesswork in complex environments.
The benefit: Prevents service degradation before users feel it. Keeps critical applications running smoothly—even during change.
Curious how ITOps teams are shifting from reactive to predictive?
Download our white paper, AIOps Evolved: How Agentic AIOps Transforms IT, and discover how a modular, AI-driven approach can future-proof your operations.
Many high-impact outages start small—subtle memory leaks, creeping latency, or misconfigurations that build up over time.
What it does: Applies predictive models to detect early indicators of risk—like resource contention, config drift, or outdated dependencies. Suggests or initiates mitigation based on severity and business impact.
What it replaces: Periodic health checks, reliance on human intuition, incident-prone firefighting.
The benefit: Reduces the likelihood of failure by handling root causes early, not just the symptoms.
Early detection of systemic issues
Some problems don’t show up in a single alert—they show up in patterns over weeks or months.
What it does: Analyzes historical telemetry to surface recurring issues tied to specific services, regions, workloads, or infrastructure components. Flags architectural weaknesses, aging infrastructure, and chronic bottlenecks.
What it replaces: Disconnected root cause investigations, blind spots in trend analysis, teams chasing symptoms instead of sources.
The benefit: Enables long-term reliability planning and targeted investment in infrastructure improvements.
Scale, consistency & knowledge
More complexity doesn’t have to mean more people. As IT environments scale, so do expectations—faster resolution, better uptime, deeper visibility. Growing your infrastructure shouldn’t mean growing your team at the same rate. The real challenge is scaling operations without sacrificing consistency, accountability, or knowledge retention.
By using intelligent agents that learn from context, follow policy-aligned workflows, and capture operational knowledge, agentic AIOps becomes a force multiplier.
Here’s how agentic AIOps helps teams scale smarter and operate more consistently:
Scalability without adding headcount
Hiring another engineer isn’t always an option; agentic systems can help.
What it does: Deploys specialized agents to handle detection, triage, documentation, and even resolution tasks autonomously. Expands capacity without manual intervention.
What it replaces: Reliance on overworked teams, constant escalations, and late-night fire drills.
The benefit: Grows your operational coverage without growing your payroll—critical for managing hybrid, containerized, or multicloud environments.
Operational consistency across teams.
Different teams. Different time zones. Different response styles. Consistency isn’t just about process; it’s about trust in outcomes. Agentic AIOps delivers both.
What it does: Standardizes incident response based on defined policies and playbooks. Applies the same logic to similar problems, regardless of who’s on shift or which team is involved.
What it replaces: Ad hoc fixes, inconsistent handoffs, and tribal knowledge silos.
The benefit: Ensures that every incident—whether critical or routine—is handled the same way: fast, accurate, and aligned with business priorities.
Embedded operational memory
When knowledge walks out the door, performance suffers.
What it does: Captures context around incidents—what happened, how it was resolved, and why it mattered. Organizes this information into usable records for future reference.
What it replaces: Forgotten resolutions, undocumented workarounds, and repeated guesswork.
The benefit: Makes your operation smarter over time, preserving insights even as teams shift or grow.
Simple postmortems and documentation
Documenting after the fact is often the first thing to fall through the cracks.
What it does: Automatically generates structured incident summaries, including root cause, remediation, impact, and timelines. Pushes records to ITSM systems or internal knowledge bases.
What it replaces: Manual postmortems, missing audit trails, and fragmented documentation.
The benefit: Ensures clean, consistent records are created every time—without slowing down engineers.
Faster onboarding for new engineers
Training new team members takes time—and access to the right information.
What it does: Makes past incidents searchable, context-rich, and easy to understand. Exposes resolution patterns and best practices through summaries and AI tagging.
What it replaces: Over-reliance on peer shadowing, lengthy documentation hunts, or “ask the senior engineer” workflows.
The benefit: Reduces ramp-up time and helps new hires contribute faster with less friction.
Cost, efficiency & strategy
IT budgets are under pressure—but expectations keep rising. Teams are being asked to do more with less: manage larger environments, respond faster to incidents, and support modernization—all without inflating headcount or costs.
Here’s how agentic AIOps helps reduce costs, increase efficiency, and drive ITOps strategy forward:
Cost optimization at scale
Cloud spend, licensing, and staffing costs can spiral fast—especially in dynamic environments.
What it does: Continuously monitors infrastructure usage and dynamically adjusts capacity to meet demand. Supports auto-scaling, rightsizing, and workload optimization across cloud and on-prem environments.
What it replaces: Manual resource provisioning, static thresholds, and overprovisioned environments “just in case.”
The benefit: Reduces total cost of ownership (TCO) by eliminating waste and optimizing compute spend in real time.
Sustainability gains
Efficiency is about more than dollars; it’s also about your footprint.
What it does: Improves environmental sustainability by minimizing idle resources, reducing unnecessary compute cycles, and aligning workloads with real-world demand.
What it replaces: Overbuilt systems, always-on capacity buffers, and wasteful infrastructure sprawl.
The benefit: Reduces energy usage and emissions while still meeting performance needs—supporting ESG goals without tradeoffs.
Foundation for fully autonomous IT
Agentic AIOps is a stepping stone to an entirely new operational model.
What it does: Introduces modular agents that work independently and in coordination to detect, decide, and act. Establishes a framework for future growth into more autonomous, self-managing systems.
What it replaces: Script-based automation and rigid workflows that can’t adapt to changing environments.
The benefit: Builds long-term agility into your tech stack—reducing manual toil today and laying the groundwork for AI-driven operations tomorrow.
Accelerated digital transformation
Automation without strategy is just efficiency.
What it does: Frees up engineering and operations teams from repetitive tasks, enabling them to focus on projects that drive competitive advantage—like cloud migration, DevOps maturity, or customer experience initiatives.
What it replaces: Time lost to alert triage, incident firefighting, and manual ticketing workflows.
The benefit: Moves IT from reactive support to proactive enabler—faster innovation, stronger alignment with business goals, and greater speed to market.
Want the data behind the transformation?
Download the EMA report, Unleashing AI-Driven IT Operations, to see how 500+ IT leaders are using AI to accelerate innovation, cut response times, and drive real ROI.
Security threats don’t wait for tickets to be triaged. As infrastructure grows more distributed and dynamic, so do the attack surfaces. At the same time, compliance requirements, incident response times, and audit expectations are tightening. IT teams are caught between the need for speed and the need for control.
By enabling intelligent, real-time response—backed by transparent decision logic and human-defined guardrails—agentic AIOps improves security readiness without sacrificing governance.
Here’s how agentic AIOps supports a more secure, more accountable IT operation:
Enhanced security response
Modern security incidents evolve quickly. Waiting for manual intervention can cost time, data, and customer trust.
What it does: Continuously monitors telemetry for suspicious patterns across infrastructure, applications, and services. When threats are detected, it can automatically isolate compromised resources, trigger containment workflows, or initiate alerts to SOC teams.
What it replaces: Delayed responses, manual incident routing, and missed escalation windows.
The benefit: Reduces mean time to detect (MTTD) and mean time to respond (MTTR) for security events—helping teams act before damage spreads.
Human-AI collaboration with guardrails
Autonomy doesn’t mean letting go of control. In regulated and high-risk environments, responsible automation is non-negotiable.
What it does: Allows teams to define policy-based guardrails, escalation paths, and approval flows. AI agents operate within these constraints—taking action where it’s safe, escalating when it’s not.
What it replaces: All-or-nothing automation models that force a choice between speed and safety.
The benefit: Enables phased adoption of autonomous workflows, with visibility into every decision—so teams can trust the system and keep control.
What you need to get agentic AIOps right
Agentic AIOps can transform how IT operations function—but it’s not plug-and-play. To get real value, teams need the right foundation: clean data, defined oversight, and the internal alignment to support responsible autonomy.
First, data quality is non-negotiable. Agentic systems rely on complete, accurate, and timely telemetry—from logs and metrics to traces and event metadata. Without comprehensive observability pipelines in place, AI agents can’t make context-aware decisions, and automation risks becoming noise instead of value.
Next, autonomy still needs oversight. AI agents should operate within clearly defined boundaries, guided by policies that reflect your organization’s tolerance for automation. Teams must define goals, escalation paths, and fail-safes before agents are allowed to take action.
As automation expands, so does the need for governance. Every decision—whether executed or just suggested—should be traceable, auditable, and explainable. This transparency builds trust, supports compliance, and ensures your automation layer remains aligned with broader business objectives.
Finally, your team needs to grow with the system. Agentic AIOps shifts operations from manual response to strategic supervision. That means reskilling teams to configure, monitor, and fine-tune automated workflows—not just react to them. Upskilling isn’t a nice-to-have—it’s what ensures the tech actually gets used.
To recap, here’s what’s essential:
Accurate, real-time observability data across your full stack
Clear policy definitions for agent behavior and escalation
Governance frameworks for auditing, transparency, and control
Training and enablement to help teams lead, not just follow
Agentic AIOps is about giving your people more leverage. With the right foundations in place, teams can trust AI to take on the repetitive work, while they stay focused on what truly moves the business forward.
The benefits of getting agentic AIOps right: Smarter systems, stronger teams
Today’s IT tools are still stuck reacting—surfacing alerts, surfacing insights. Agentic AIOps changes that by closing the loop between detection and resolution, turning noisy signals into automated action.
This is about fundamentally redesigning how IT operates:
From reactive to proactive
From manual intervention to reasonable autonomy
From brittle workflows to systems that adapt and improve over time
For teams under pressure to do more with less, agentic AIOps offers a path forward. But like any shift, it takes intent. Clean data. Clear policies. And teams ready to lead with oversight—not be buried in alert fatigue.
The promise of agentic AI is operations that can finally keep up with everything else that’s accelerating around them.
On May 1st, AWS corrected a long-standing billing bug tied to Elastic Load Balancer (ELB)data transfers betweenAvailability Zones (AZs) and regions. That fix triggered a noticeable increase in charges for many users, especially for those with high traffic volumes or distributed architectures. The problem wasn’t new usage; it was a silent correction to an old error.
What Actually Changed
ELBs are designed to distribute traffic across multiple AZs for high availability. For some time, AWS had been under-billing for data transfers across those zones due to a backend miscalculation. Once AWS patched the issue, affected traffic was billed at standard rates.
Here’s what teams started to notice:
A spike in cross-AZ data transfer costs
Sudden increases in ELB charges, even without changes in usage patterns
No official notice from AWS and no retroactive billing adjustments
Without active monitoring, these increases could’ve gone undetected until the invoice hit.
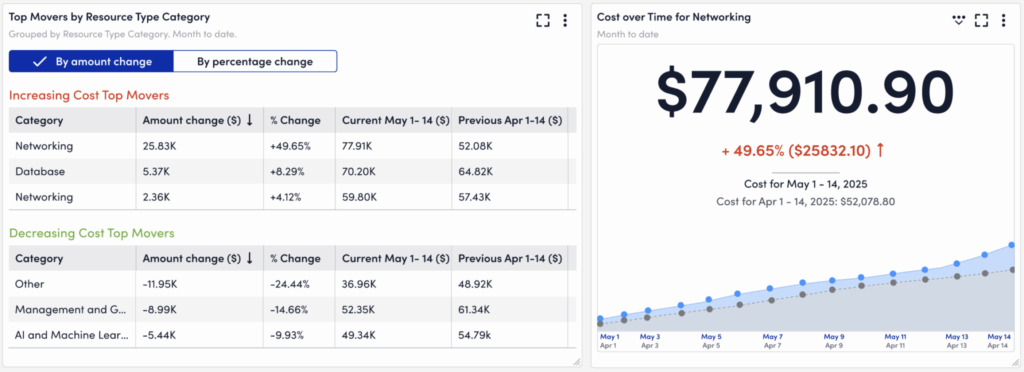
LogicMonitor’s Cost Optimization dashboard shows a 49.65% jump in networking spend from May 1–14, 2025—an increase (due to AWS’s silent ELB billing fix) of $25.8K compared to early April.
Customers Using LogicMonitor’s Cost Optimization Could See It First
Organizations using LogicMonitor’s Cost Optimization product quickly saw the impact through the billing widget, which provides real-time visibility into cloud spend across AWS, Azure, and GCP. On May 1st, ELB costs jumped, and LM Envision’s Cost Optimization dashboard in various customer instances could spot the change.
Cost Optimization began showing noticeable increases. In several cases, including in our own LogicMonitor instance, customers reported sudden spikes in previously stable ELB charges, often tied directly to cross-AZ traffic.
This scenario was exactly the kind of scenario the LM Envision platform, paired with Cost Optimization, was designed to catch.
By surfacing changes in real time, whether caused by usage changes, misconfigurations, or (as in this case) vendor-side billing updates, LM Envision gives teams the chance to react before surprises escalate into budget risks..
Why It Matters
In an age of dynamic cloud pricing, unexpected billing changes can derail budgets and force last-minute cost corrections. Even minor billing corrections—like this ELB update—can have ripple effects across environments with high traffic or multi-region architectures.
LogicMonitor helps ITOps teams with FinOps responsibilities:
Stay aheadof spend with granular cost visibility
Detect cost anomalies tied to specific services or regions
Alert teams when budgets are at risk of being breached
Enable IT operations teams to act fast and avoid surprises
What You Can Do Now
If you’ve seen a sudden spike in your ELB charges this month, take a closer look at:
Your data transfer patterns across AZs or regions
Load balancer configuration and routing behavior
Any alerts or anomalies surfaced by your observability platform
And if you’re not yet using LogicMonitor to monitor cloud costs and resource changes, now’s the time to see what unified observability can help unlock. When every cloud dollar counts, you need more than reports. You need real-time insight.
See what LM Cost Optimization can do in your environment.
When an alert fires, your goal is clear: fix the problem—fast. But traditional troubleshooting rarely makes that easy. You’re immediately thrown into decision mode:
Do I remote into the device? Reboot it? Restart services?
Do I even have access?
Are logs available in a tool or buried on the system?
Do I know the query language?
Do I log a ticket for another team to step in?
All the while, the clock is ticking. The longer you’re stuck guessing what to do next, the longer your downtime drags on, and the more non-value-added engineering time you burn.
LogicMonitor Logs changes this by automatically correlating your logs with the exact metrics, resources, and alerts that triggered the issue, so you’re not starting from scratch.
You’ll see the logs in context, right where the problem occurred, alongside performance trends and system behavior.
And instead of wading through noise, LM Logs surfaces what stands out: rare anomalies, sudden spikes, and machine-learned patterns that haven’t been seen before. It’s observability with built-in intelligence designed to show you why something happened, not just that it did.
Once you’ve got the right data in front of you, the next step is knowing what to do with it.
Let’s walk through a structured workflow designed to accelerate troubleshooting and improve Mean Time to Resolution (MTTR).
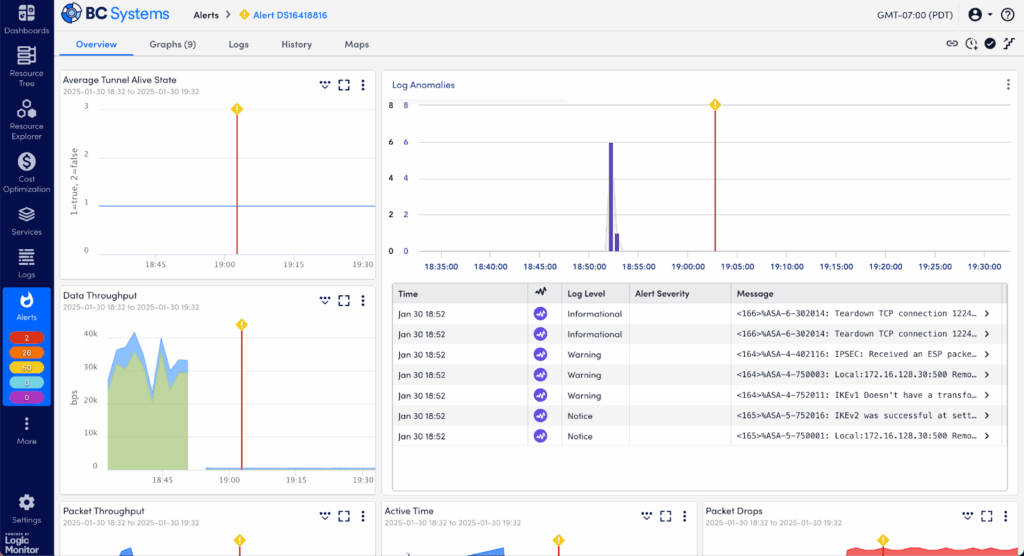
Step 1: Quickly Access the Situation in the Overview Tab
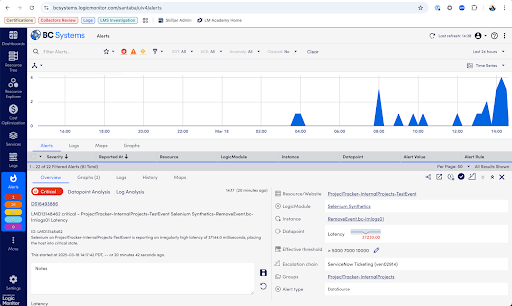
When an alert fires, your first task is to gather context fast. Start at the Overview tab in LogicMonitor to immediately grasp the key facts about what happened:
Alert Summary: See exactly which resource triggered the alert, what metric crossed the threshold, and the severity (Warning, Error, Critical).
Triggered Time: Note precisely when the issue started—critical for correlation with system changes or deployments.
Current Status: Confirm quickly whether the issue is active, acknowledged by your team, or already cleared.
Affected Resource: Identify immediately the specific device, service, or instance causing trouble.
Thresholds & Values: Clearly view the actual values that exceeded normal limits to pinpoint the immediate problem.
Escalation Chain & Notifications: Verify who’s aware of the issue, what’s already been done, and what escalation procedures are in place.
Recent Alert History: Quickly spot recurring patterns or previous occurrences to understand the broader context of the issue.
Overview tab showing critical alert details and initial context.
This overview equips you quickly with critical details, guiding your next troubleshooting steps.
Step 2: Explore Performance Trends and Metrics in the Graphs Tab
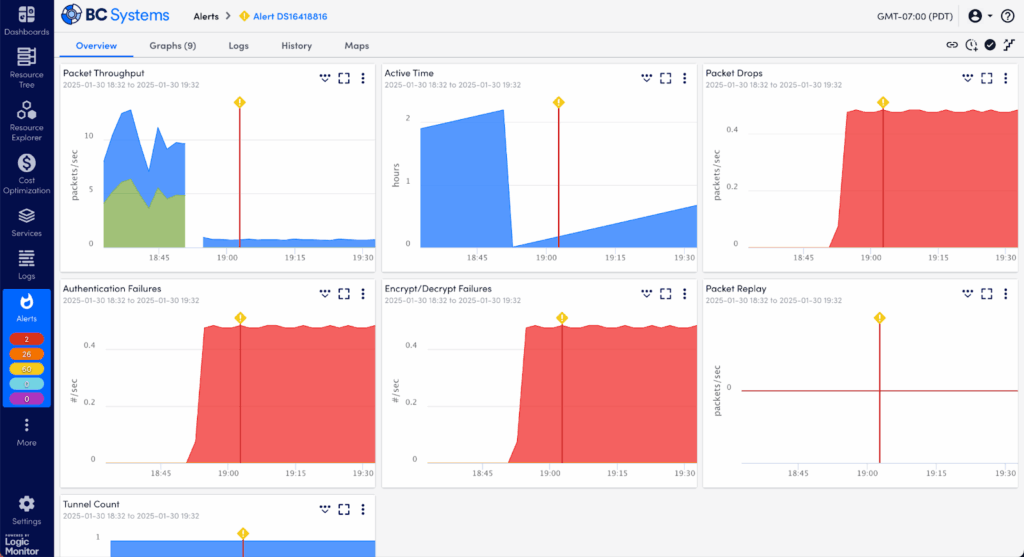
Now it’s time to dig deeper into how this alert fits into your performance history. Use the Graphs tab to visualize what’s going on:
Time-Series Graphs: Check performance over time around the moment the alert was triggered. Was this a sudden spike or a gradual build-up?
Threshold Indicators: Clearly see exactly where and when the thresholds were crossed, providing clarity around the event timeline.
Zoom & Time Range Controls: Expand or narrow your time window to better spot trends or critical moments.
Multiple Metric Overlays: Add related metrics to your graph view to see if there’s a correlated impact or cascading failure.
Comparisons to Normal Behavior: Quickly determine if what you’re seeing is a unique event or part of an ongoing trend or pattern.
Graphs tab displaying performance trends and threshold breaches clearly.
Graphs give visual context but may not fully explain why something occurred—that’s our next step.
Step 3: Identify Log Anomalies in the Graphs Tab – Log Anomalies Section
Logs often hold the clues to what metrics alone can’t reveal. Scroll to the Log Anomalies section at the bottom of the Graphs tab to investigate further:
Purple Anomaly Columns: These visually highlight logs that LogicMonitor’s AI flags as unusual—events that the system hasn’t typically seen.
Note the precise timing of these log spikes relative to your alert—do they align closely with the issue?
Log anomalies clearly identified by purple spikes in log activity.
Log anomalies frequently uncover hidden or less obvious causes of performance problems, helping you narrow down quickly.
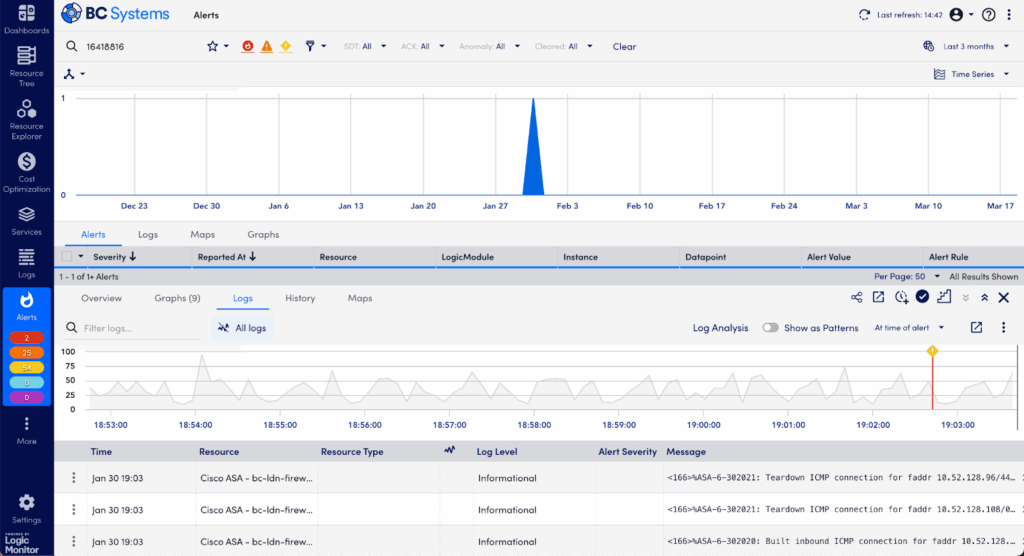
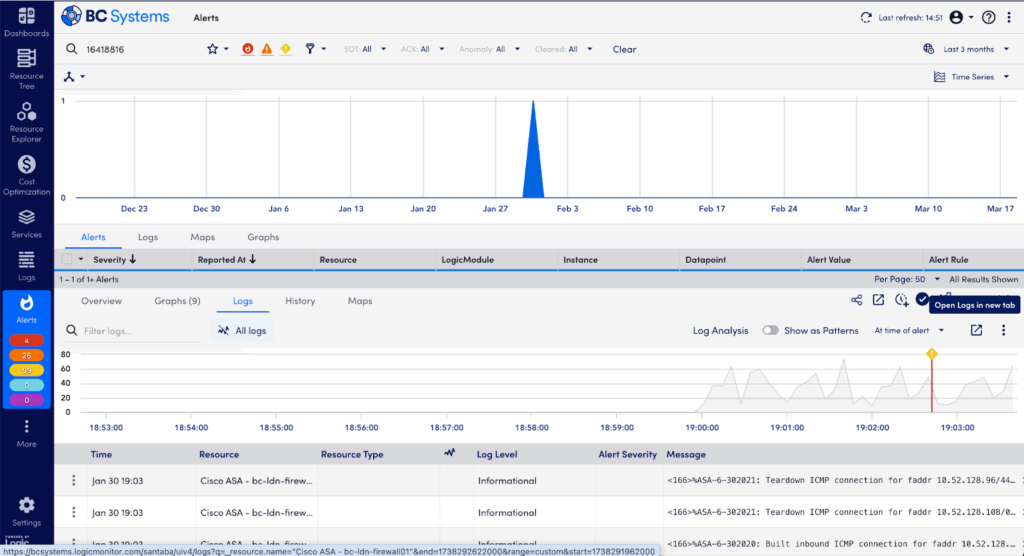
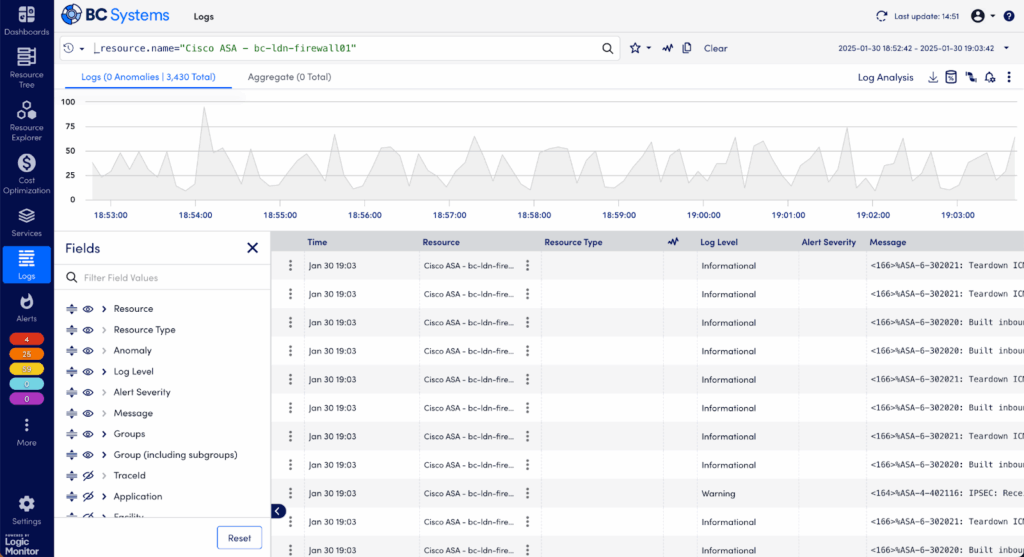
Step 4: Deep-Dive into Raw Logs in the Logs Tab
If anomalies are intriguing but you still need more details, dive into the full log data:
Switch to the Logs tab and change the view from “Log Anomalies” to “All Logs.”
Confirm you’re viewing logs within the exact timeframe of your alert.
Use search and filtering options to sift through logs by keywords, severity (error, critical, warning), or timestamp to surface relevant entries quickly.
Detailed raw log entries aligned with the alert timeframe.
Raw logs often contain detailed error messages, stack traces, or specific configuration warnings that give clear indicators of the root cause.
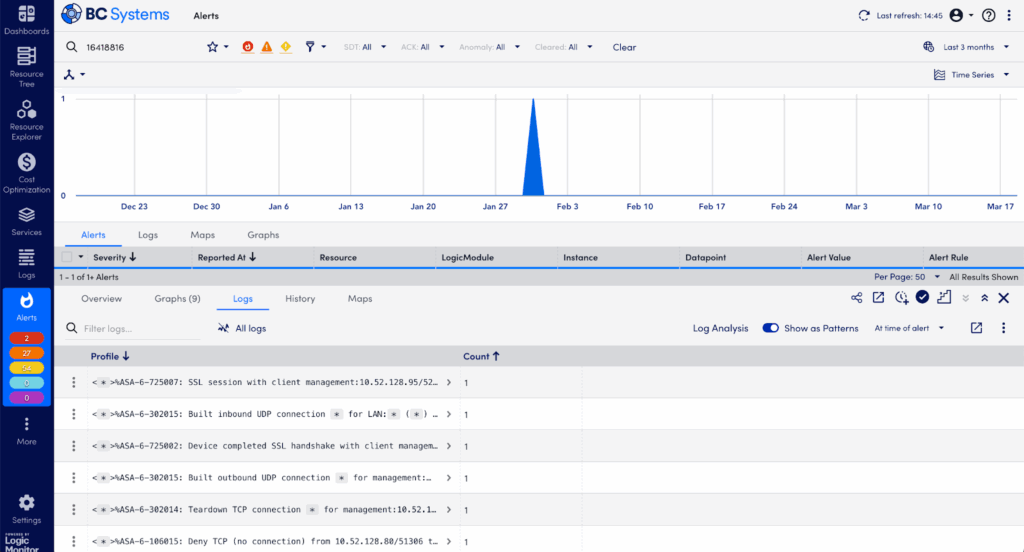
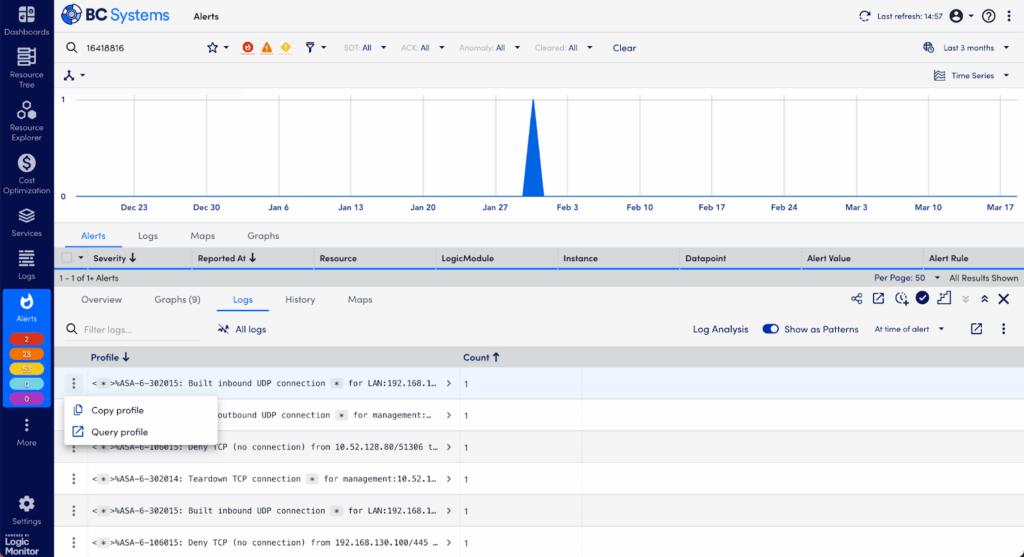
Step 5: Simplify Log Investigation with Log Patterns in the Logs Tab – Patterns View
Too many logs to read? LogicMonitor Envision helps by identifying recurring patterns automatically:
Toggle “Show as Patterns” to group similar logs together—significantly simplifying the data.
Sort patterns by lowest frequency—rare patterns often signal unique or highly specific issues. (Conversely, frequent logs often represent background “noise.”)
Identify unusual log patterns or messages that occurred near the alert time, pointing you closer to root-cause identification.
Log Patterns simplifying thousands of logs into meaningful groups.
Using patterns efficiently cuts through noisy logs, quickly revealing meaningful insights.
Step 6: Deepen Your Insight with Automated Log Analysis
If you still need more clarity, LM Logs’ Log Analysis feature surfaces critical log insights instantly, without complex queries or deep log expertise:
Click into Log Analysis within LM Logs to trigger automatic, AI-driven analysis.
Review logs automatically ranked by “Sentiment Scores,” which quickly identifies logs most likely causing or related to your problem.
Easily drill down into these high-sentiment logs, revealing clear, actionable insights without extensive manual effort.
Log Analysis transforms traditional troubleshooting, eliminating guesswork and significantly speeding issue identification.
Step 7: If Necessary, Extend Your Investigation
Sometimes your issue may need a deeper investigation across broader logs or historical data:
Click “Open Logs in new tab” directly from your current view. LM Logs automatically retains your alert’s timeframe and resource context—no wasted time re-entering filters.
Refine your search further with additional keywords, syntax, or extended date ranges for a more comprehensive analysis.
Save helpful queries for faster troubleshooting next time this issue appears.
Troubleshooting with LM Logs: Reduce MTTR From Hours to Minutes
LogicMonitor’s structured workflow takes you far beyond traditional monitoring, enabling rapid, proactive troubleshooting. By seamlessly combining metrics, events, logs, and traces, LM Logs not only accelerates your response time but also gives your team the ability to understand why problems occur, so you can prevent them altogether.
Embrace this structured approach, and you’ll significantly cut downtime, enhance reliability, and confidently manage your complex environments with greater ease and precision.
Discover more capabilities to make your observability journey a successful one.