LogicMonitor is using outlier detection with research to determine a service's overall balance, providing additional metrics to find discrepancies in node utilization over time. See how!
LogicMonitor currently provides a solution for monitoring groups of nodes with the same functionality, which we call services. With companies moving towards more auto-scalable and transient architecture, LogicMonitor is able to continually monitor these services, which are always changing. We also needed a way of determining if these nodes are being used effectively. It can become an unnecessary cost if there are multiple underutilized nodes. So we decided to take a look at a statistical solution for determining how well a service’s nodes are being used. This led to looking into using outlier detection as well as research into ways of determining a service’s overall balance thus allowing LogicMonitor to provide additional metrics that can be utilized alongside anomaly detection to find discrepancies in node utilization over time.
Outliers are defined as data points that are significantly different from other points in a dataset. Usually, outliers determine some kind of anomaly or error in a group of collected data. Outliers usually cause issues with statistical analysis leading to false conclusions especially when a calculation depends on the data’s mean or standard deviation. Usually detecting an outlier is done using the Tukey’s Fences method where any values that exceed the calculated upper and lower bounds are considered outliers. Most people see these examples visualized using a box plot showing the three quartiles and the upper and lower limits.
What Is an Unbalanced Service?
An unbalanced service refers to a group of instances that on some metric are not being utilized evenly. With the increased usage of microservice architecture, there is a need to make sure that every resource is being used efficiently and effectively. Otherwise, money is being wasted and there was no need to expand horizontally in the first place. In load balancing, usually, a round-robin strategy is taken but there can be a case where a node may be getting the smaller tasks while another is receiving larger, more complex requests. This is where we would need to see unbalanced metrics so that there is insight into these issues.
Why Use Unbalanced Service Detection Over Outlier Detection for Aggregated Metrics?
Using outlier detection to find irregular nodes while relying on aggregated metric collection can show promise depending on the user’s needs. In metrics, such as request count and HTTPS calls, there are opportunities to see larger differences in data points that in cases where other nodes are not being used or some are being overused, we would see these differences as outliers. As for other cases (CPU, memory, other percentile measurements), it is very difficult to calculate an outlier due to the set bounds for percentages (0-100). This is where an unbalance detection algorithm would be much more effective.
An Example of How Outlier Detection Does Not Work
If you have ten services with nine having 10% CPU utilization and one having 90%, here we have an outlier but let us say if we have five nodes with 90% and the five have 10%. In this case, the nodes certainly are not being used efficiently all around but if we relied on outlier detection there wouldn’t be any indication of an issue. Another difficulty with using outlier detection is that it requires both a larger dataset and must contain some extreme value(s) while statistically determining an unbalance can be used on any amount of nodes and the smallest differences are found.
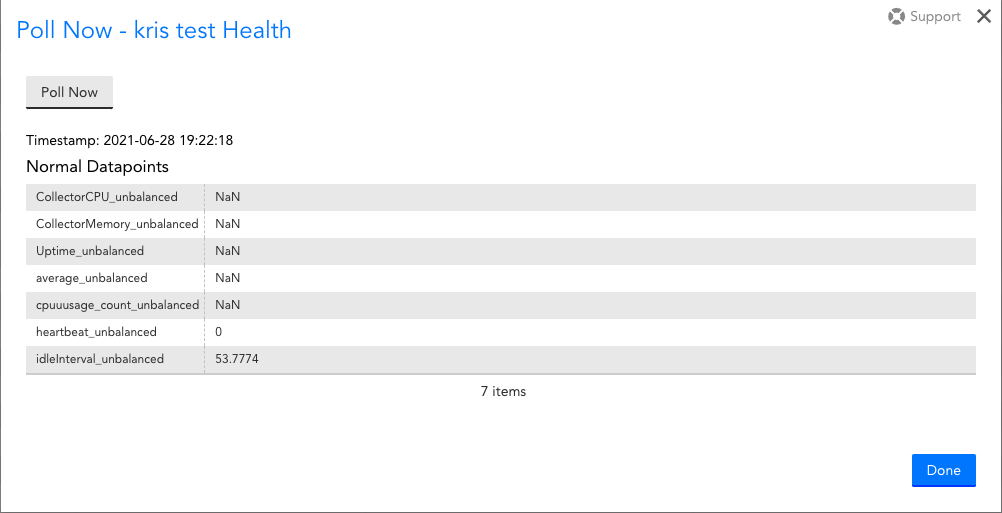
How To Use Anomaly Detection for an Unbalanced Service
Figure 1: Adding the unbalanced aggregation to your service.
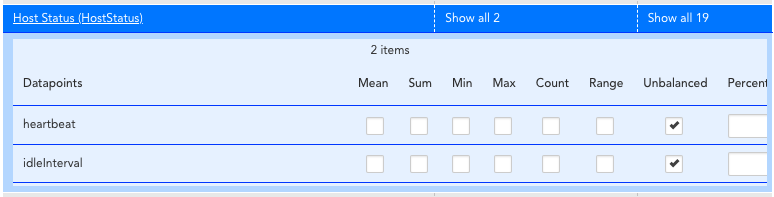
Figure 2: Reviewing the data points for the new unbalanced aggregation function.
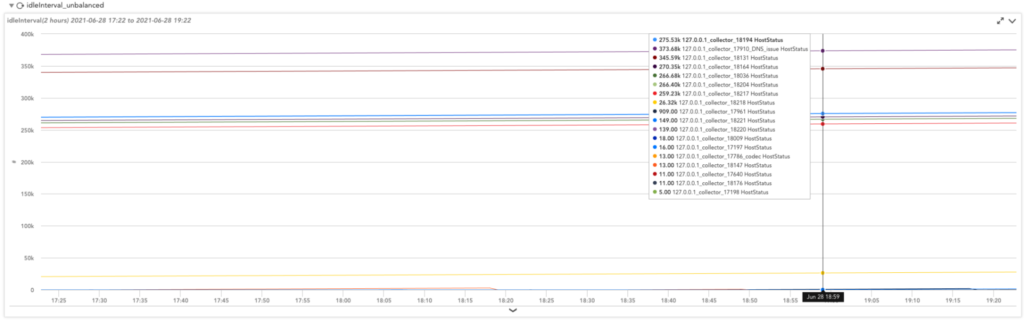
Figure 3: Showing related data points for each instance within the service.
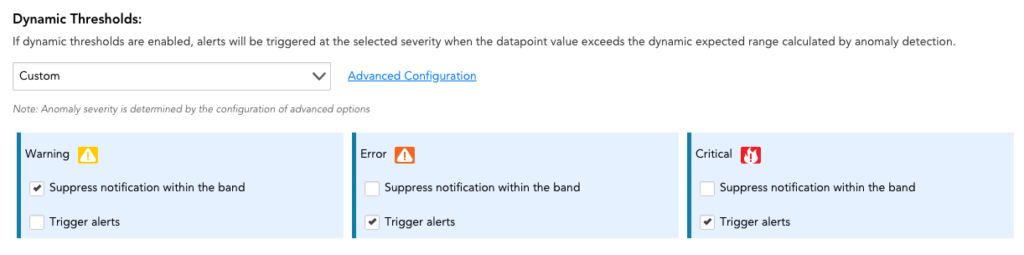
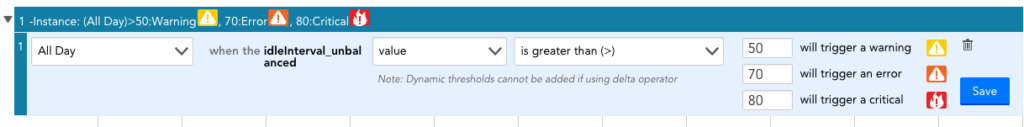
Figure 4: Here we set up dynamic alerting which is determined based on anomaly detection.
Figure 5: Setting up static alerting for when users know how unbalanced their service can get before needing to be notified.
How Does LogicMonitor Use Unbalanced Metrics?
At LogicMonitor, we use our own product to monitor our services. This allows us to take full advantage of the unbalanced metric to determine how well our services are being utilized and be able to take necessary actions to have better performance.
How New Version Deployment Impacted Our Own Service?
An example of a service that we are currently monitoring is the Collector Adapter that has multiple services across pods that in cases where there are large customers, we have noticed nodes not being used equally. This has been determined to be caused by our load management system that separates requests based on the customer so for larger customers, the request rate is much larger than smaller ones even though they all exist in the same pod.
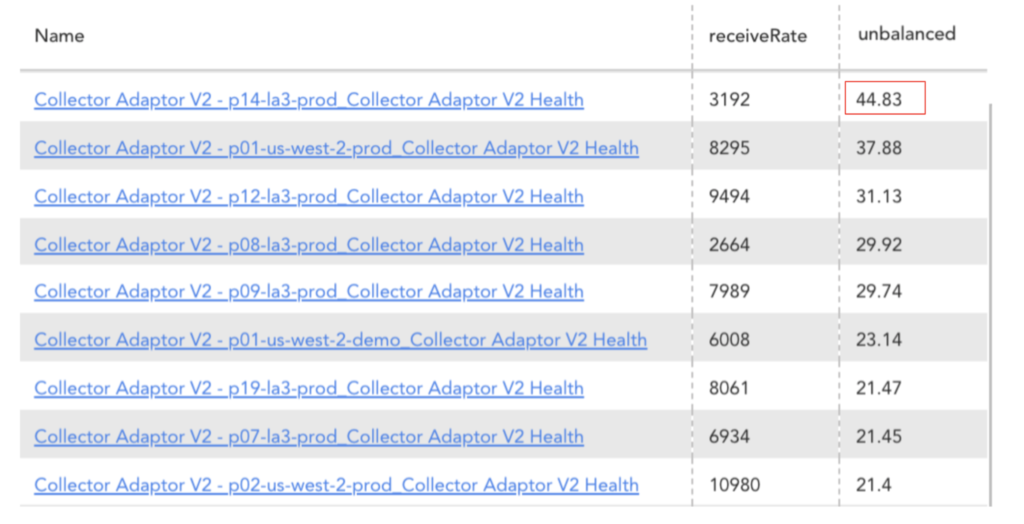
Figure 6: Unbalanced metric being used to find inefficiencies in the Collector Adapter services’ rate requests.
Having this metric available allows us to find these issues earlier and makes it easier to pinpoint the services and nodes that need to be reviewed. We are able to take more in-depth views into other utilization metrics such as CPU and then we can spend the time researching solutions rather than trying to find the initial issue. In the case where we had recently deployed a new version of the Collector Adapter, we saw a huge change in CPU utilization which was also followed by the larger unbalanced index shown in Figure 6. This led us to determine that there was something to look into and we were able to find more information using the other aggregated metrics gathered and anomaly detection.
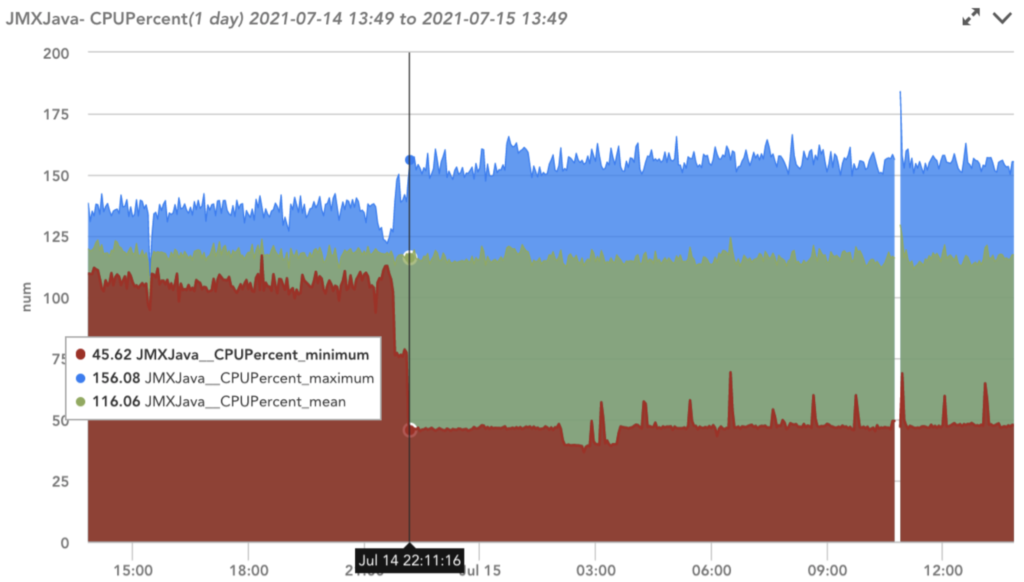
Figure 7: Service with Unbalanced index of 45% having CPU aggregation metrics with large differences between the max, min, and mean due to deployment.
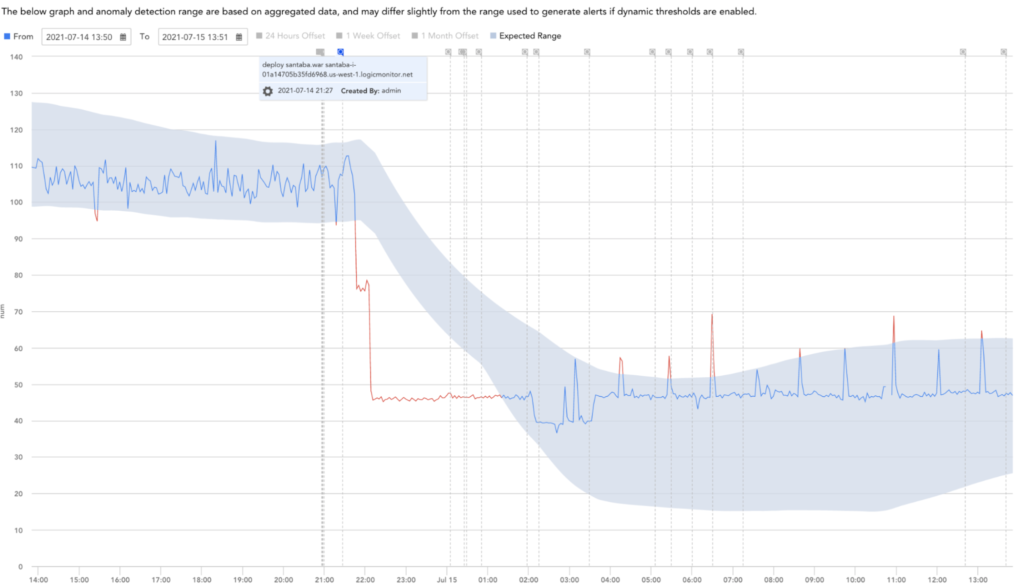
Figure 8: Anomaly detection analysis showing a large drop in CPU utilization and a note stating the cause being a recent deployment.
Conclusion
After reviewing both options as possible solutions, we determined that our use case would be better handled using an unbalanced service detection algorithm rather than relying on finding outliers. It provided more usability for smaller services while still providing support for larger ones all without relying on extreme value scenarios.
Originally Published July 16, 2021. Updated December 2022.
Disclaimer: The views expressed on this blog are those of the author and do not necessarily reflect the views of LogicMonitor or its affiliates.