SNMP Monitoring Software
Get the cloud-based performance monitoring platform used by IT Ops teams to monitor your entire network infrastructure – including SNMP.


Get the cloud-based performance monitoring platform used by IT Ops teams to monitor your entire network infrastructure – including SNMP.
LogicMonitor’s SNMP monitoring will allow your team to break free from the endless configuration, maintenance, and querying that plagues point-based in-house monitoring systems – without sacrificing the fine detail and customization you’ve come to expect.


LogicMonitor automatically scans your infrastructure stack, determines each device’s type, and automatically applies the appropriate monitoring LogicModules Our Active Discovery™ infrastructure scanning is dynamic, so we automatically update what we monitor as your operations team makes changes to your infrastructure.

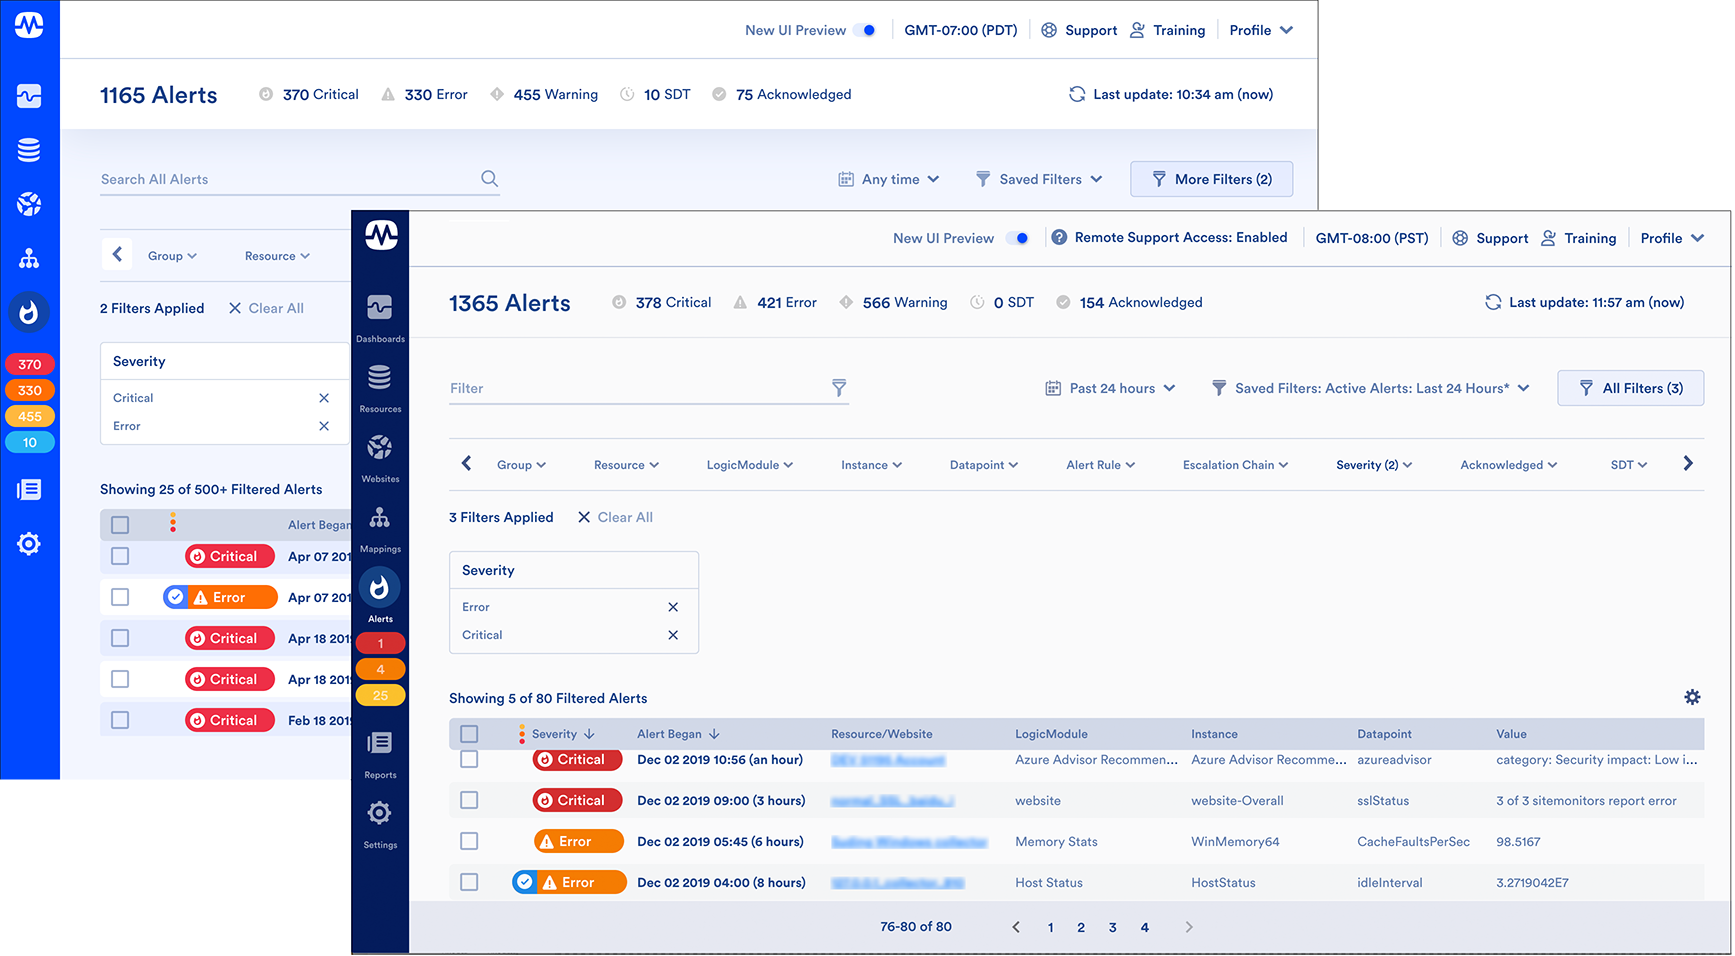
Alerts can be routed to different recipients based on the time of day, type, and severity – or escalated through a “chain” of individuals to ensure timely action Notifications contain best-practices information and suggest courses of resolution, so you act with confidence no matter what the situation.
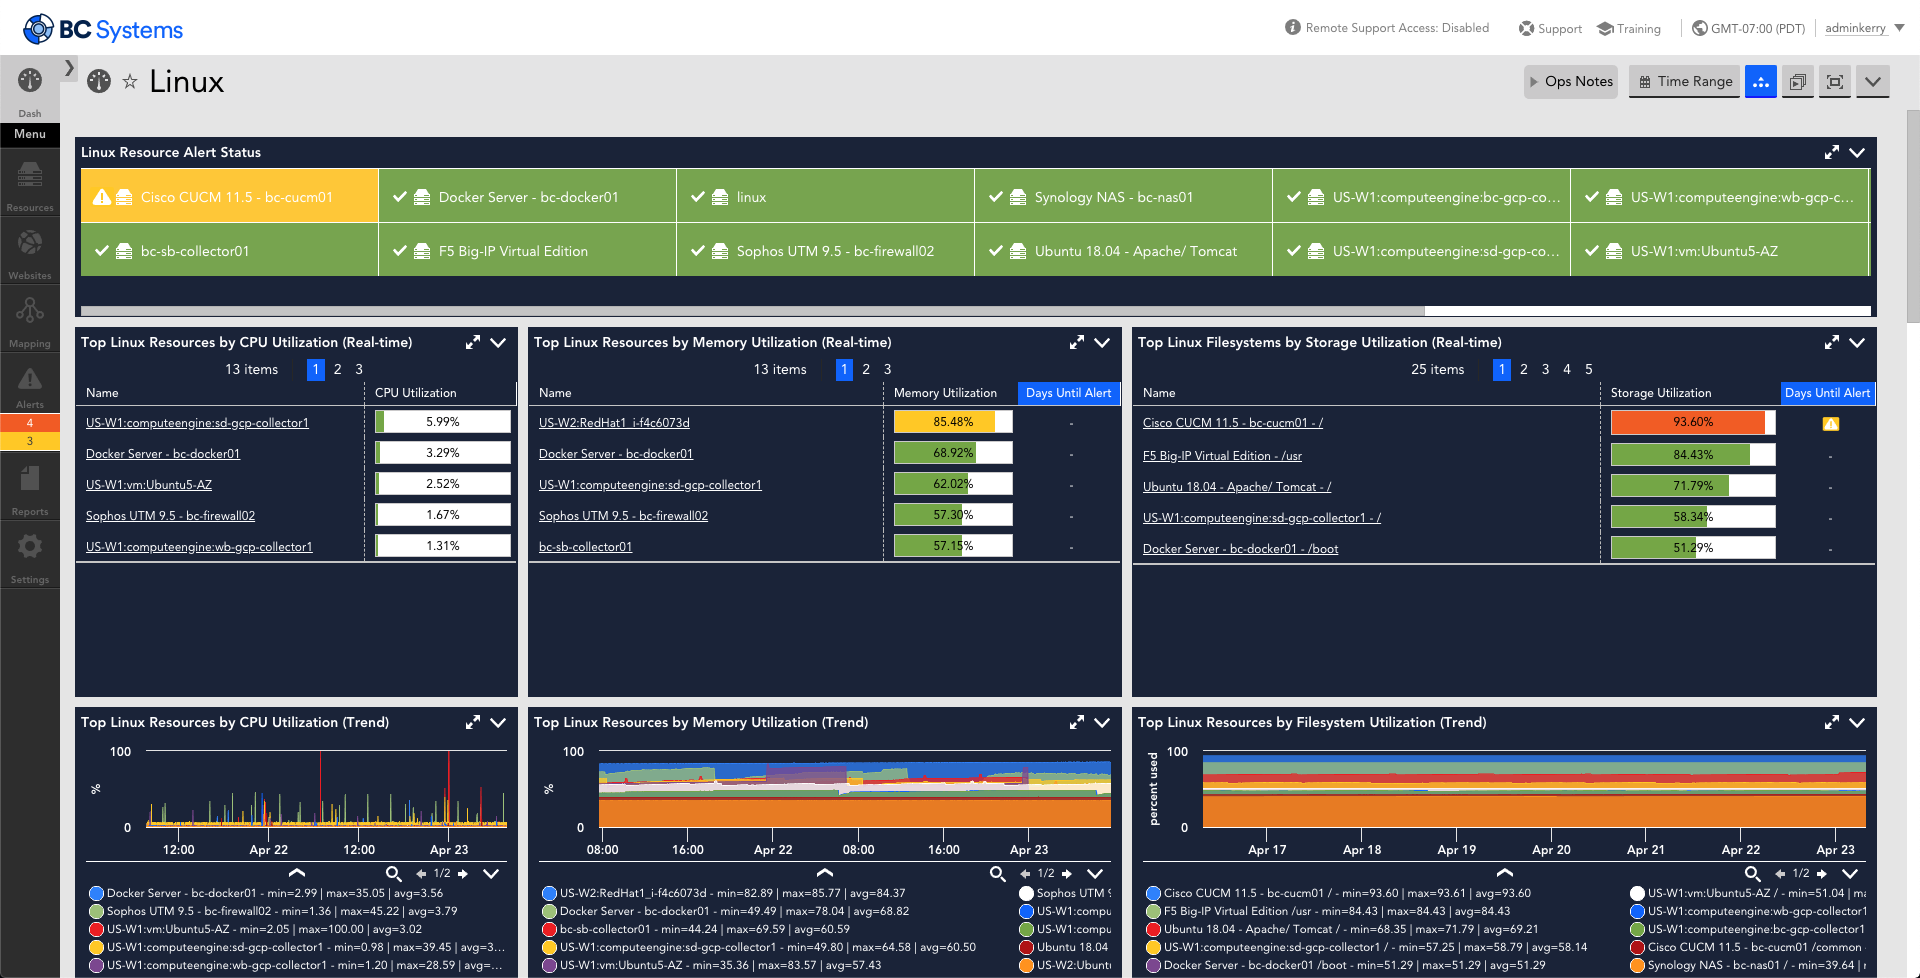
Compare real-time data with historical statistics from minutes, weeks, or even months ago, helping you spot trends and make strategic decisions Track performance data across multiple devices from a single view, allowing you to correlate data from disparate systems
A single platform for ITOps and DevOps eliminates data silos and tracks metrics that matter. Built with hybrid infrastructure in mind, a vendor-neutral approach helps IT teams better understand the user experience and accelerate business transformation.
Log intelligence at scale – instant access to contextualized and correlated logs and metrics in a single, unified cloud-based platform. With tiered retention options, including unlimited retention, and hot storage to optimize data hygiene and internal compliance initiatives.
Never miss an application error, improve code quality, and diagnose and fix issues faster. Gain insight into the performance of the entire app stack, from code to cloud, to ensure a flawless customer experience in agile environments.
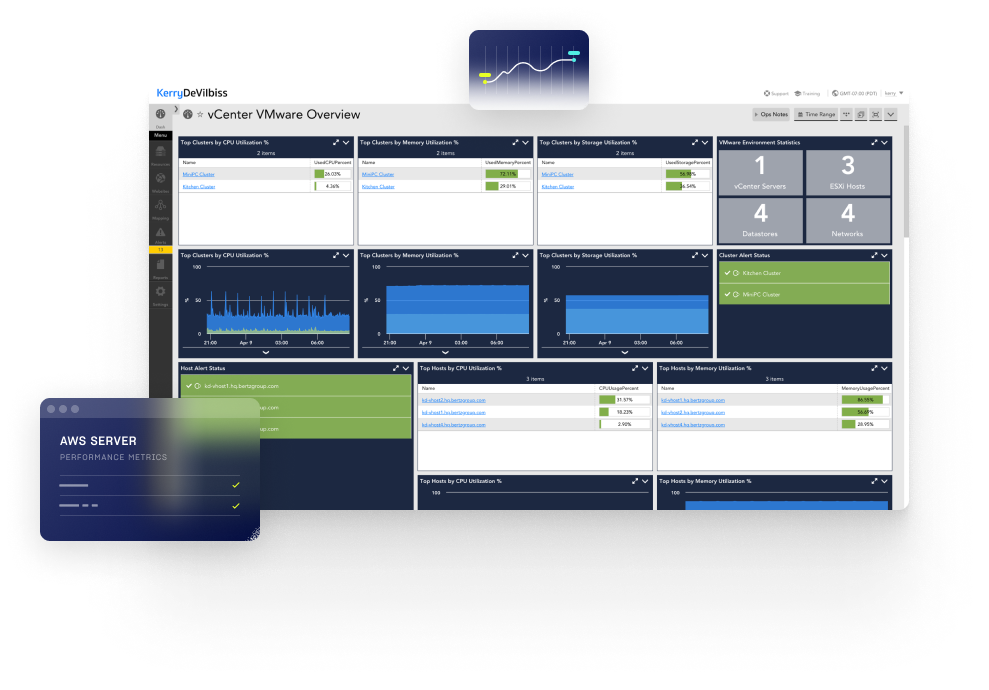
Manage all your on-prem, cloud, AWS, GCP, and Azure servers together with LogicMonitor.
Agentless collectors automatically detect devices
AI-powered predictive alerts
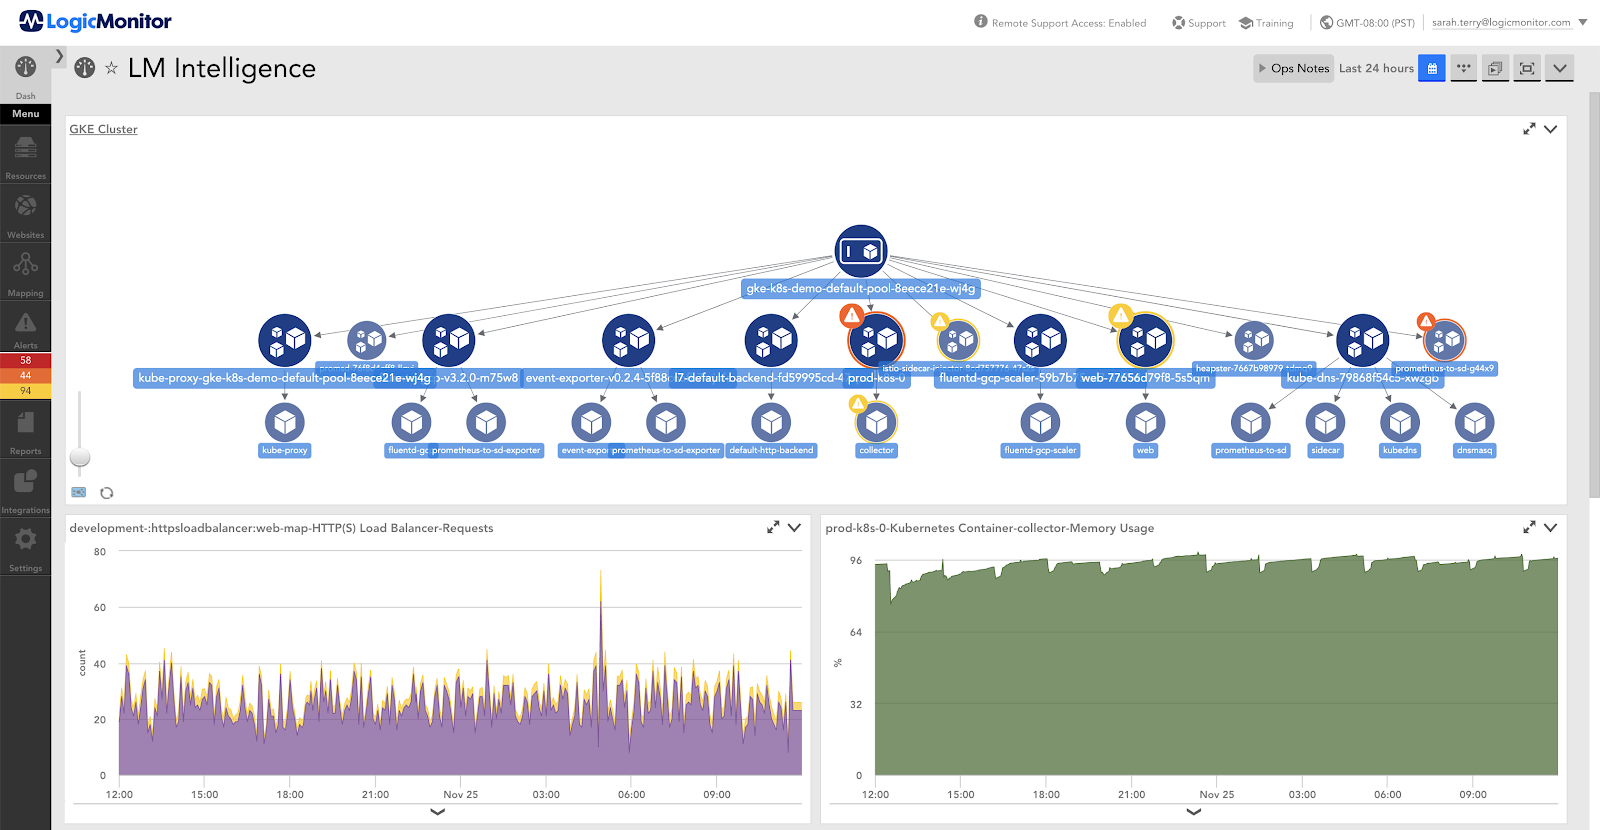
Unified & complete view of device topology
ML provides deeper performance insights
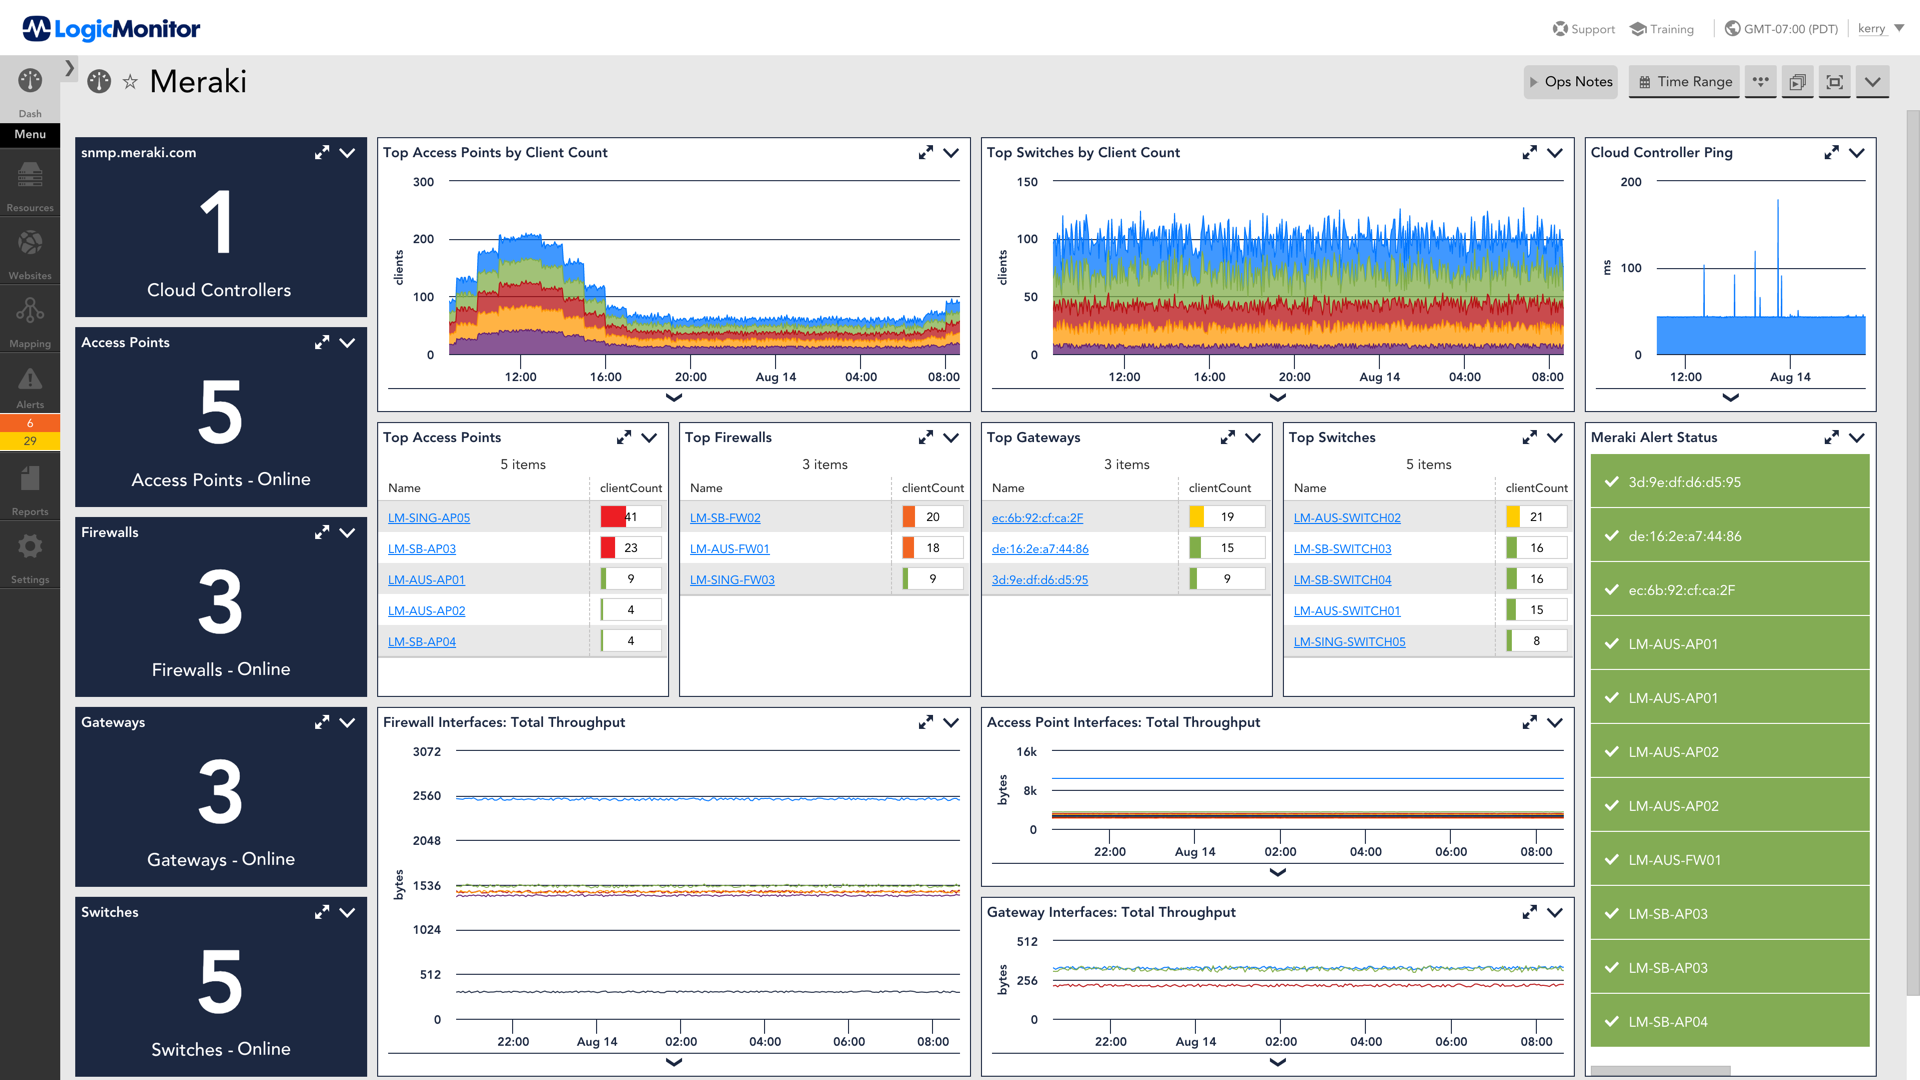
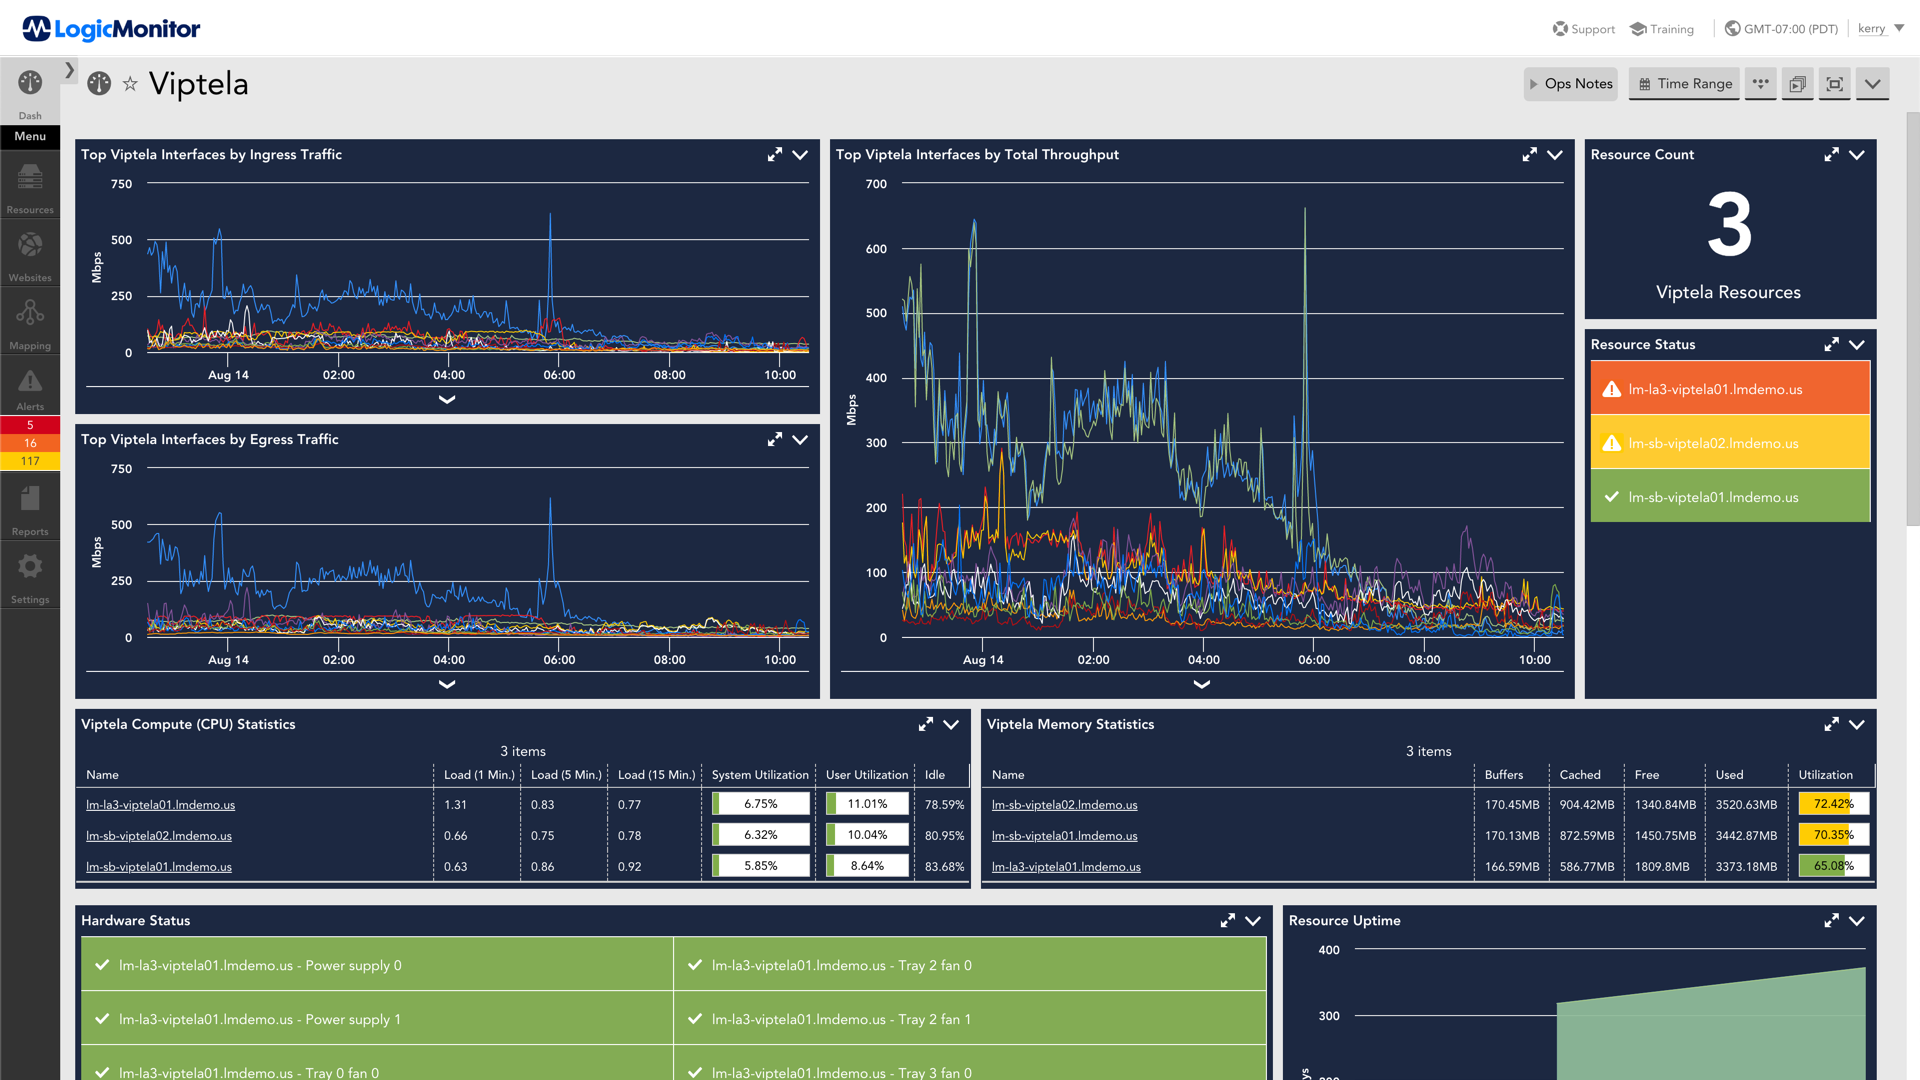
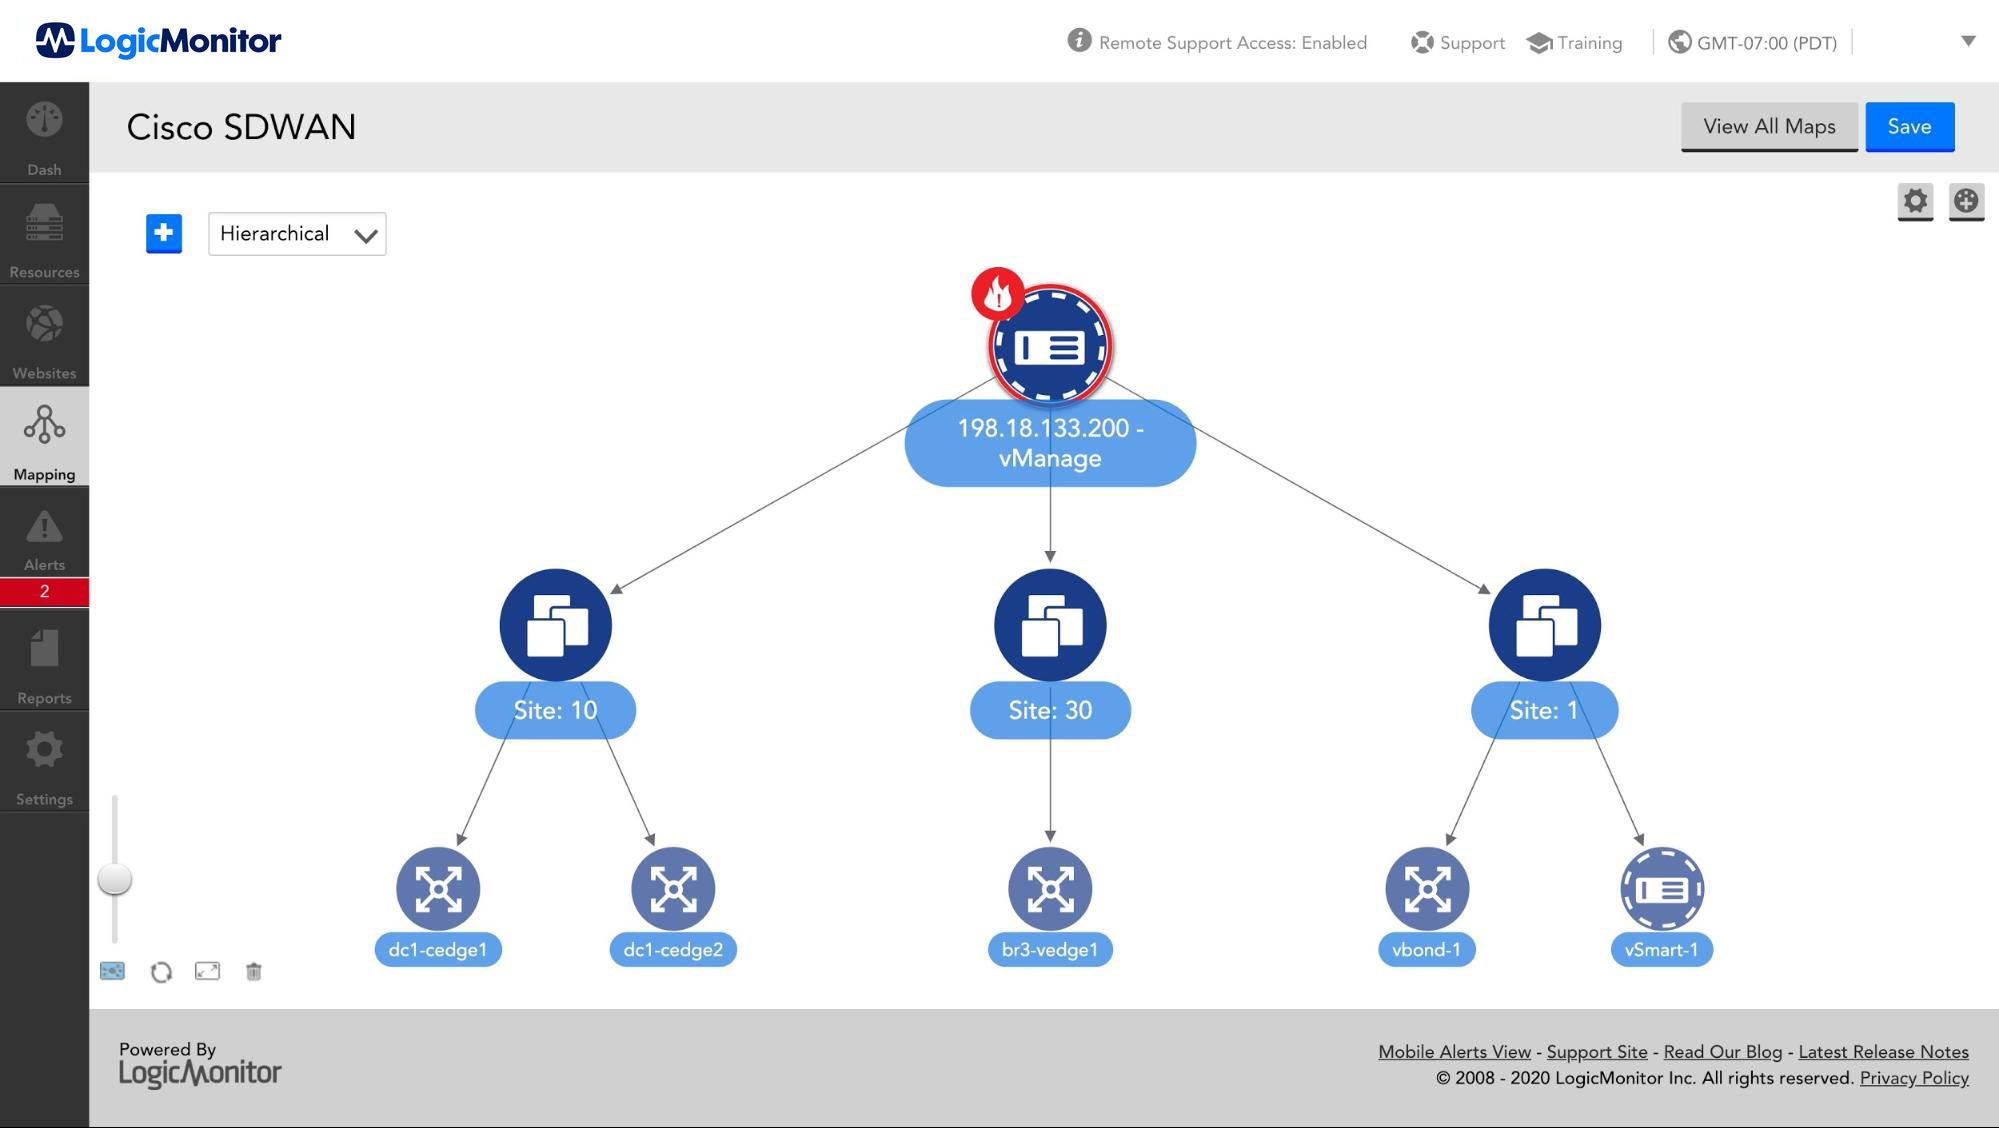
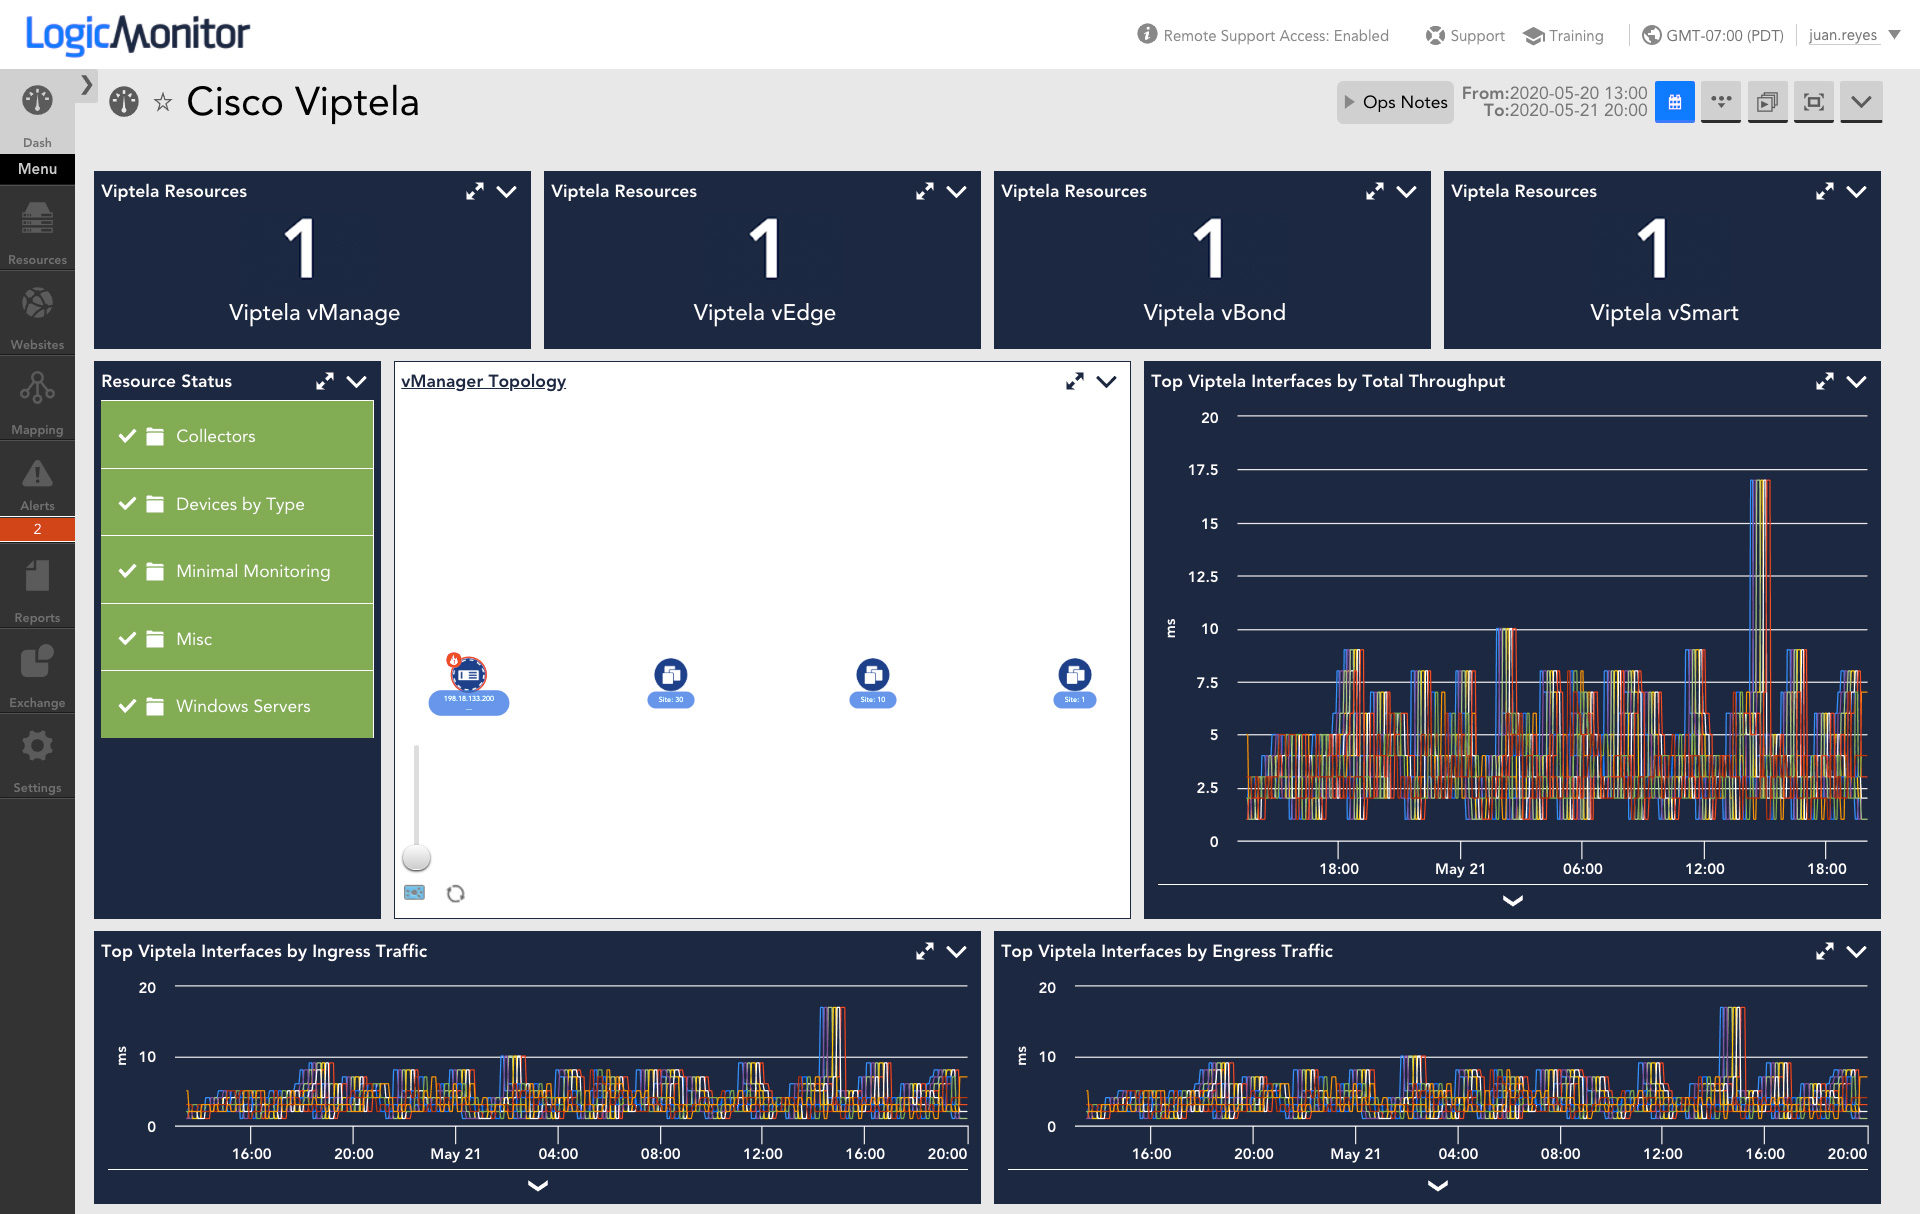
As a Preferred Partner with Cisco, LogicMonitor works with SD-WAN product teams to develop best-in-class monitoring coverage for Viptela and Meraki. We provide you extensive visibility for SD-WAN alongside traditional environments with built-in topology mapping to show relationships within your infrastructure.
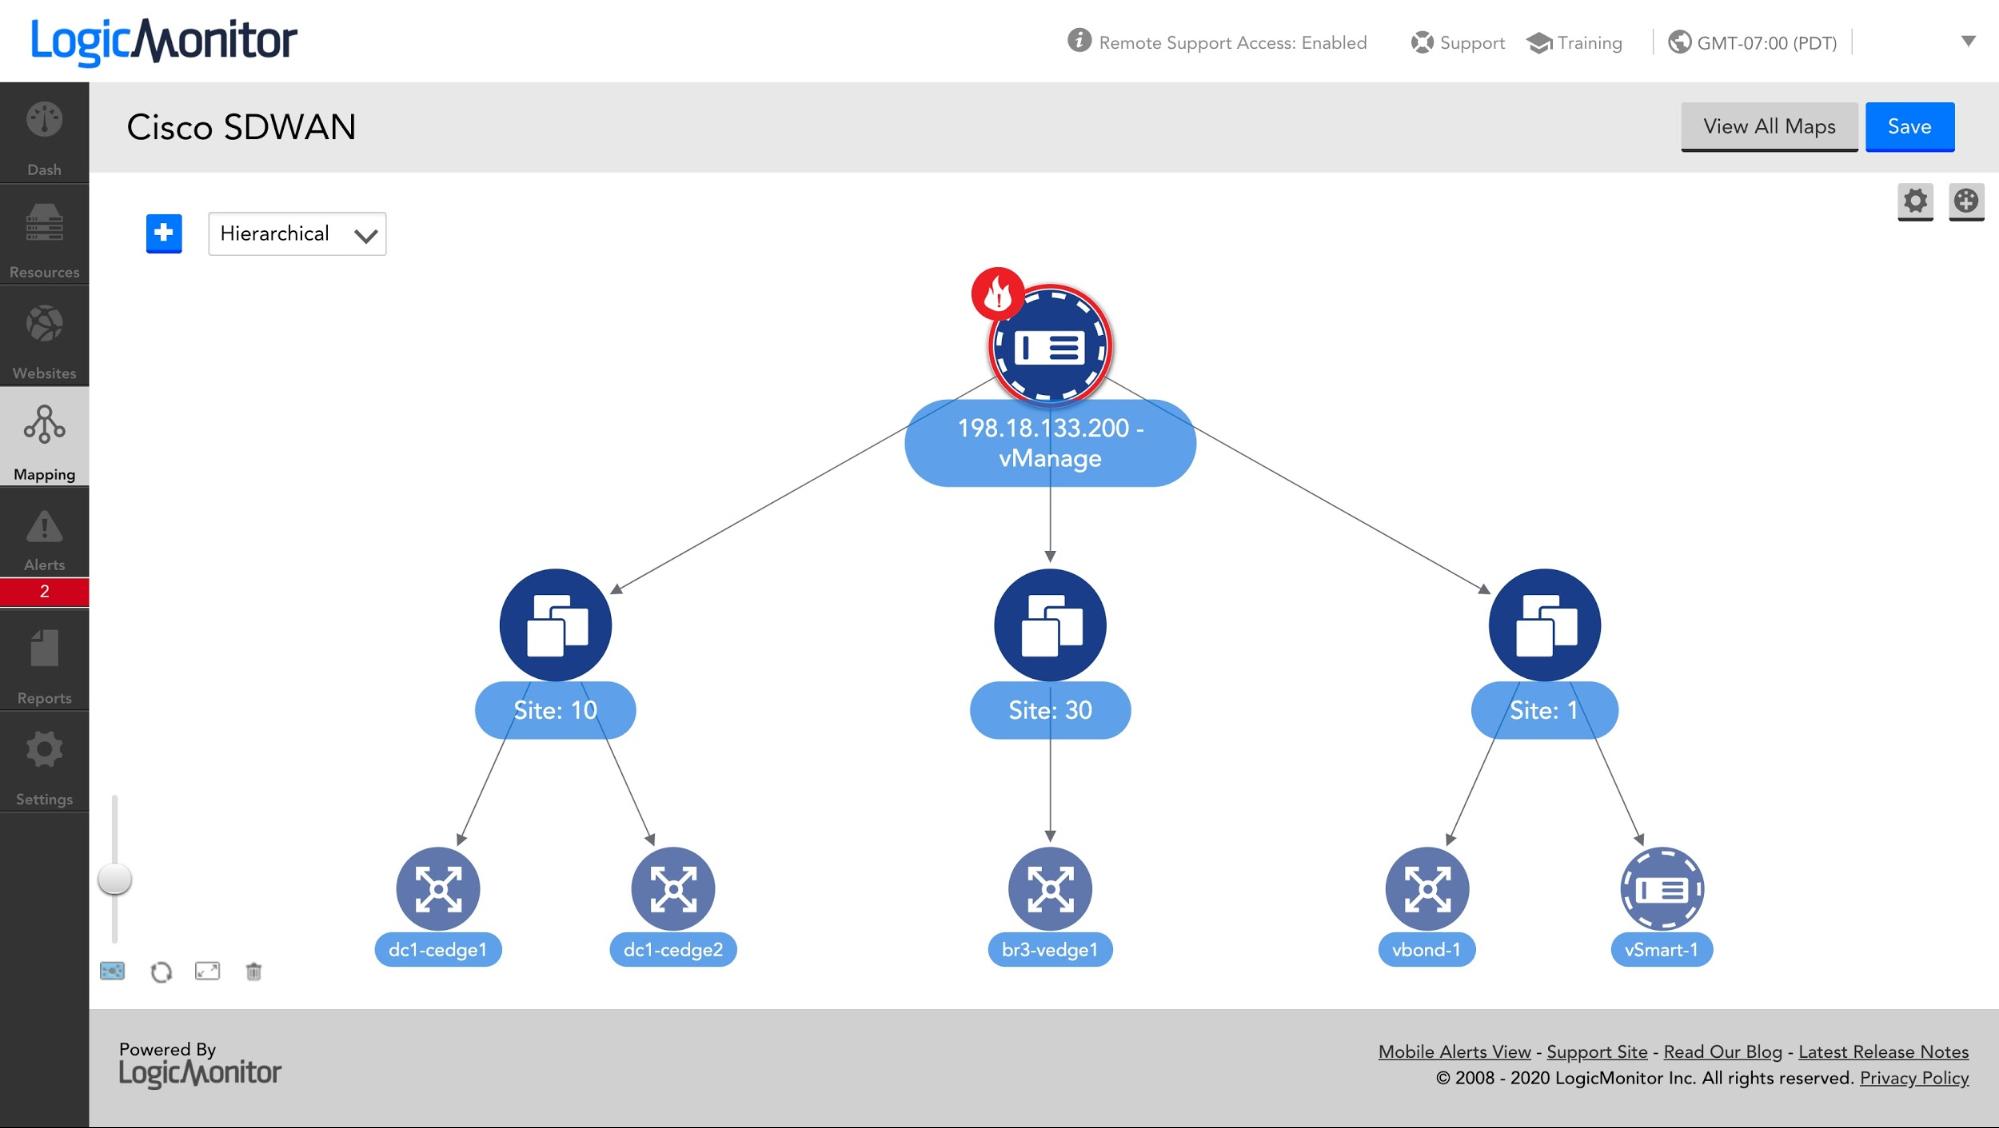
LogicMonitor’s breadth of coverage ensures you can monitor the health and performance of traditional networks alongside next-gen infrastructure within a single platform. With our lightweight, agentless collector you can track granular and high level metrics for Cisco vManage, Meraki and Viptela:
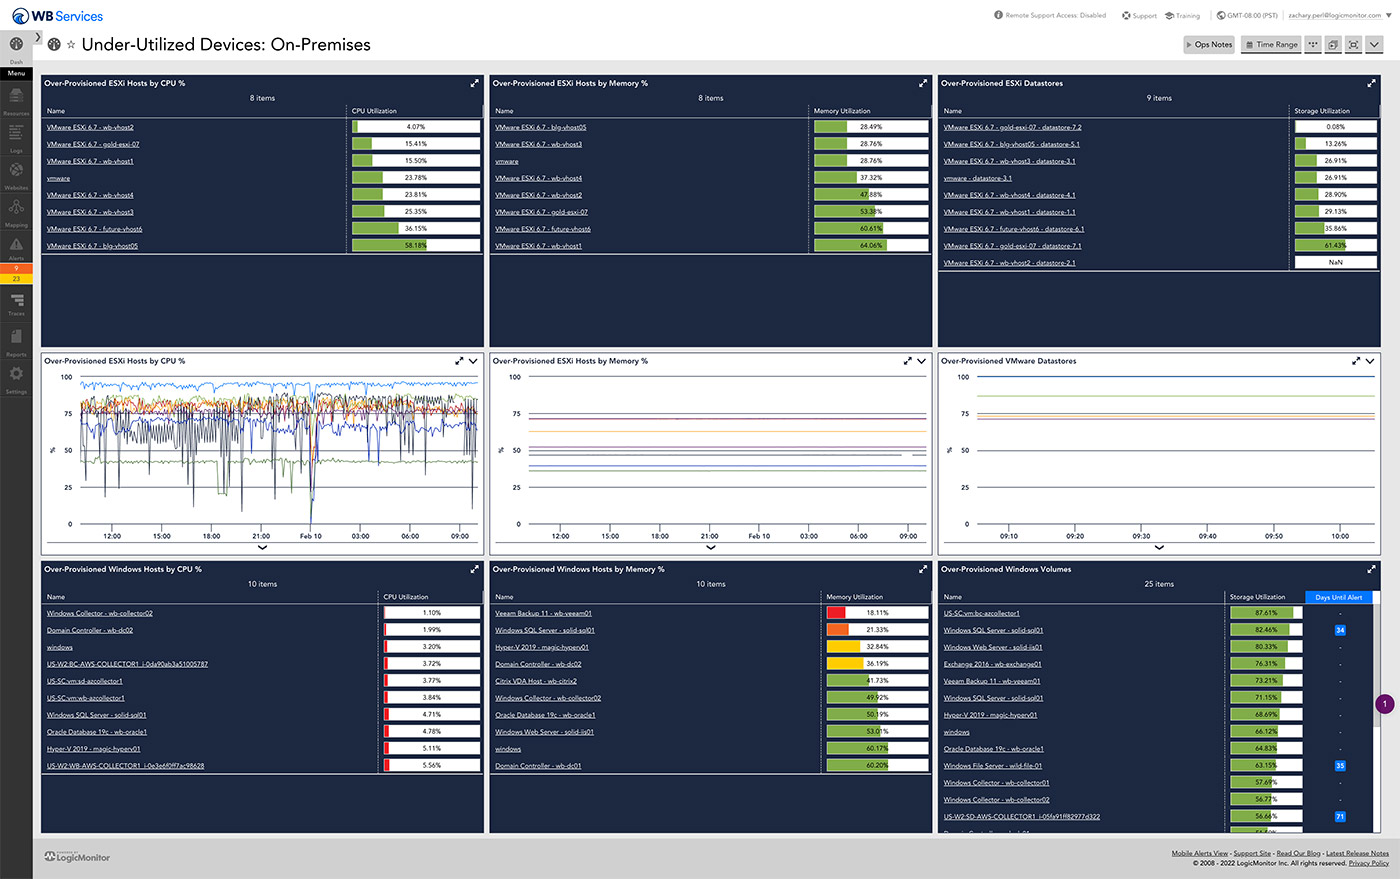
LogicMonitor gives you the in-depth insight you need to manage the health and performance of Meraki access points, firewalls, gateways, switches, and more. Our software allows you to audit under-utilized and over-utilized resources to optimize resource utilization in minutes while providing suggestions for future capacity planning based on historical trends and individual (or aggregate) resource data.
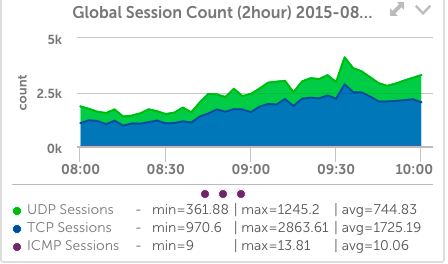
With SD-WAN, IT can deliver routing, threat protection, efficient offloading of expensive circuits, and simplification of WAN network management. With LogicMonitor, you can ensure these systems stay online by proactively monitoring and alerting on detailed metrics like data packets, latency, sessions, cpu, memory, packets, and WAN edge inventory.
Automated discovery of resources and the surrounding network creates a faster time to value and reduces onboarding efforts. Our automated deployment and configuration detects all your network components automatically and starts monitoring, graphing and alerting right away. Just enter an IP address or hostname, and you’ll be ready to optimize your SD-WAN based infrastructure in a matter of minutes.

Topology mapping allows you to visualize your network and the underlying services that are connected to them. With root cause analysis and dynamic thresholding features built-in, LogicMonitor allows you to reduce Mean Time to Resolution (MTTR) and prevent outages before they happen.
JOSEPH FENDER
IT SYSTEM ENGINEER, Q2EBANKING
A single platform for ITOps and DevOps eliminates data silos and tracks metrics that matter. Built with hybrid infrastructure in mind, a vendor-neutral approach helps IT teams better understand the user experience and accelerate business transformation.
Log intelligence at scale – instant access to contextualized and correlated logs and metrics in a single, unified cloud-based platform. With tiered retention options, including unlimited retention, and hot storage to optimize data hygiene and internal compliance initiatives.
Never miss an application error, improve code quality, and diagnose and fix issues faster. Gain insight into the performance of the entire app stack, from code to cloud, to ensure a flawless customer experience in agile environments.
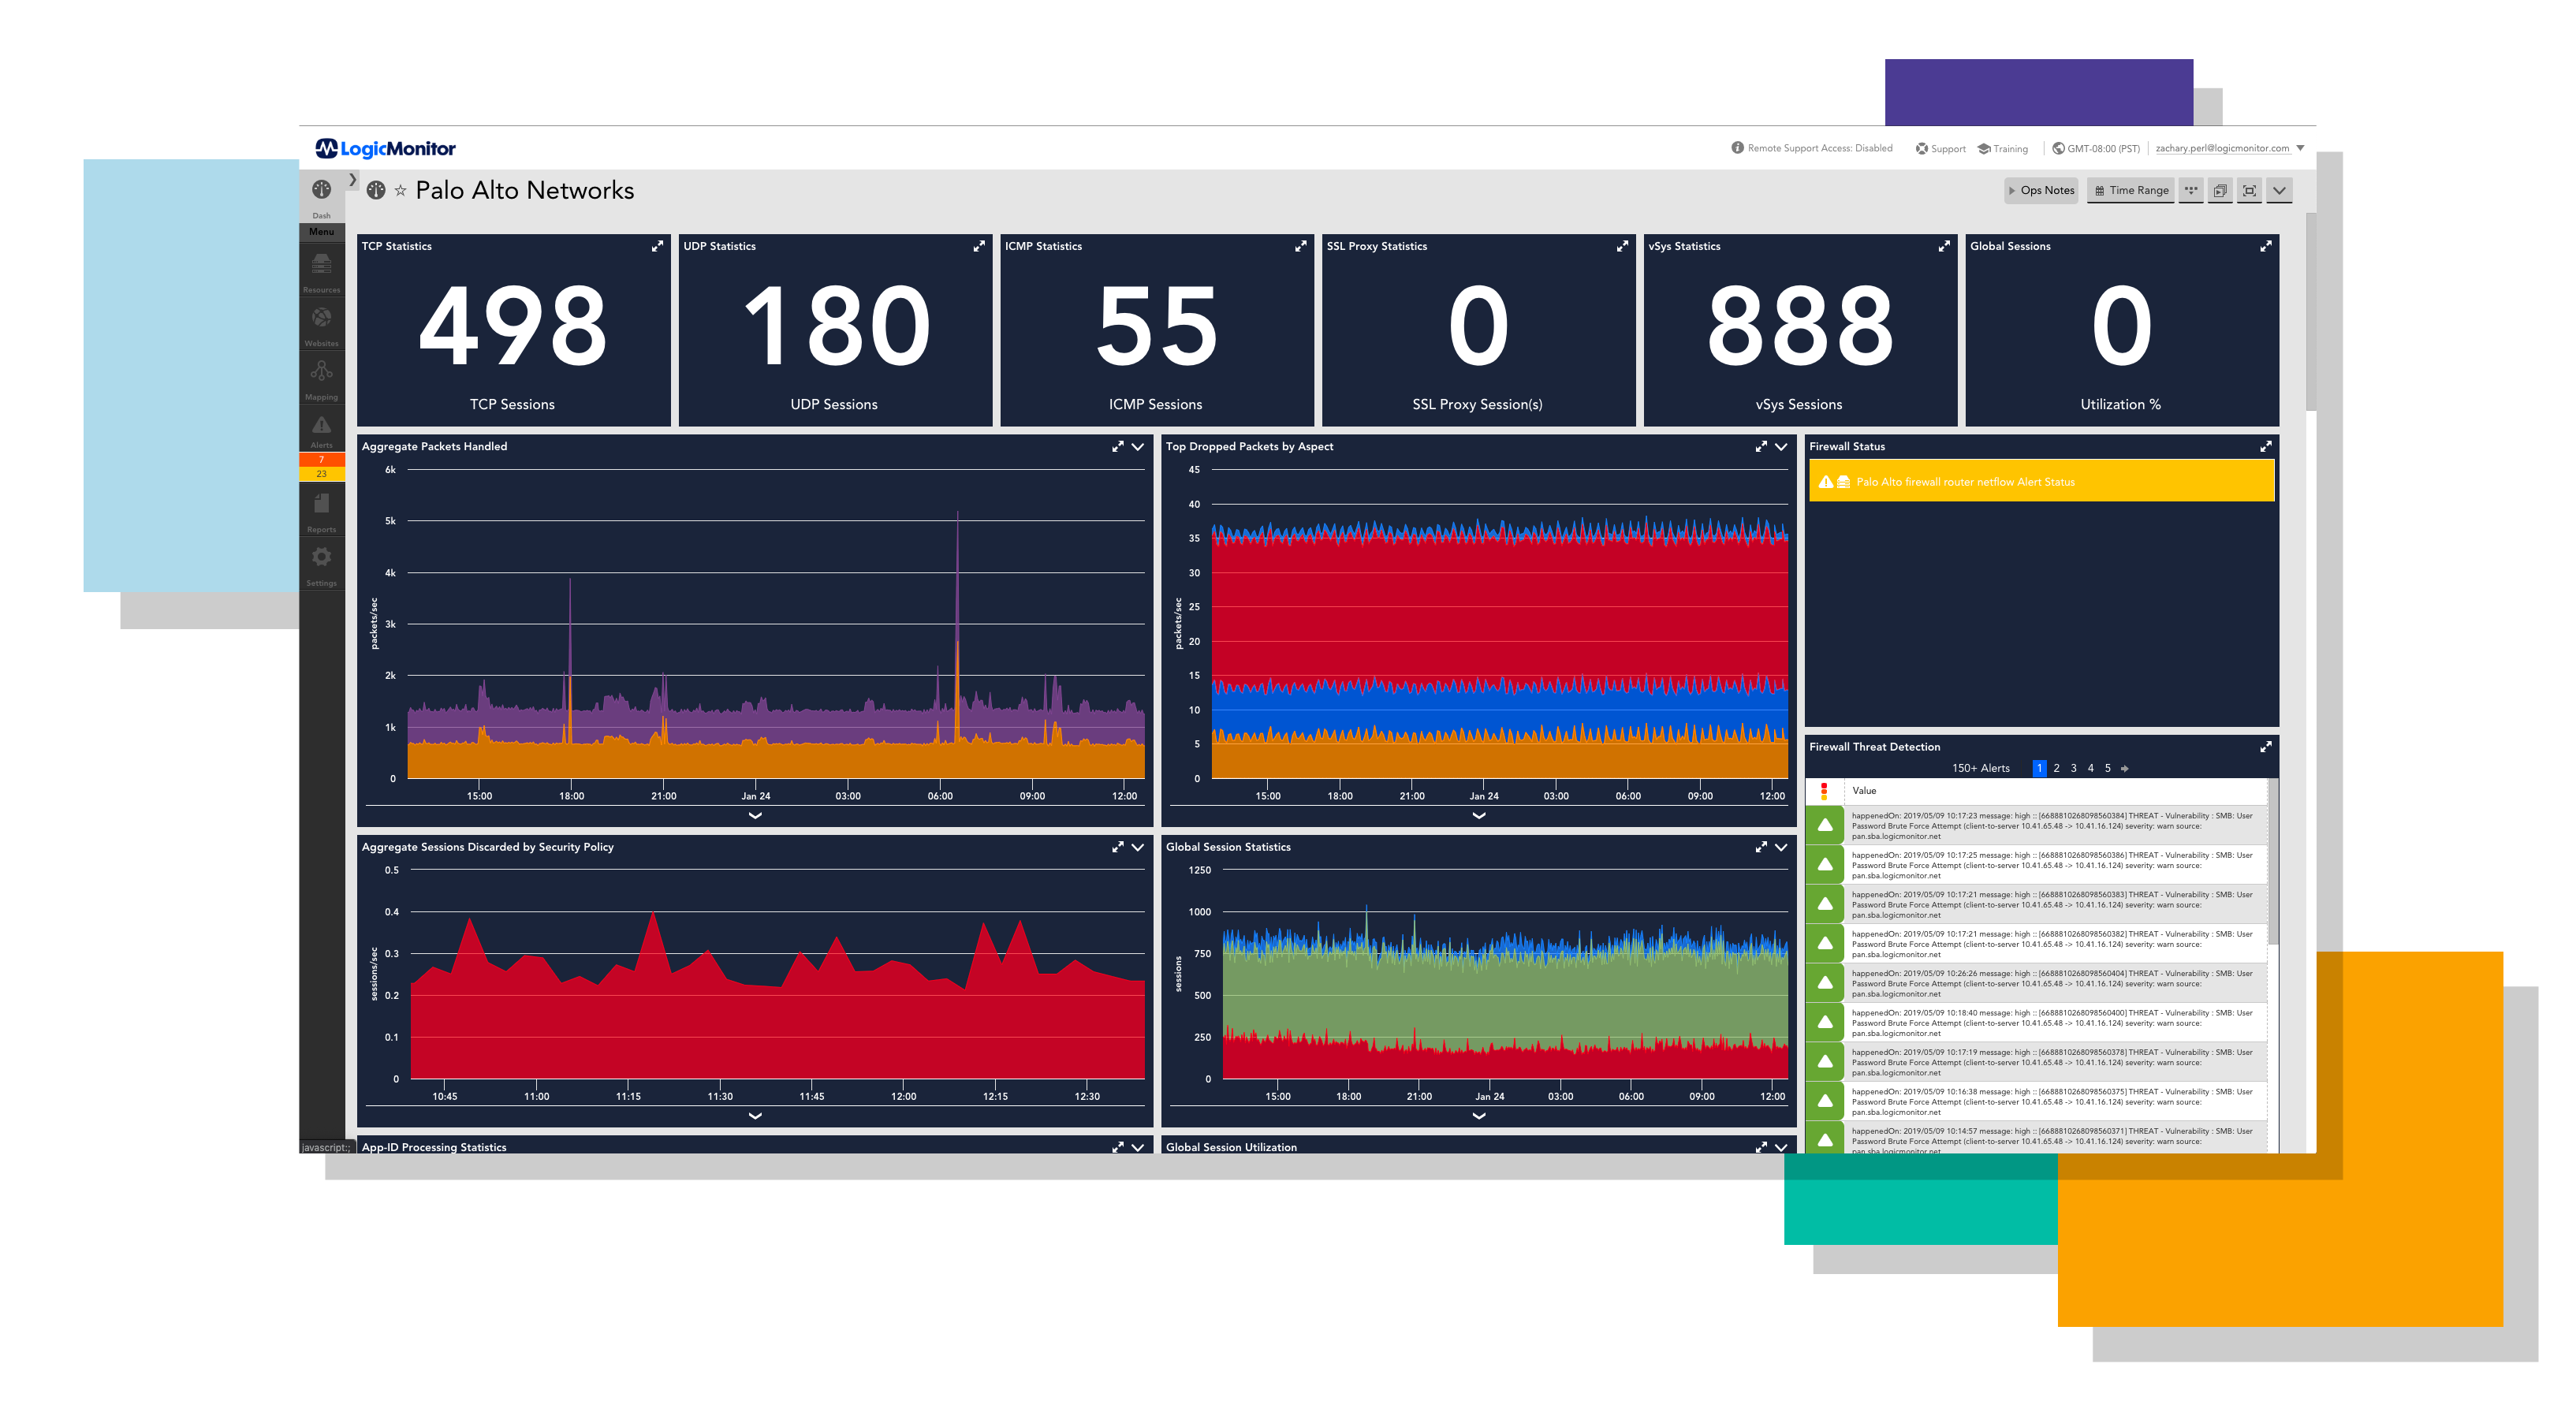
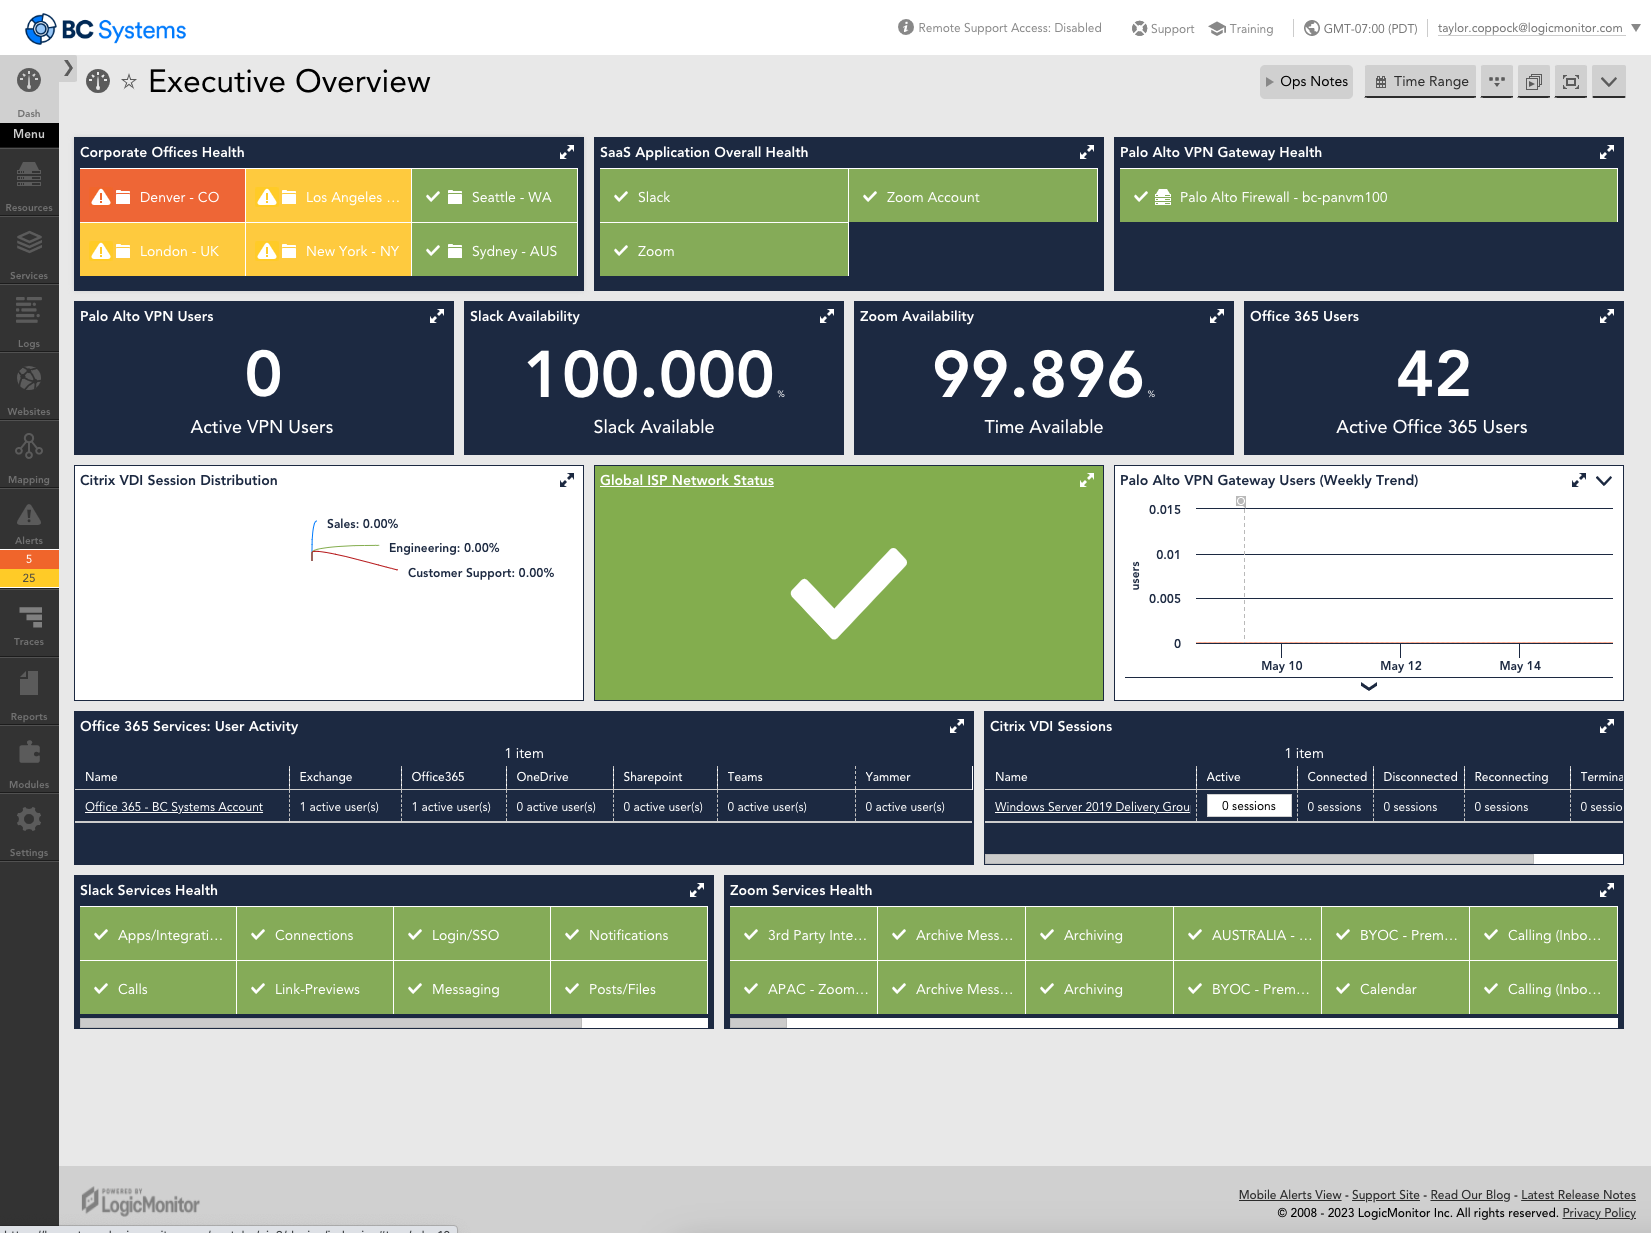
Your firewalls are the gatekeeper to maintaining the privacy & security of your technology stack, so knowing what they’re doing – and what they’re not – is critical to running your operation. Get the cloud-based performance monitoring platform used by IT Ops teams to monitor Palo Alto.
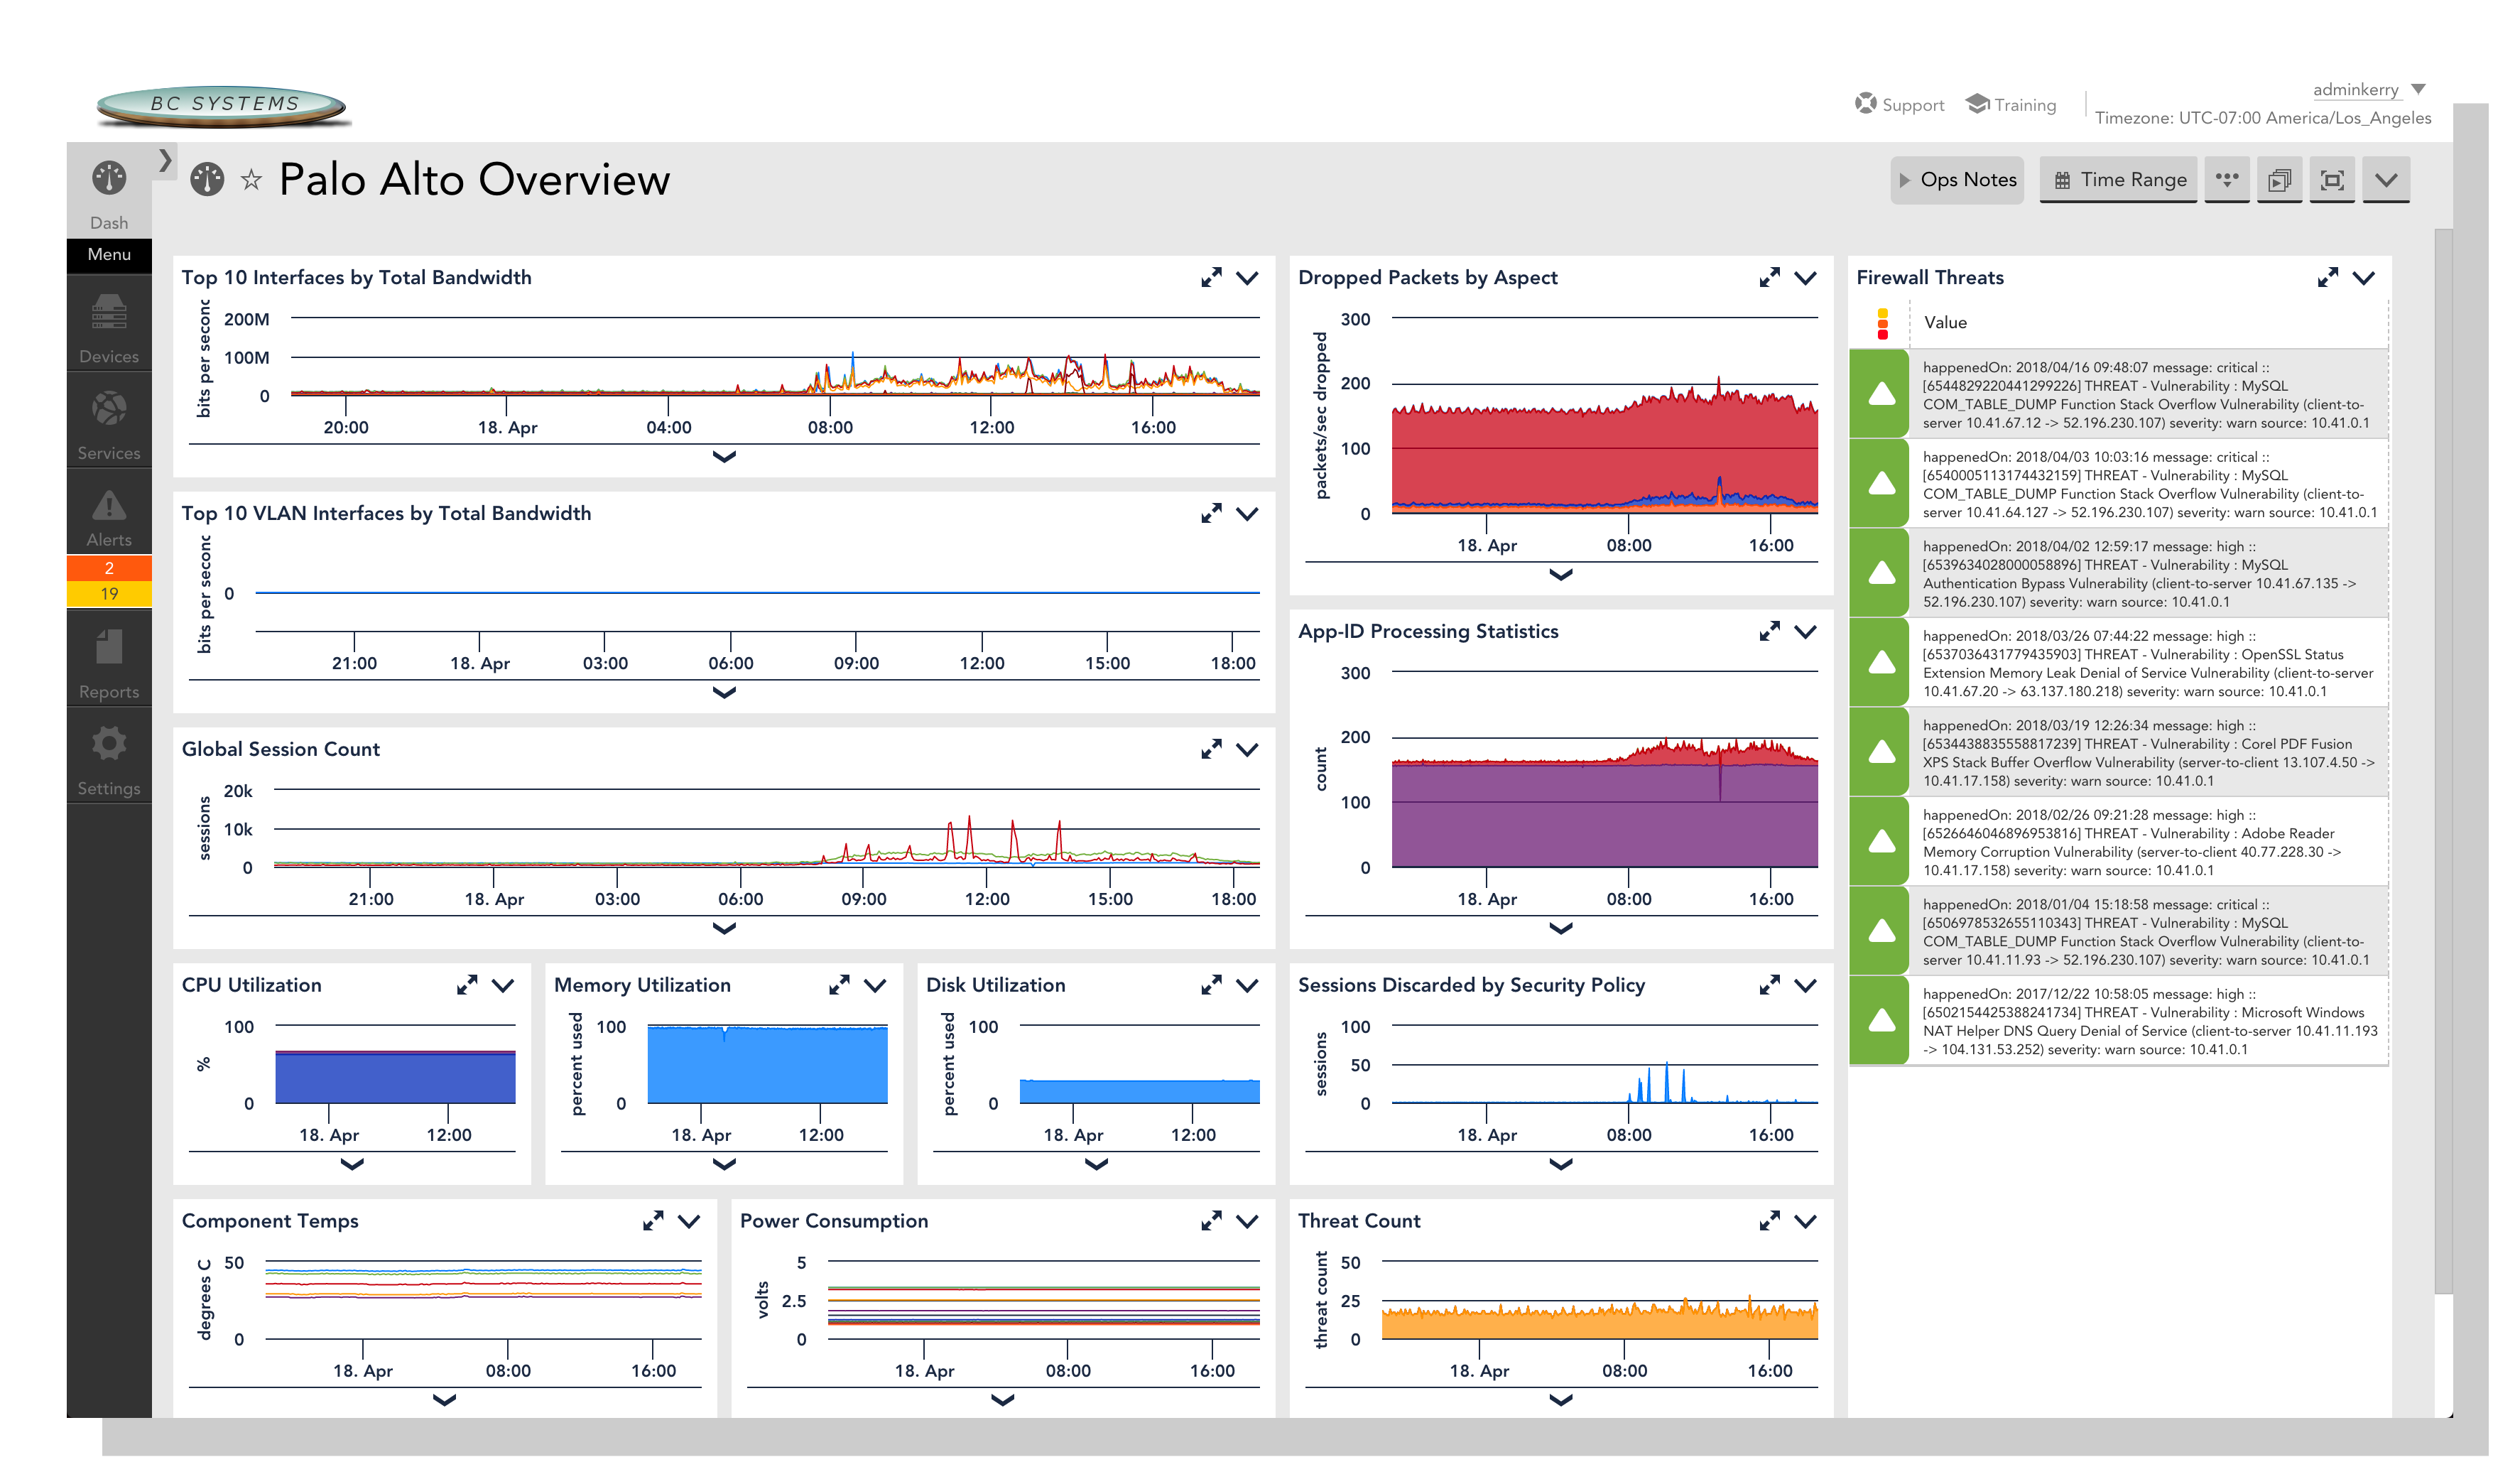
LogicMonitor automatically discovers everything you need to know about your Palo Alto systems and delivers the monitoring, alerting and graphing you need to maintain high availability and security.
LogicMonitor will take advantage of the intelligent threat analysis of Palo Alto Networkss, and report on the number of threats discovered, classified by severity, and alert you through escalating notifications.
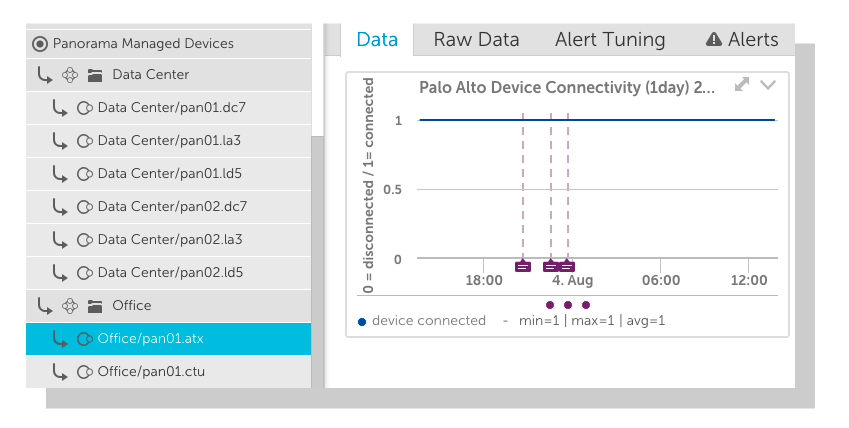
Discover all the devices managed by the Panorama system. Report and alert on connectivity, policy synchronization, and more.
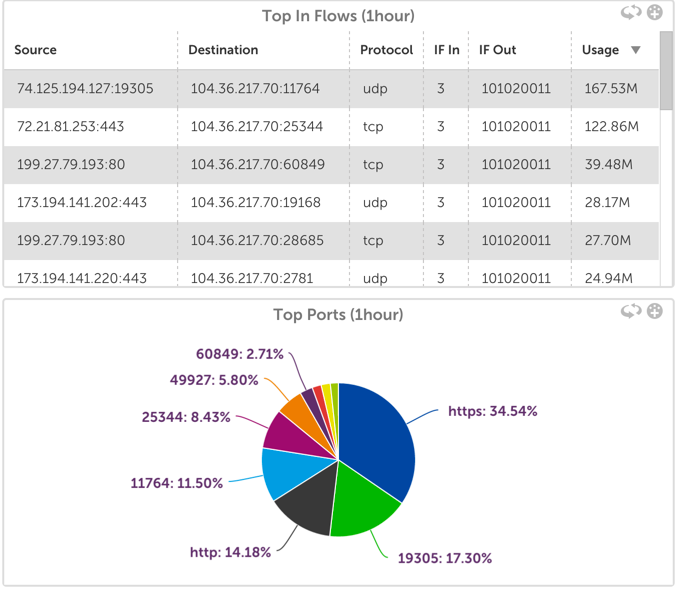
Send the Netflow data from your Palo Alto Networks firewalls to a LogicMonitor collector, and get easy and powerful visualizations of your traffic, allowing you to drill in to any time period, and view top talkers, protocols, servers and clients.
Eliminate tool sprawl with deeper insights into the health and performance of your cloud and on-prem infrastructure within a single platform. Make hybrid monitoring a breeze with support for servers, databases, cloud, containers, networks, applications and more.
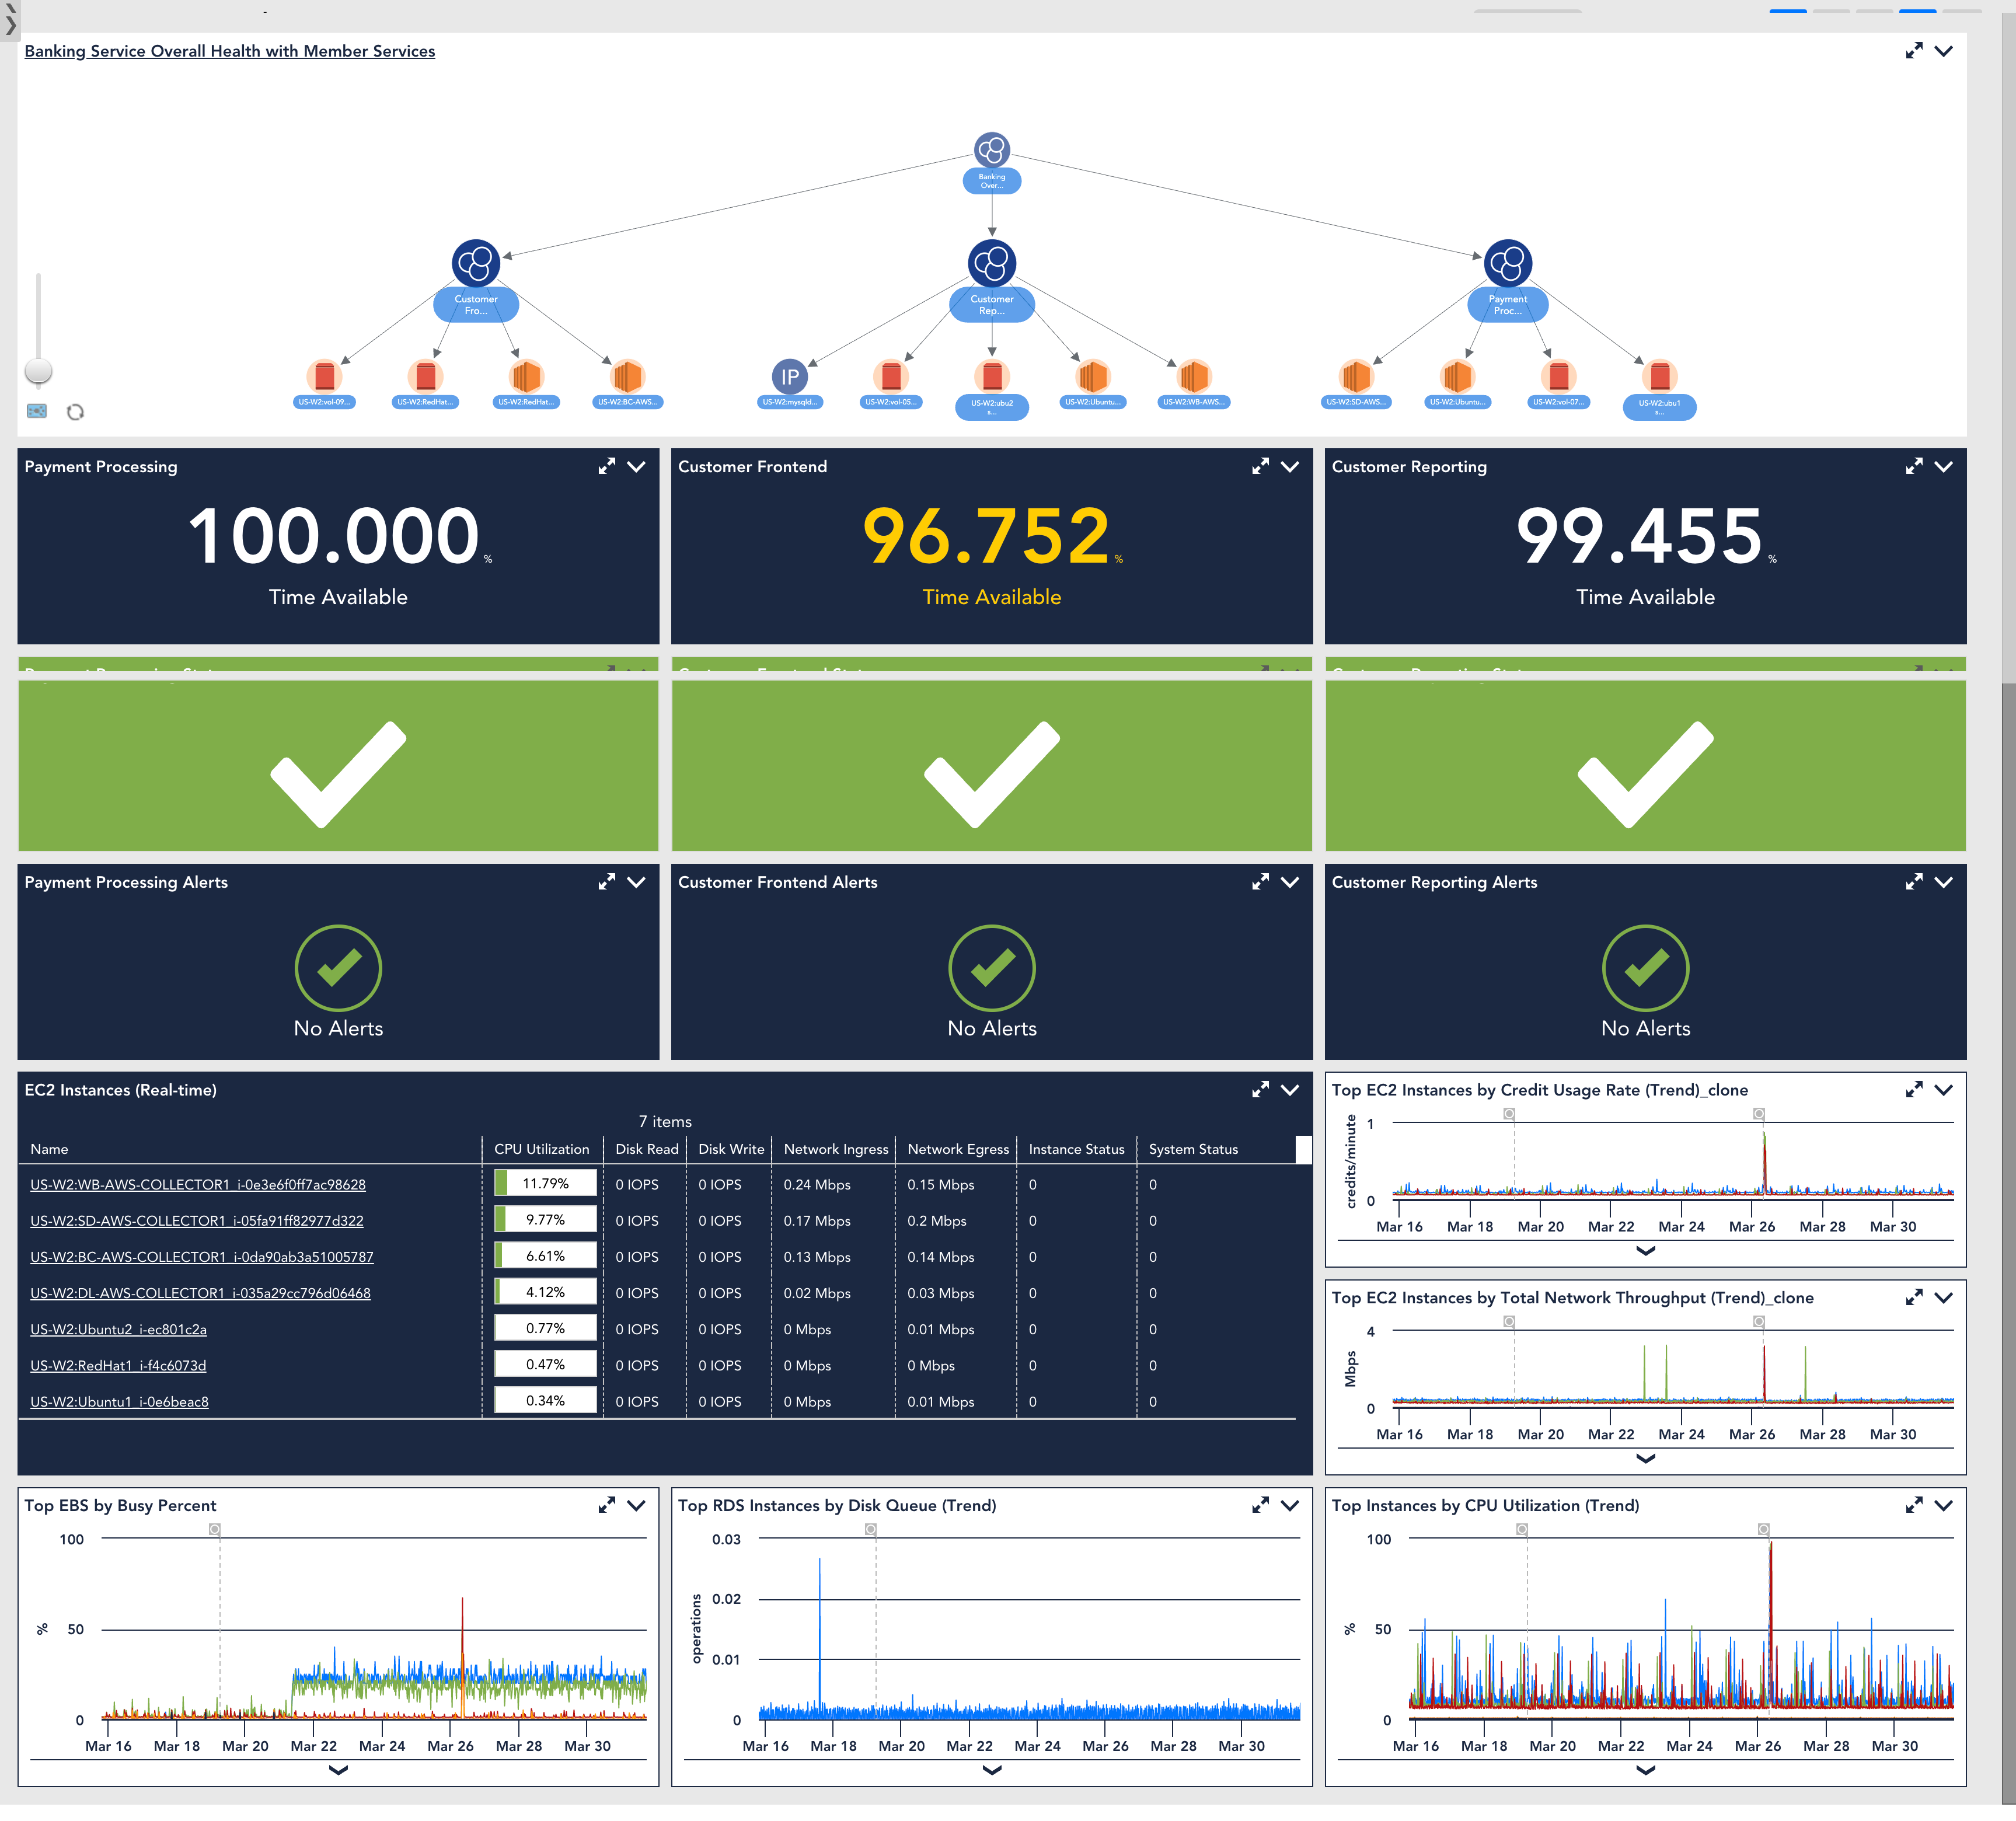
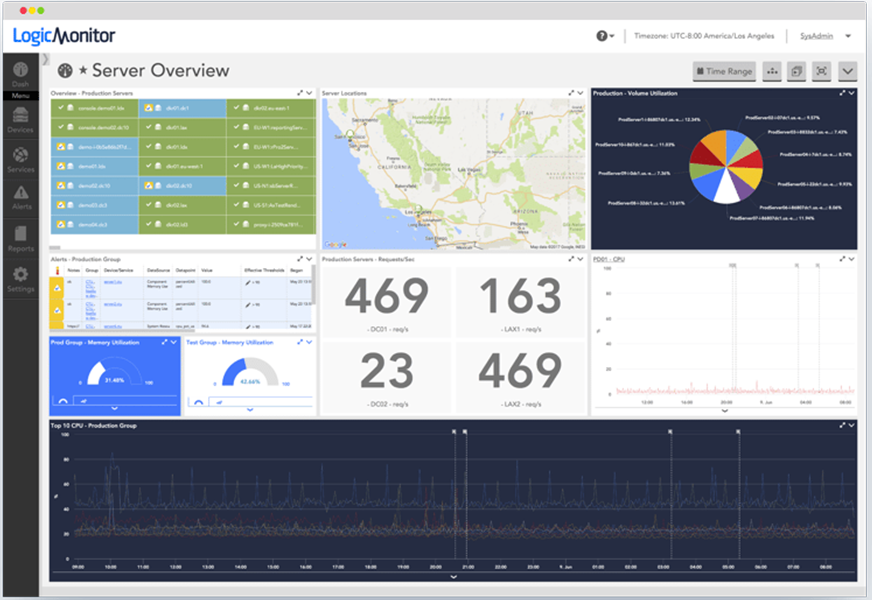
Monitor the health and performance of your network and cloud infrastructure on a single unified platform. Achieve complete network and hybrid cloud visibility in minutes with our agentless collector and automated resource discovery. Speed up troubleshooting across all network and IT devices alongside your AWS, Azure, and GCP deployments.


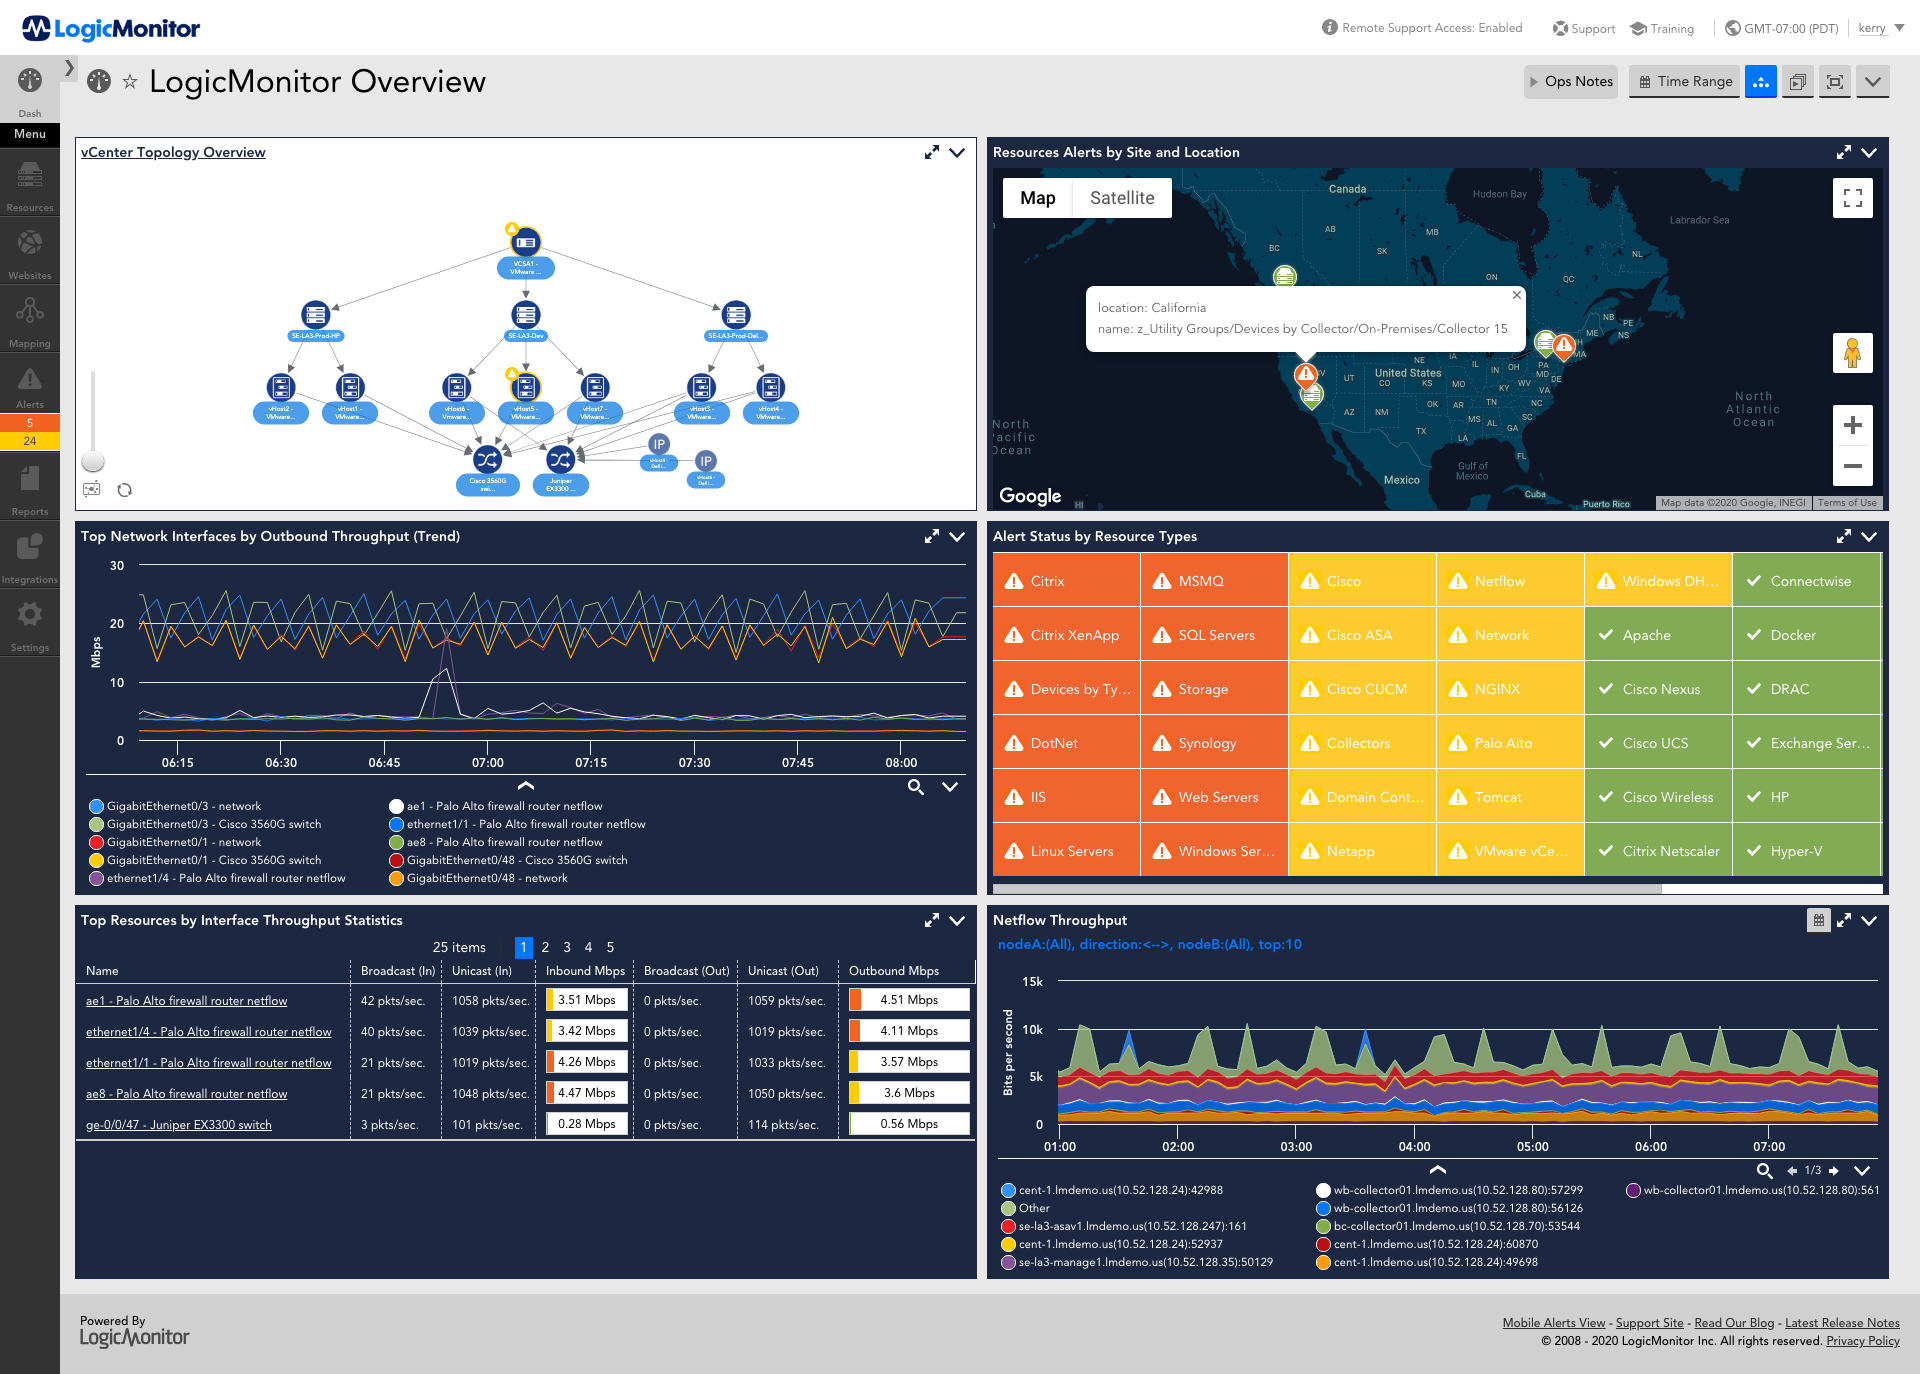
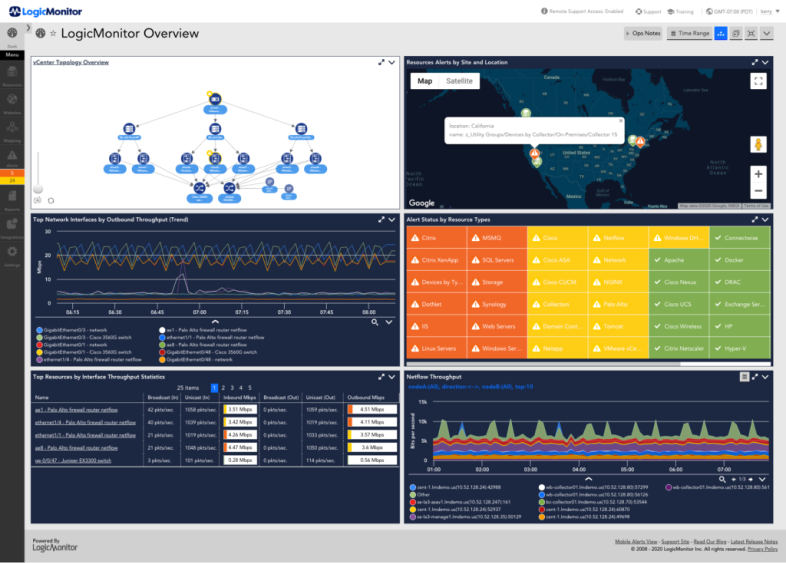
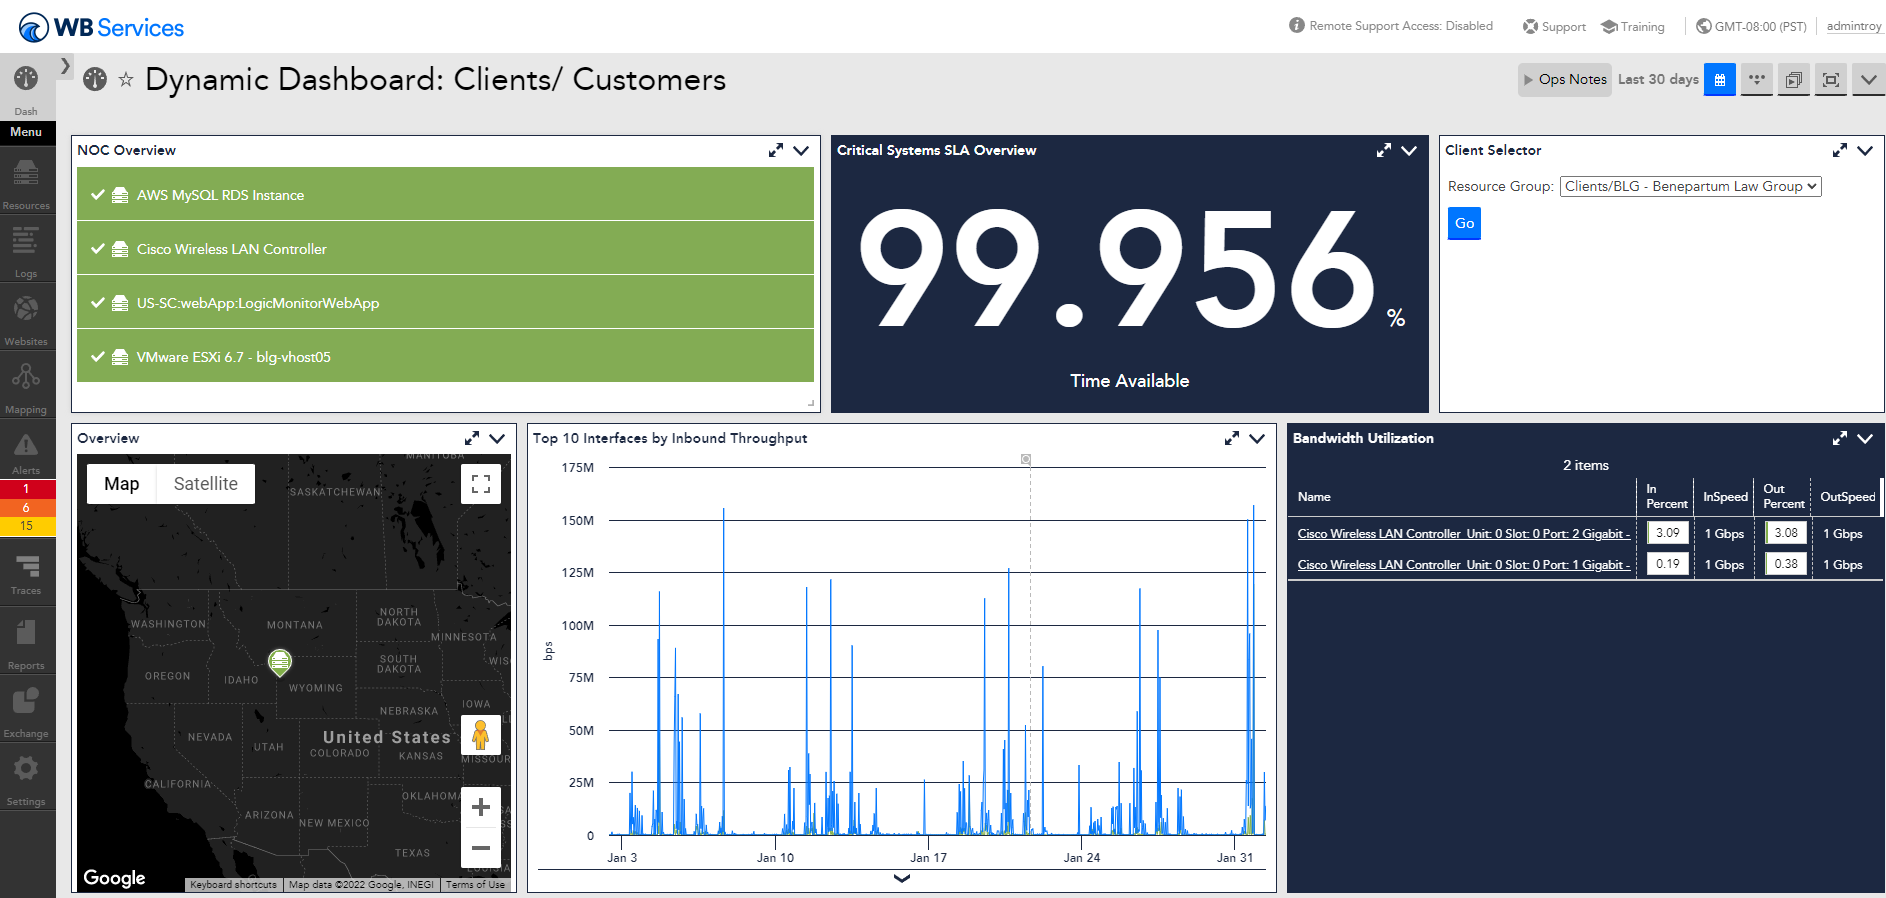
With powerful visualizations and custom dashboards, you can rapidly understand how your systems are connected and which issues impact performance.
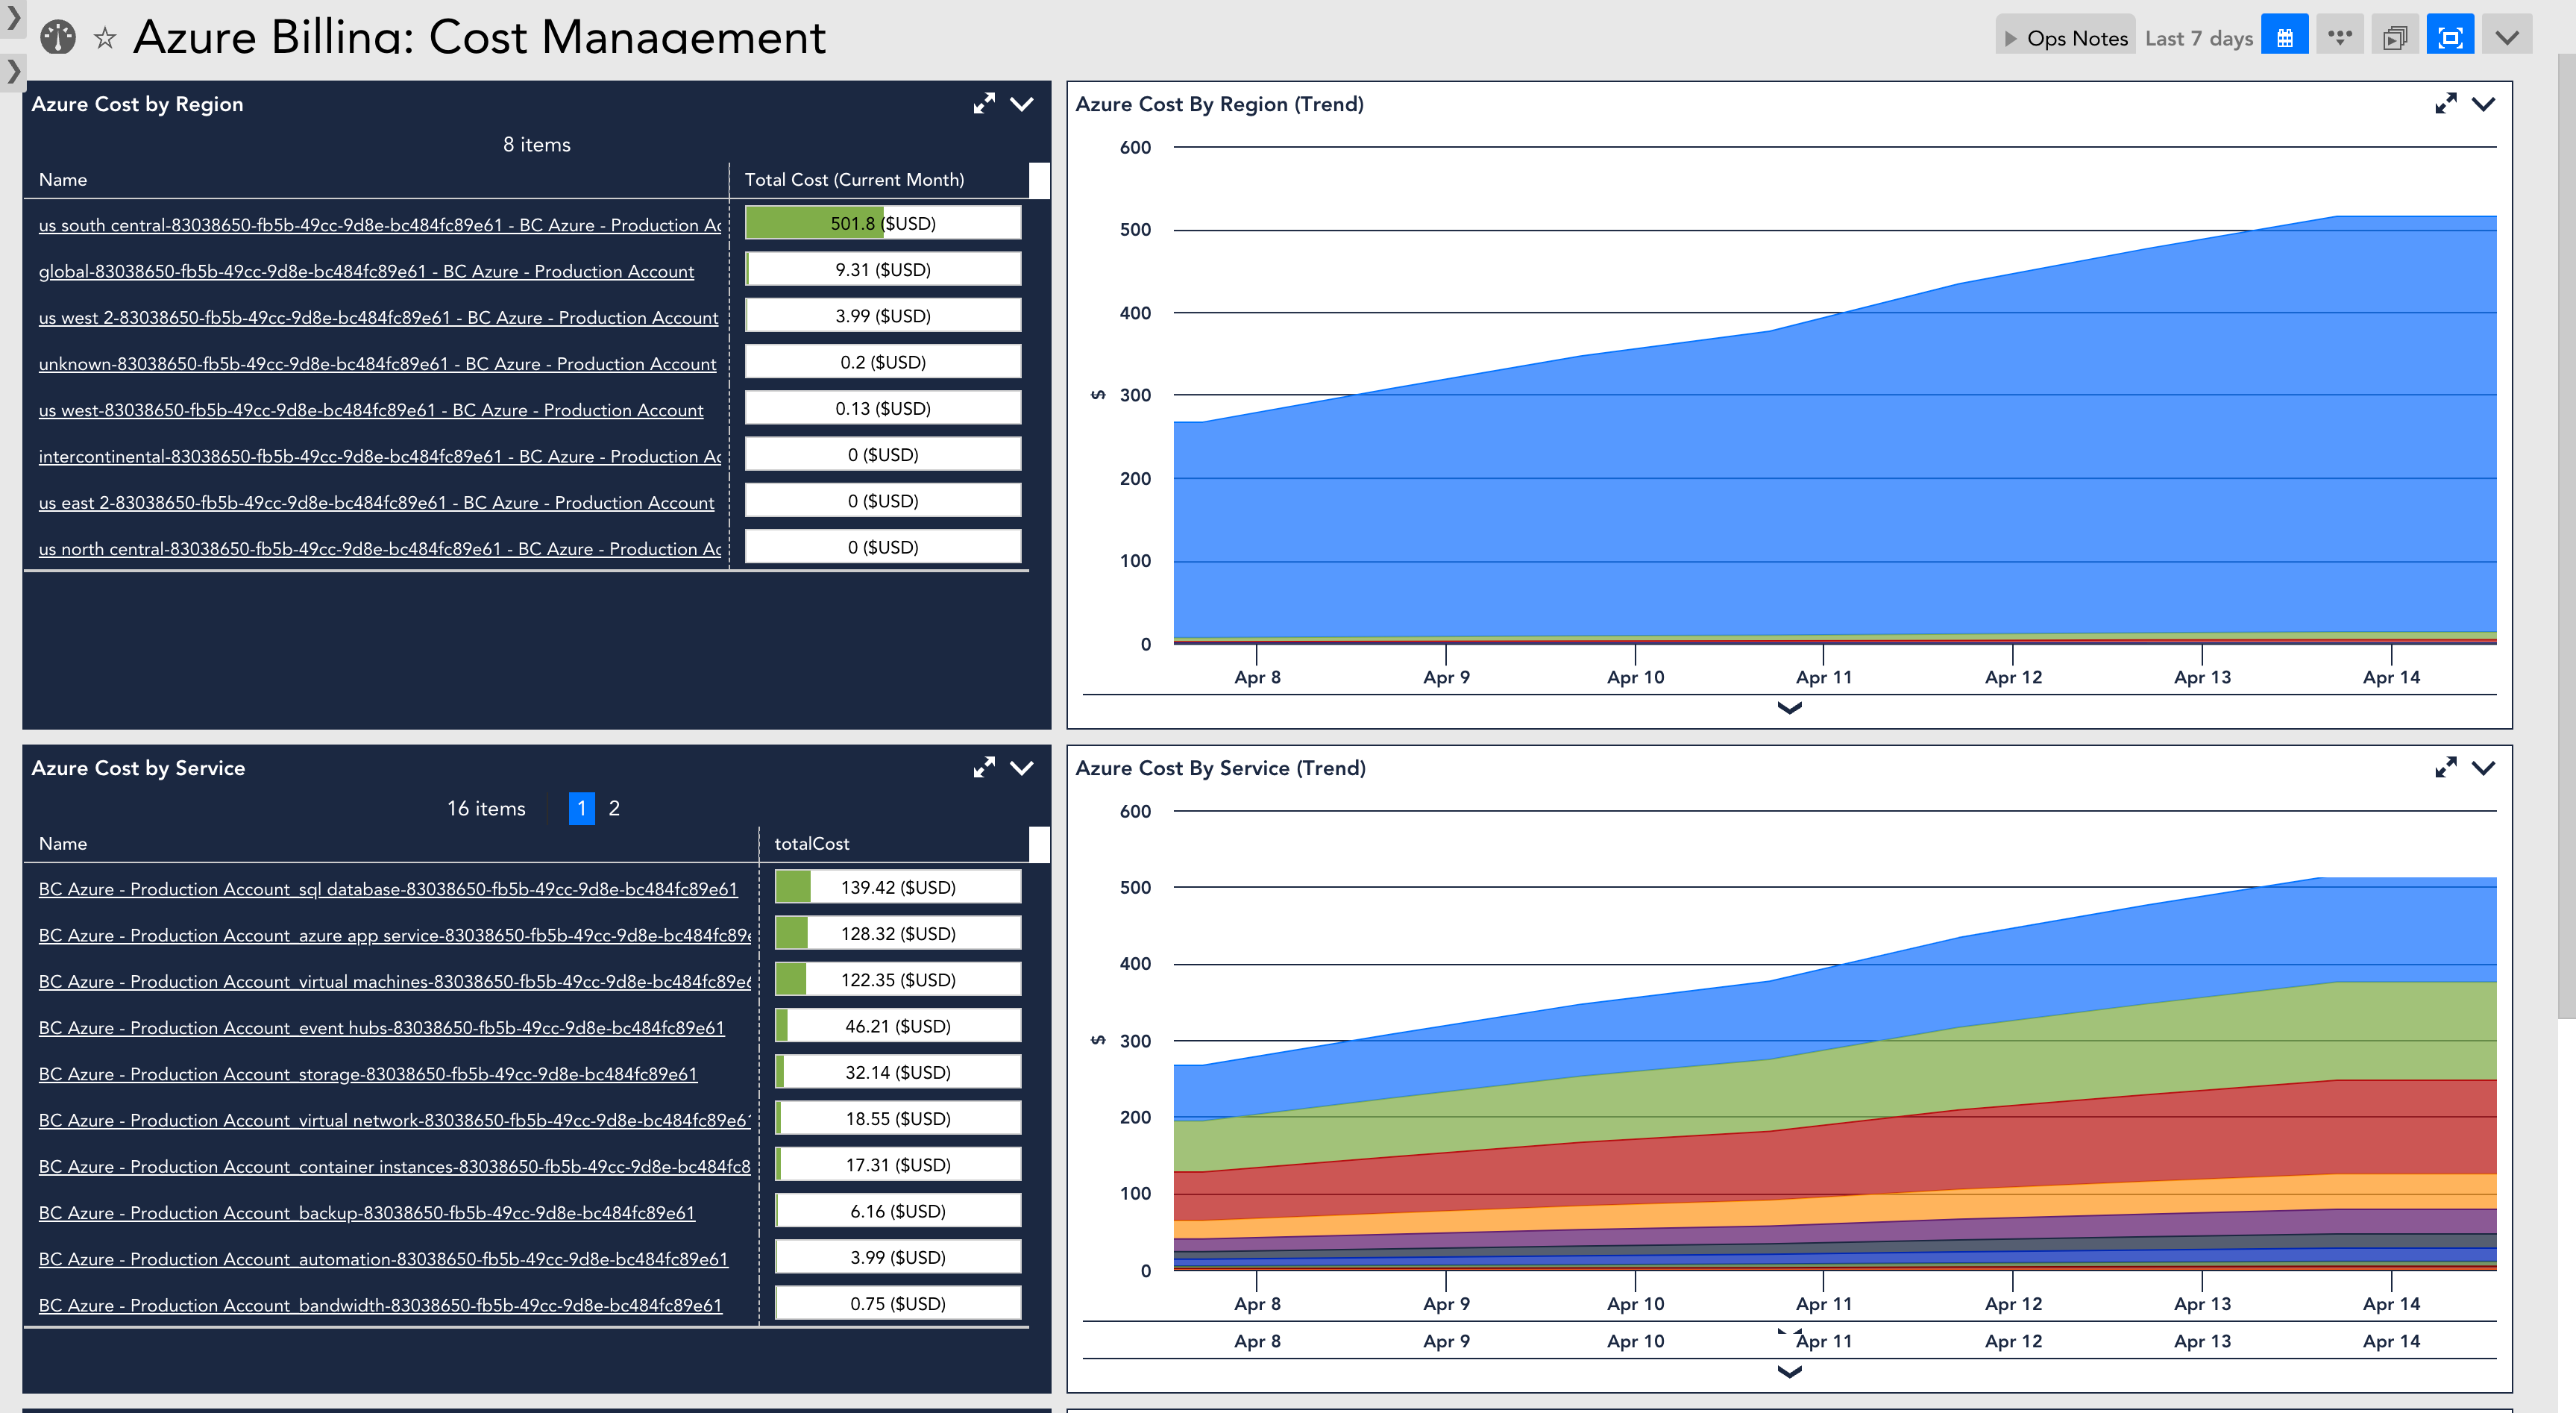
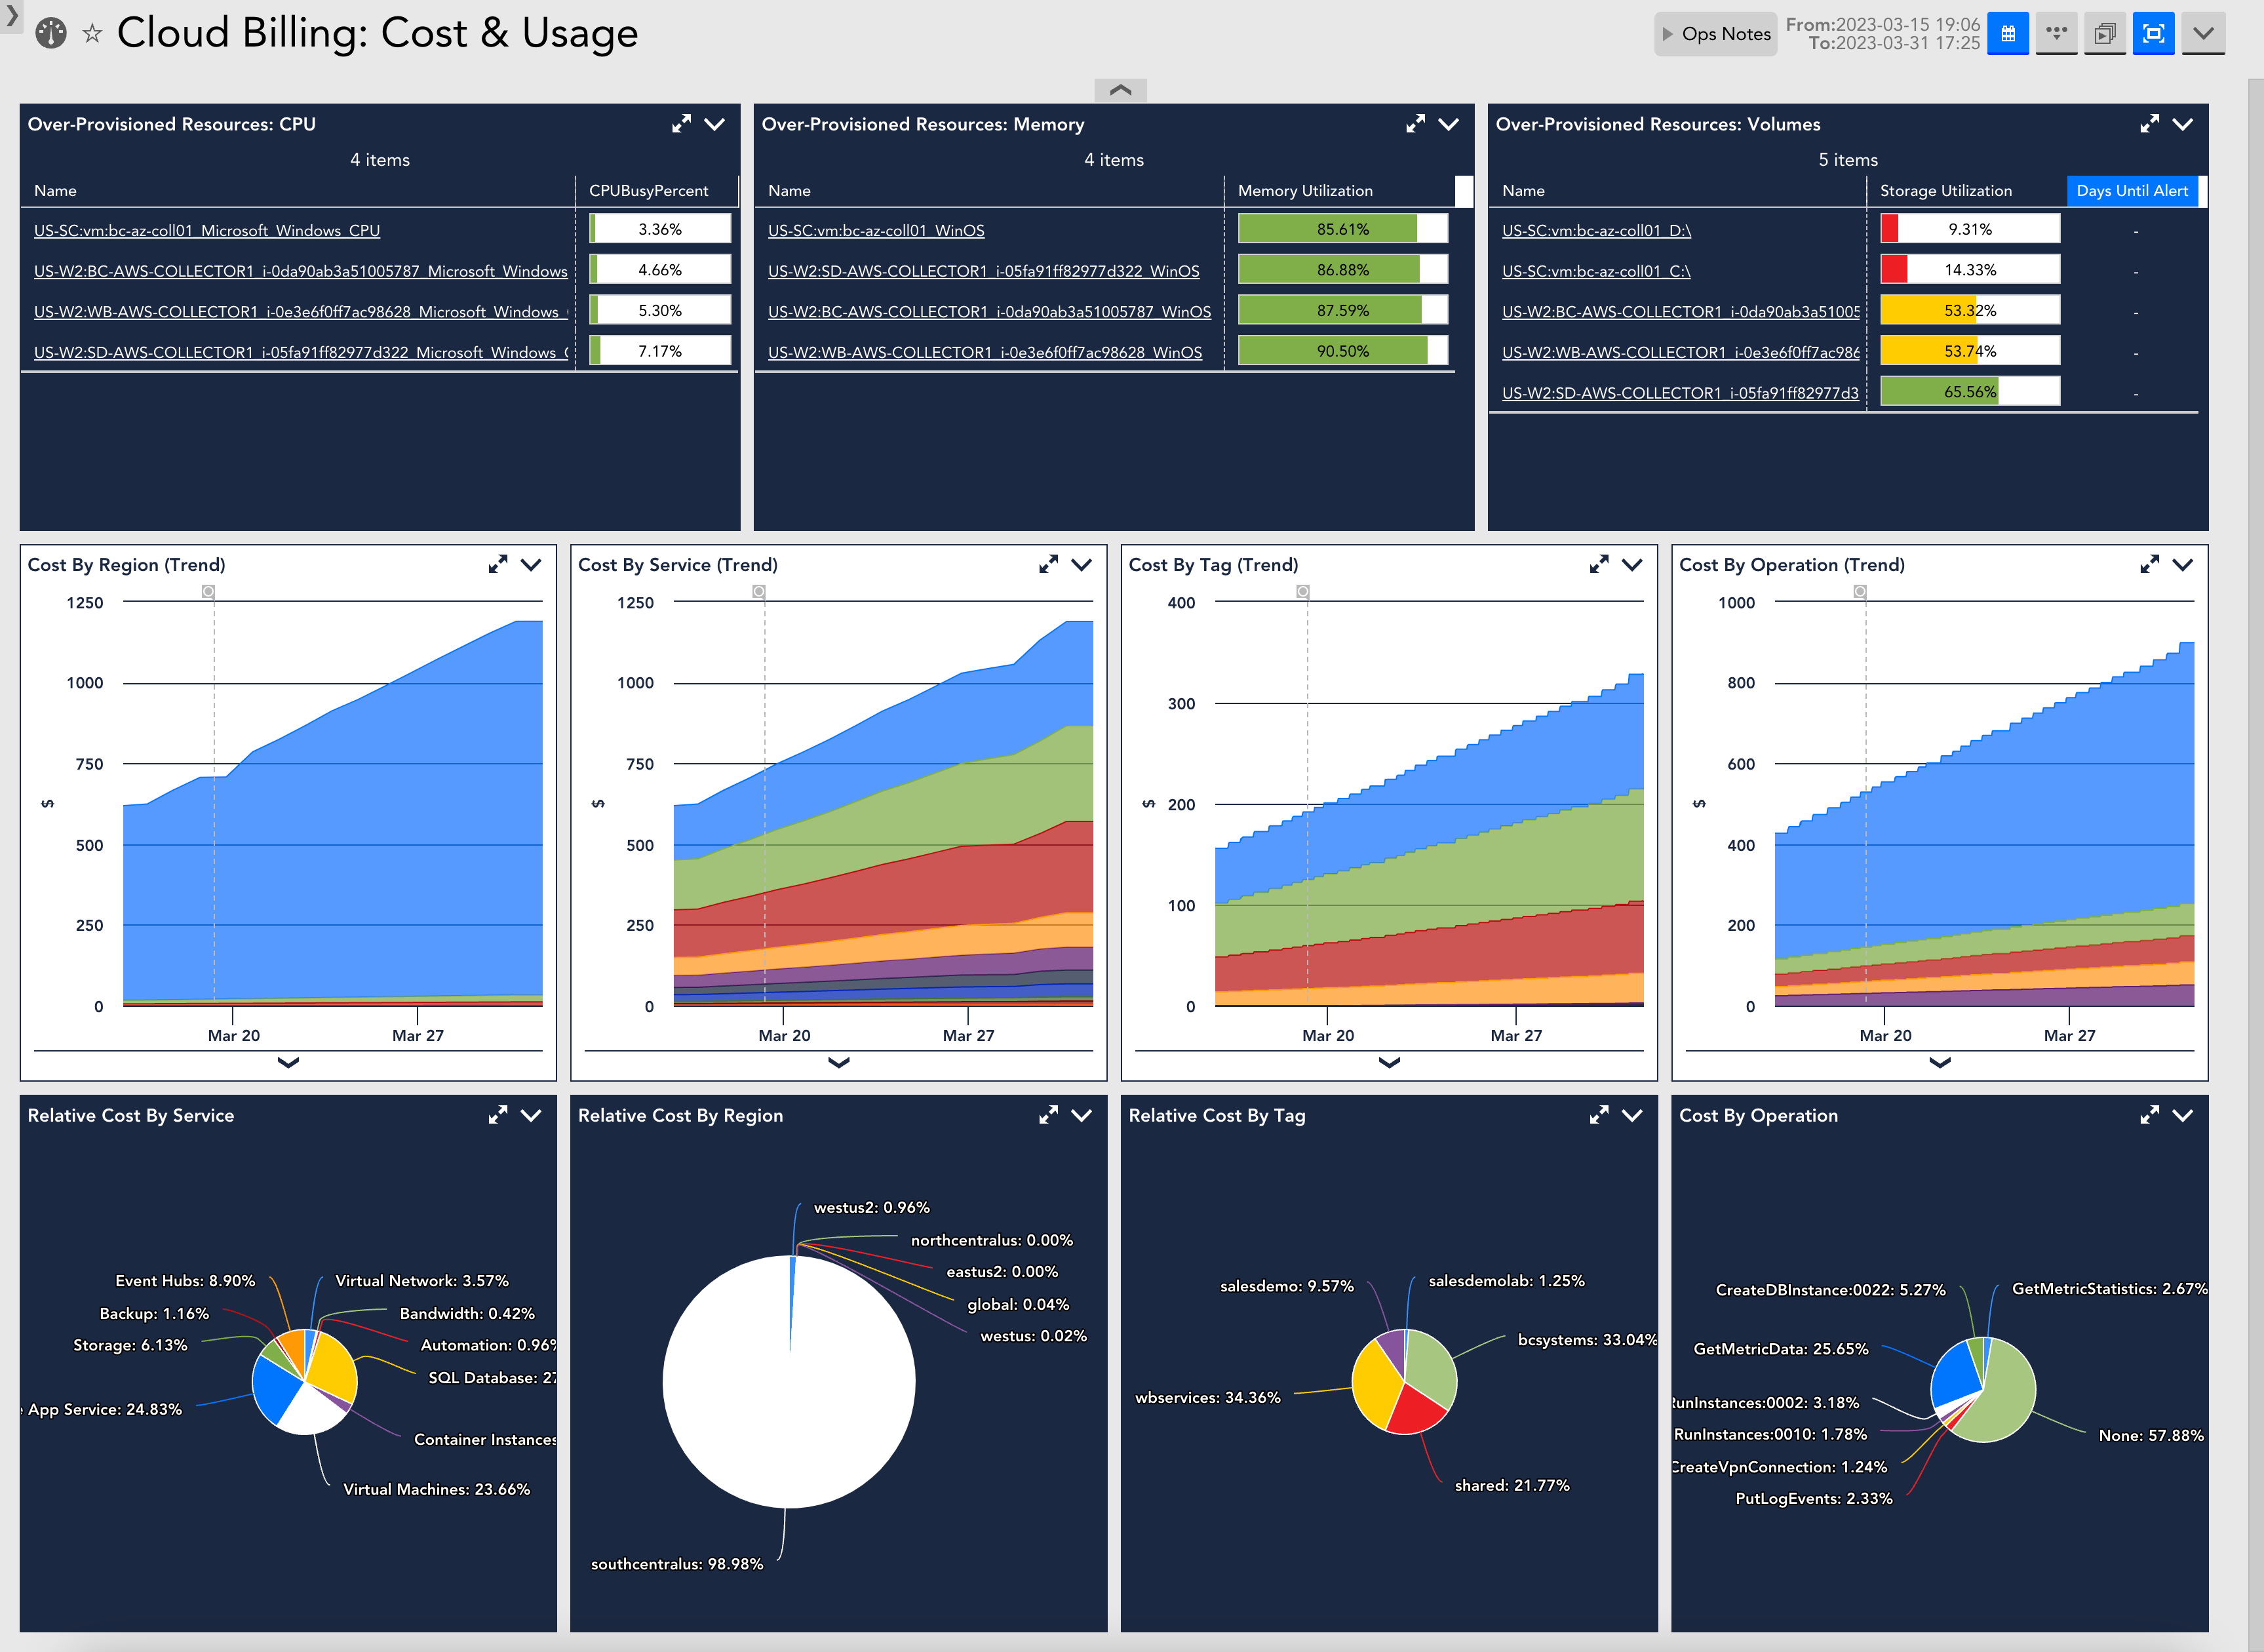
See ‘at-a-glance’ where you can cut costs and optimize spend with detailed ROI analysis. Automated alerts flag spend thresholds and reserved instance expirations. Make your business more predictable by using historical data to forecast future spend.
Get the coverage you need for any network
Easily map your networks to get the full picture
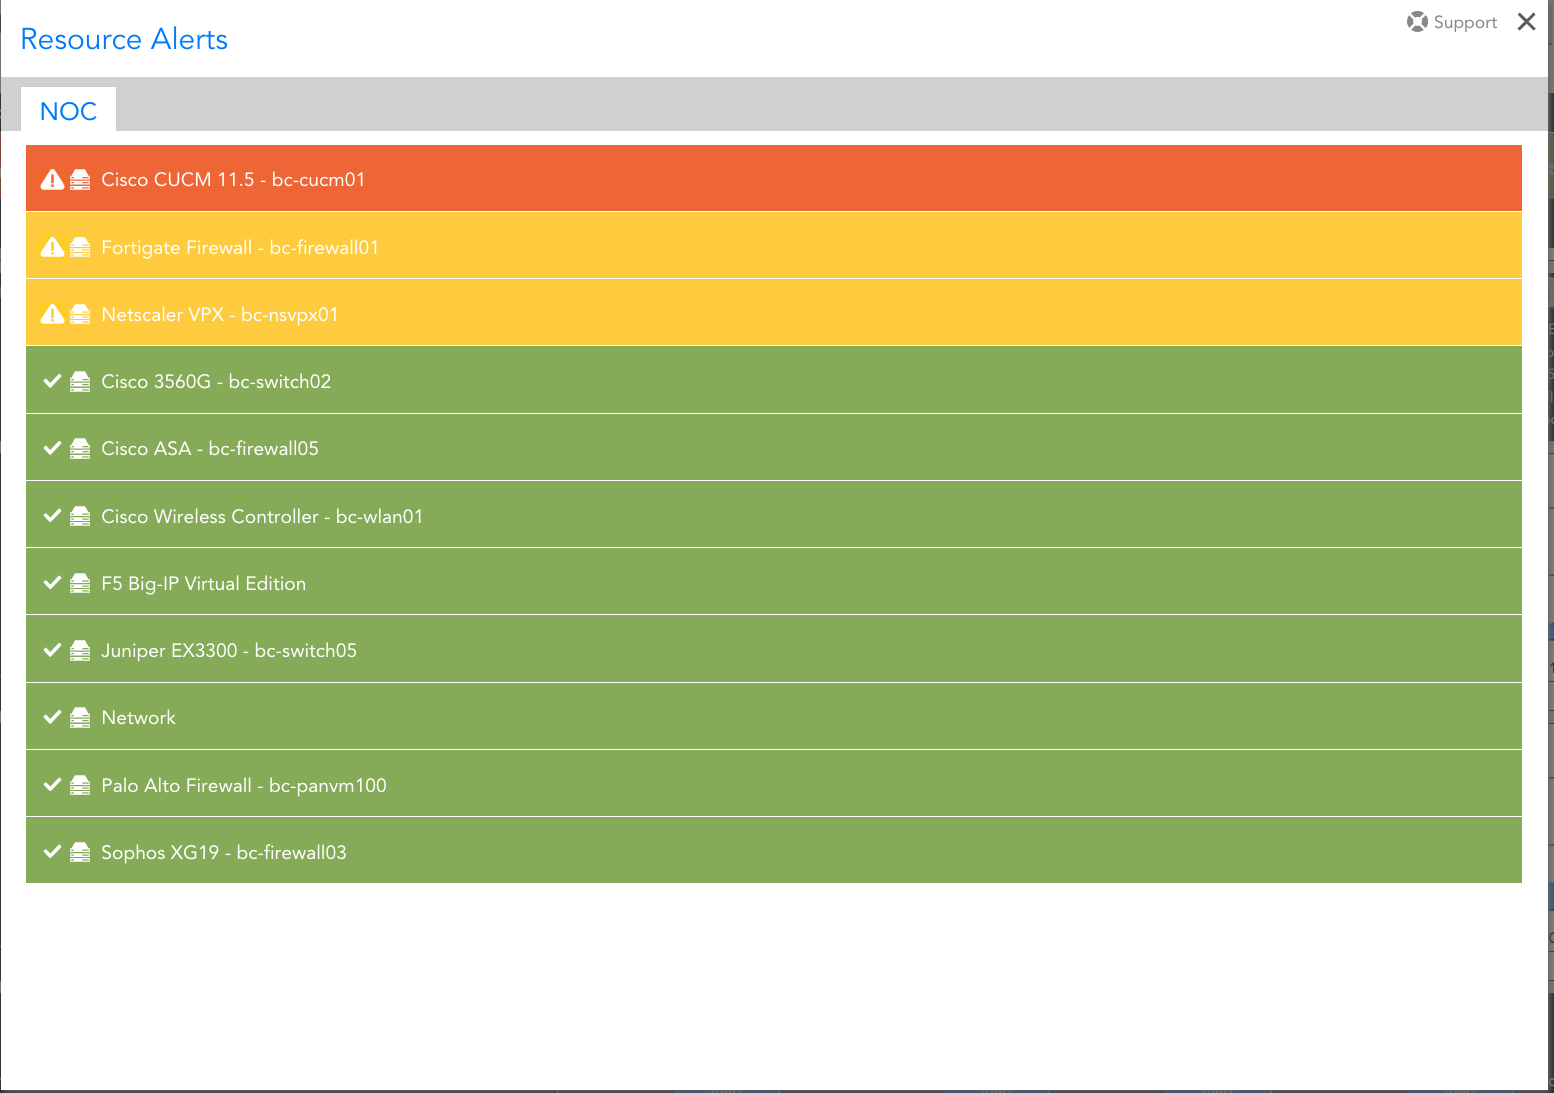
Set up proactive alerts to reduce network service impacts
Automated discovery
LogicMonitor uses a lightweight, agentless collector to discover everything you need to know about your network automatically. Just enter a hostname or an IP address, and within minutes you’ll have the monitoring, alerting, and graphing you need to maintain and optimize network infrastructure. Get the coverage you need for the most complex networks – whether those resources are on-premises, spread across multiple data centers, or in the cloud.
Unified platform
Give your teams holistic network and hybrid cloud monitoring for a consistent view across servers, databases, cloud, containers, networks, applications and more. Eliminate tool sprawl with deeper insights into the health and performance of your cloud, on-prem, and virtualized infrastructure within a single, unified platform. With LogicMonitor, scale your network devices without needing any other point solution.
Maximize service uptime with AWS, Azure, or GCP metrics and logs for insights into specific events happening across your multi cloud environments that may impact your infrastructure health.
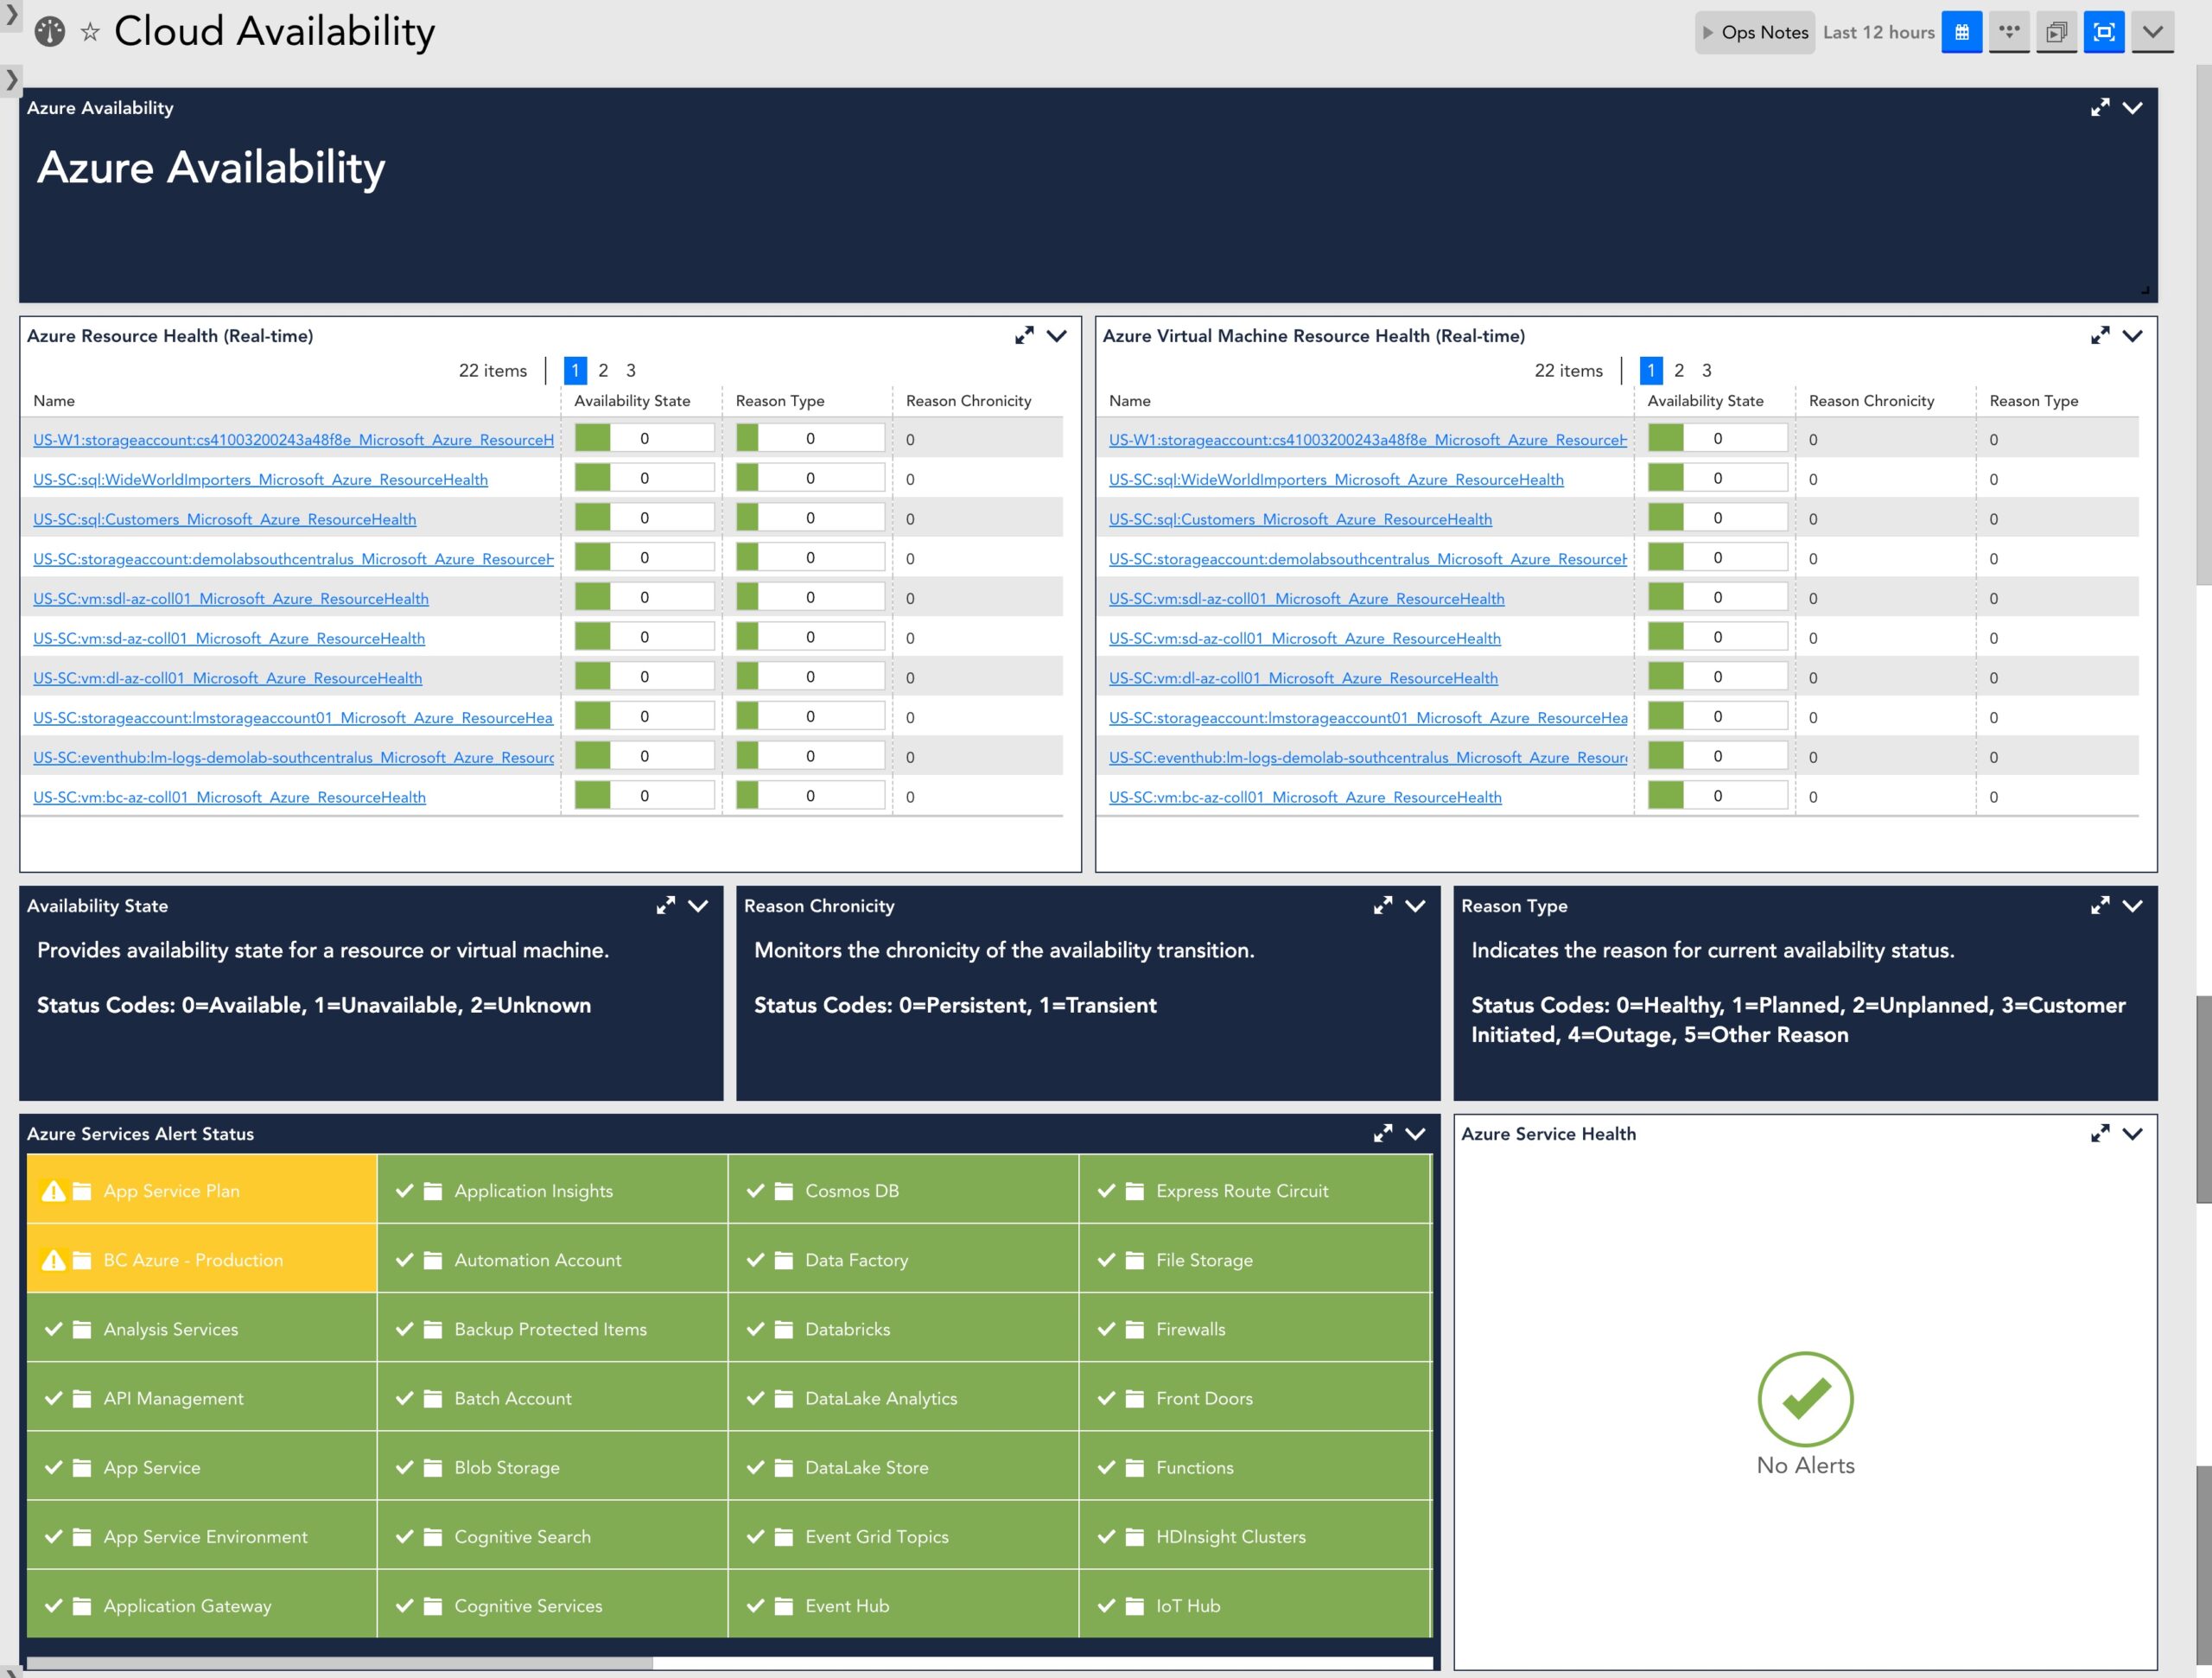
Alerting that’s as dynamic as your cloud environments. Enable IT and cloud operations teams to focus on the right insights at the right time.
Reduce alert noise so you can focus on solving the problems that matter.
Control surprise overages. Easily visualize spend alongside resources and find opportunities to cut costs with detailed ROI analysis.


REPORT
Compare the Top Cloud Monitoring Software of 2024 from validated, third-party data.
REPORT
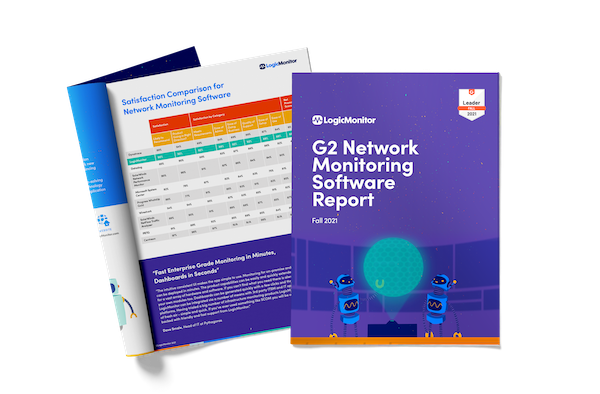
See how LogicMonitor’s network monitoring stacks up in this comprehensive report by G2, the world’s largest B2B software review platform.
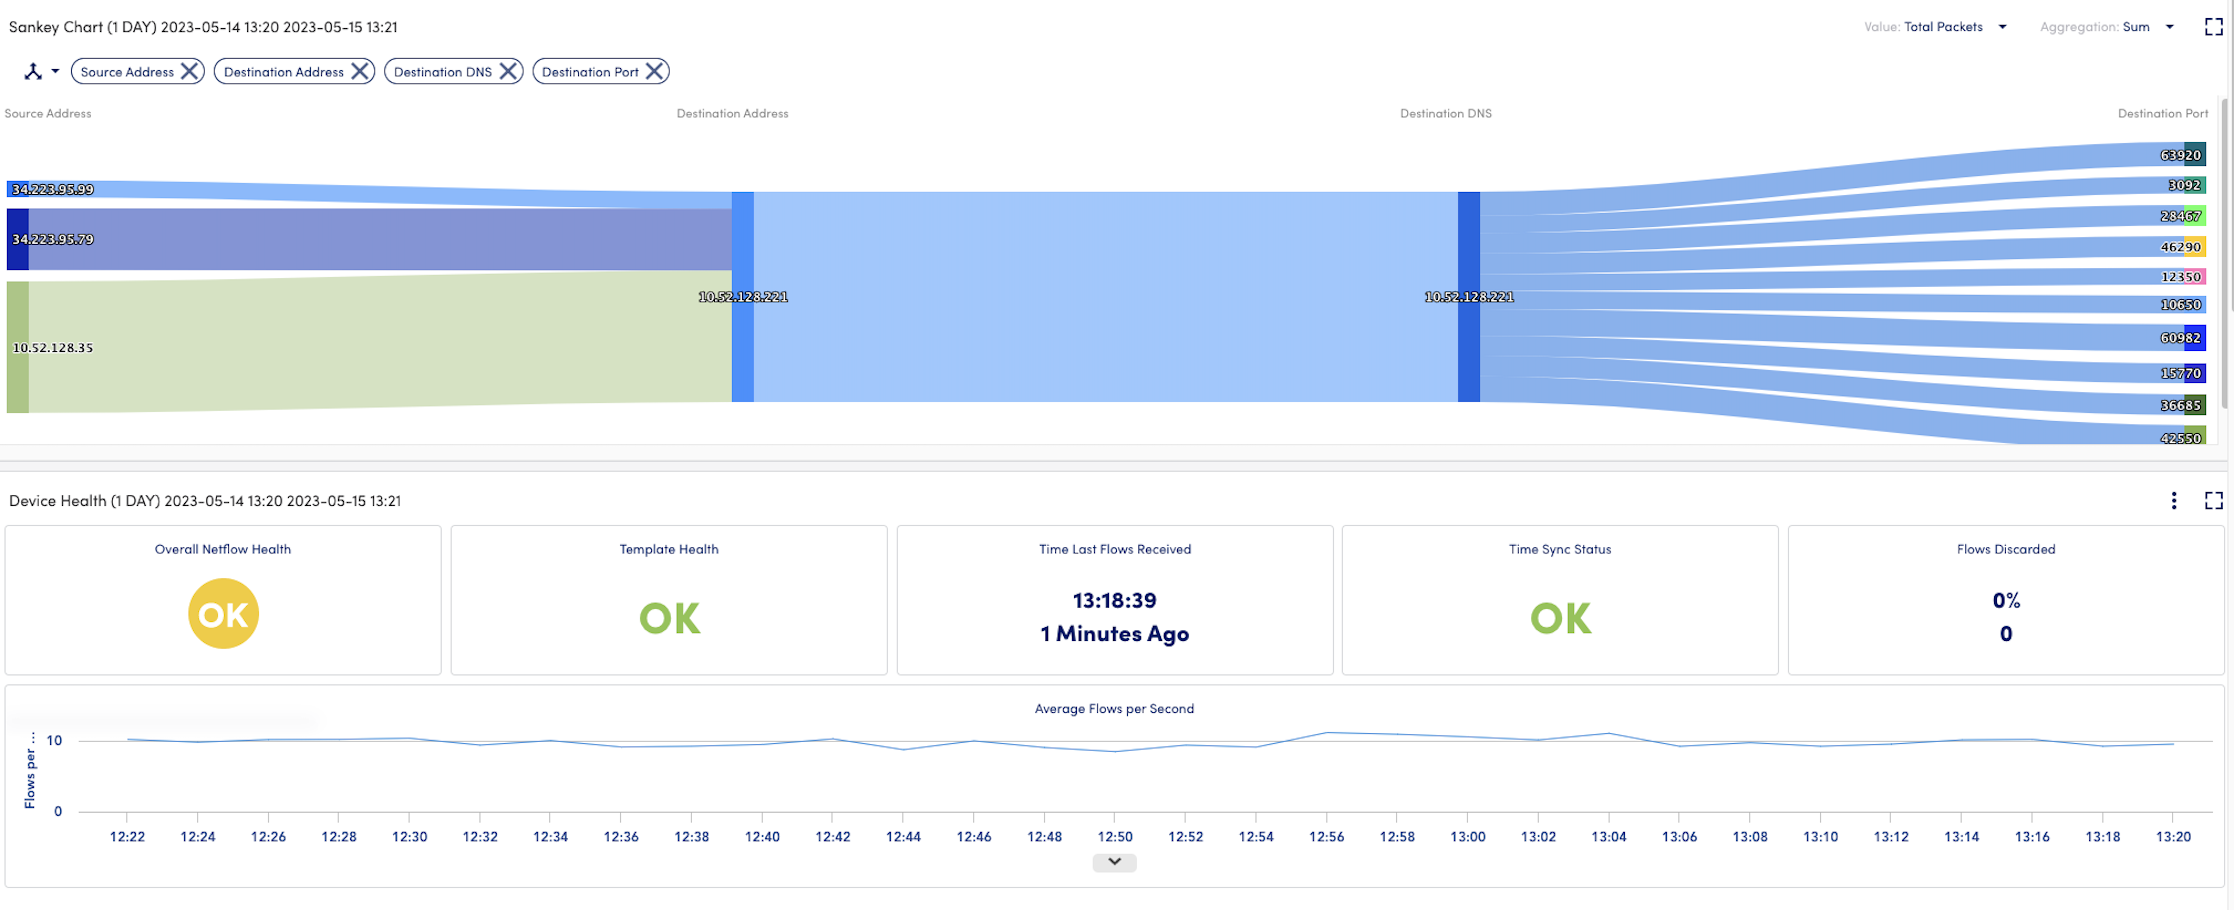
Get proactive visibility into what’s going through your network using LogicMonitor’s network traffic flow monitoring capabilities.
Instead of using one tool to track NetFlow/Jflow/Sflow data and another to provide monitoring and alerting for your routers, switches, firewalls, servers, storage, and applications – LogicMonitor’s 1500+ integrations allow you to analyze and optimize your entire network infrastructure from one platform.
Get full visibility into what’s going through your network using LogicMonitor’s network traffic flow monitoring capabilities.
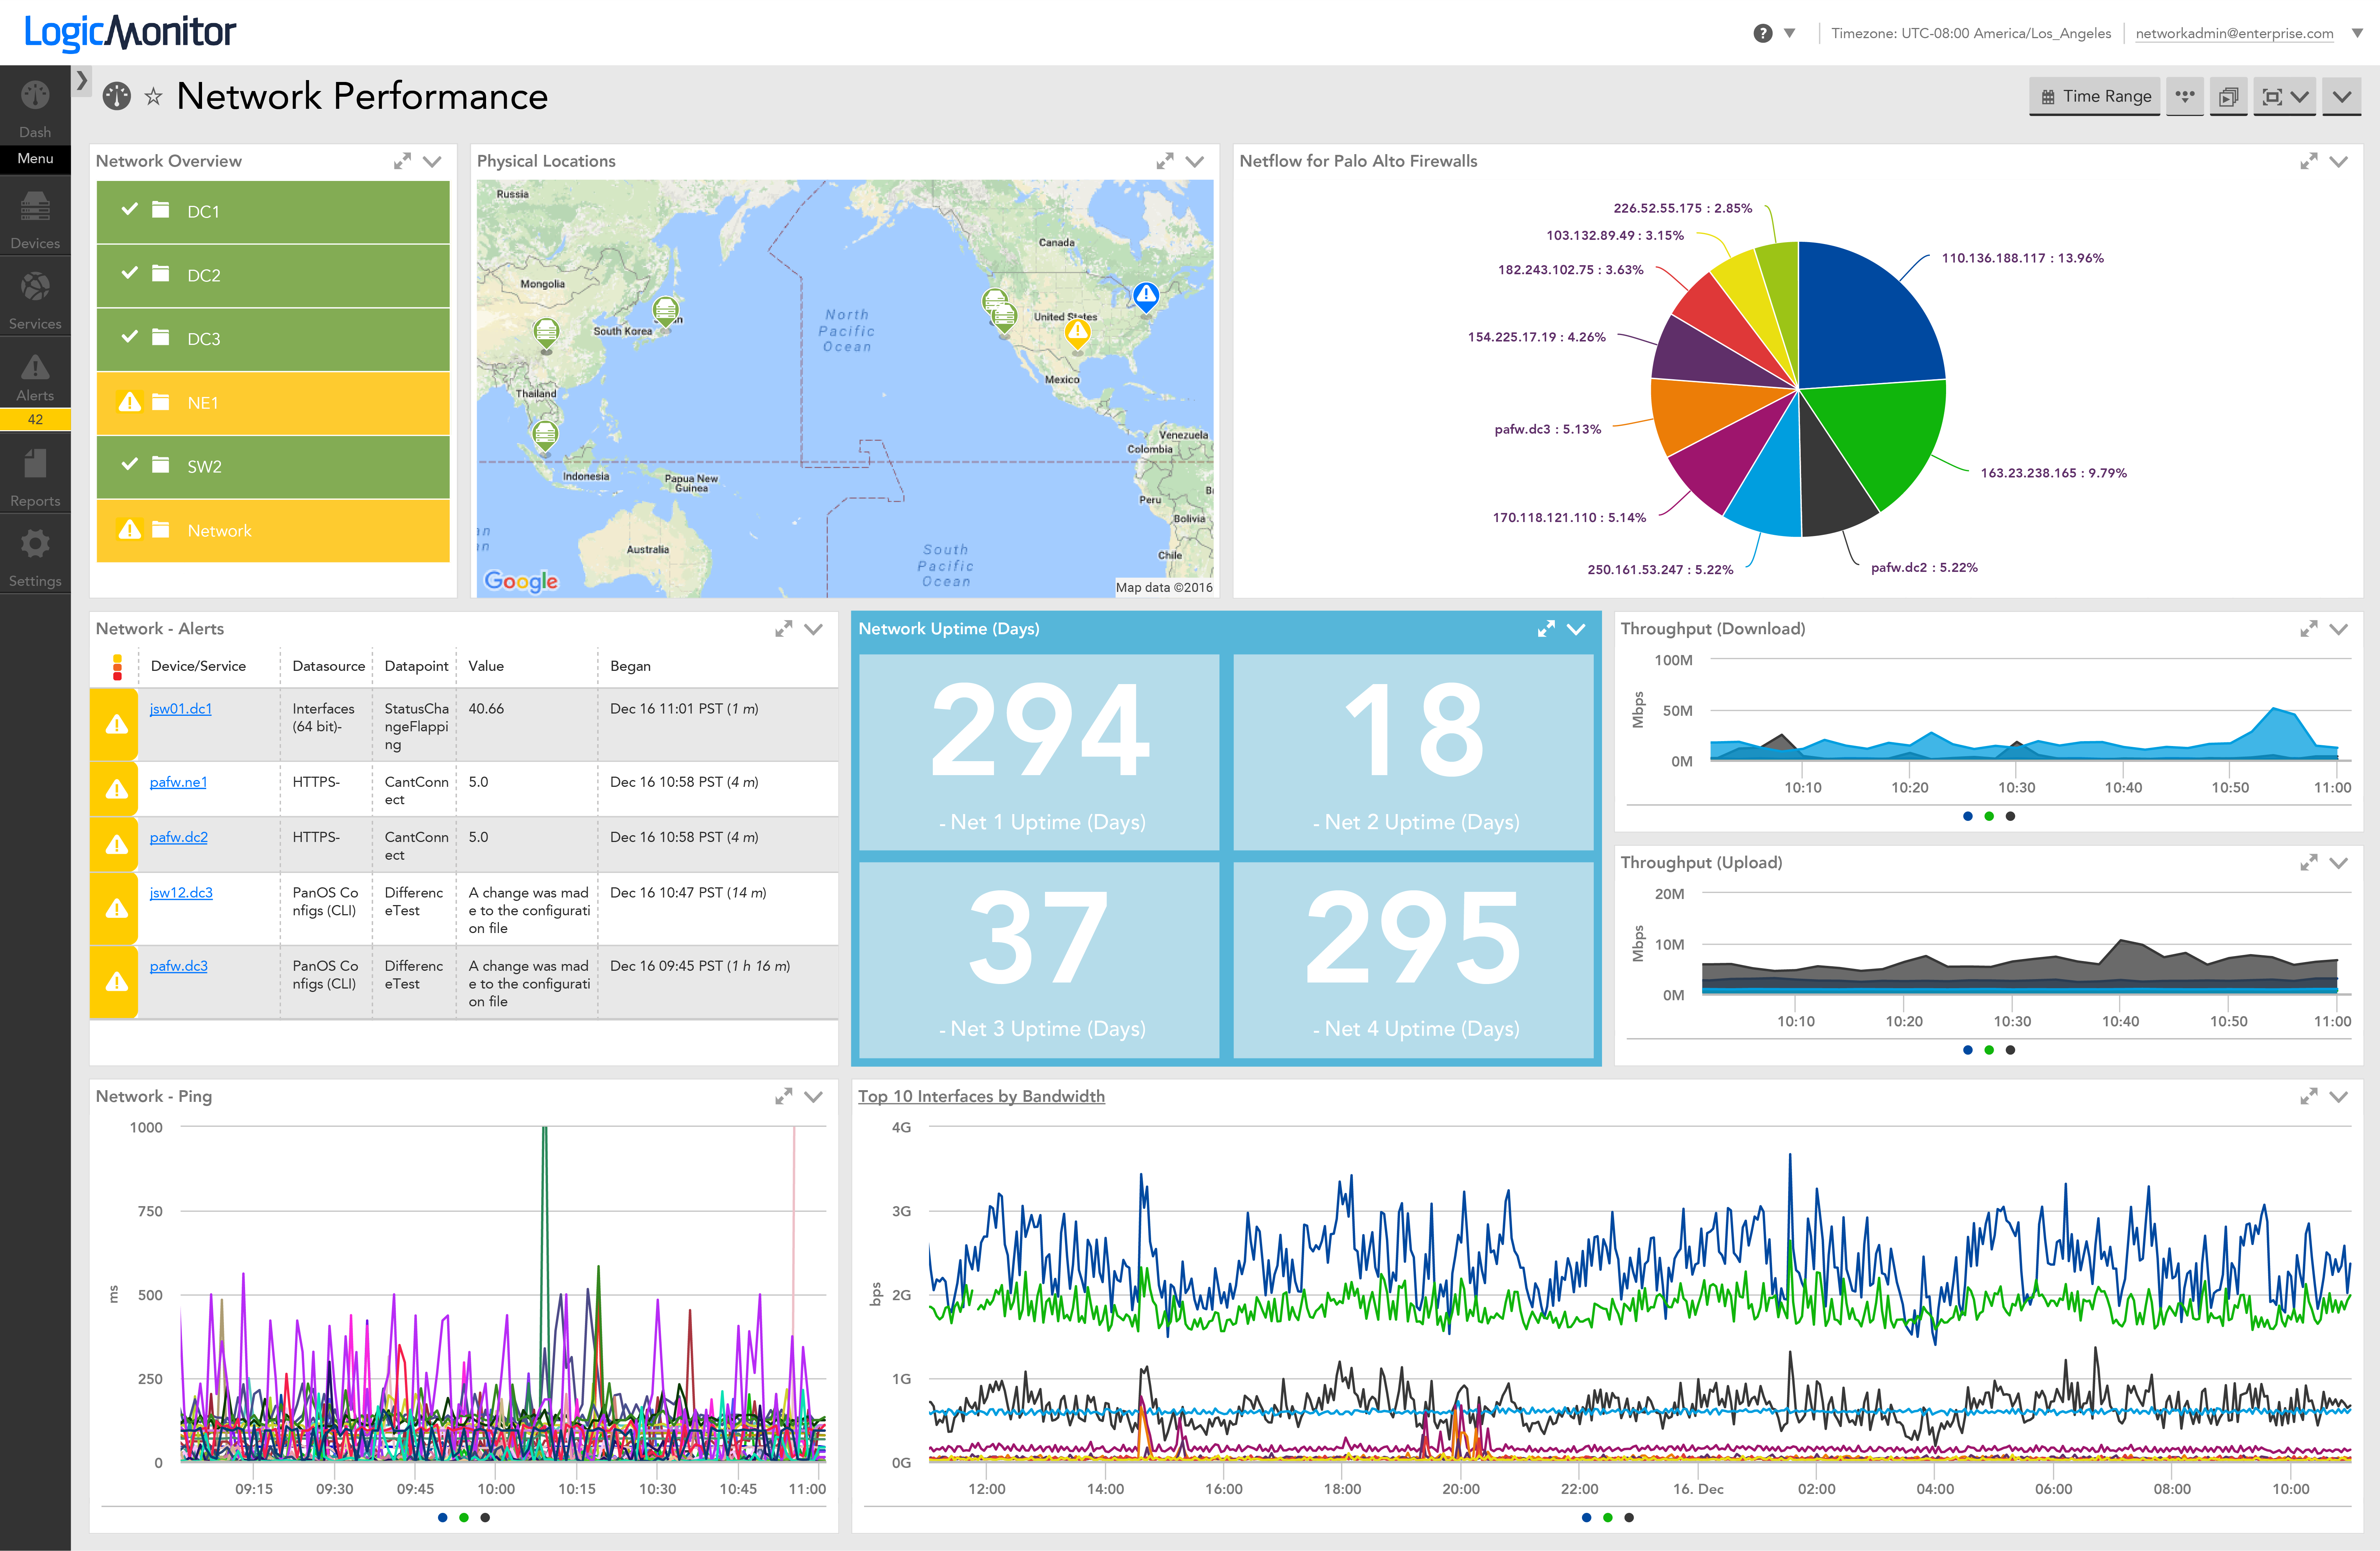
Proactively manage challenging network conditions such as congestion and over-consumption of network resources with deep analysis of:


Automated alert thresholds and customizable alerts help teams respond to performance issues faster.
Support every team with integrations for HipChat, Slack, Pagerduty, Connectwise, ServiceNow and more.
Chat with our engineers 24/7, 365 days a year to tackle tough issues and shorten MTTR.
Get the cloud-based monitoring platform used by IT Ops teams to monitor MySQL and improve database performance.
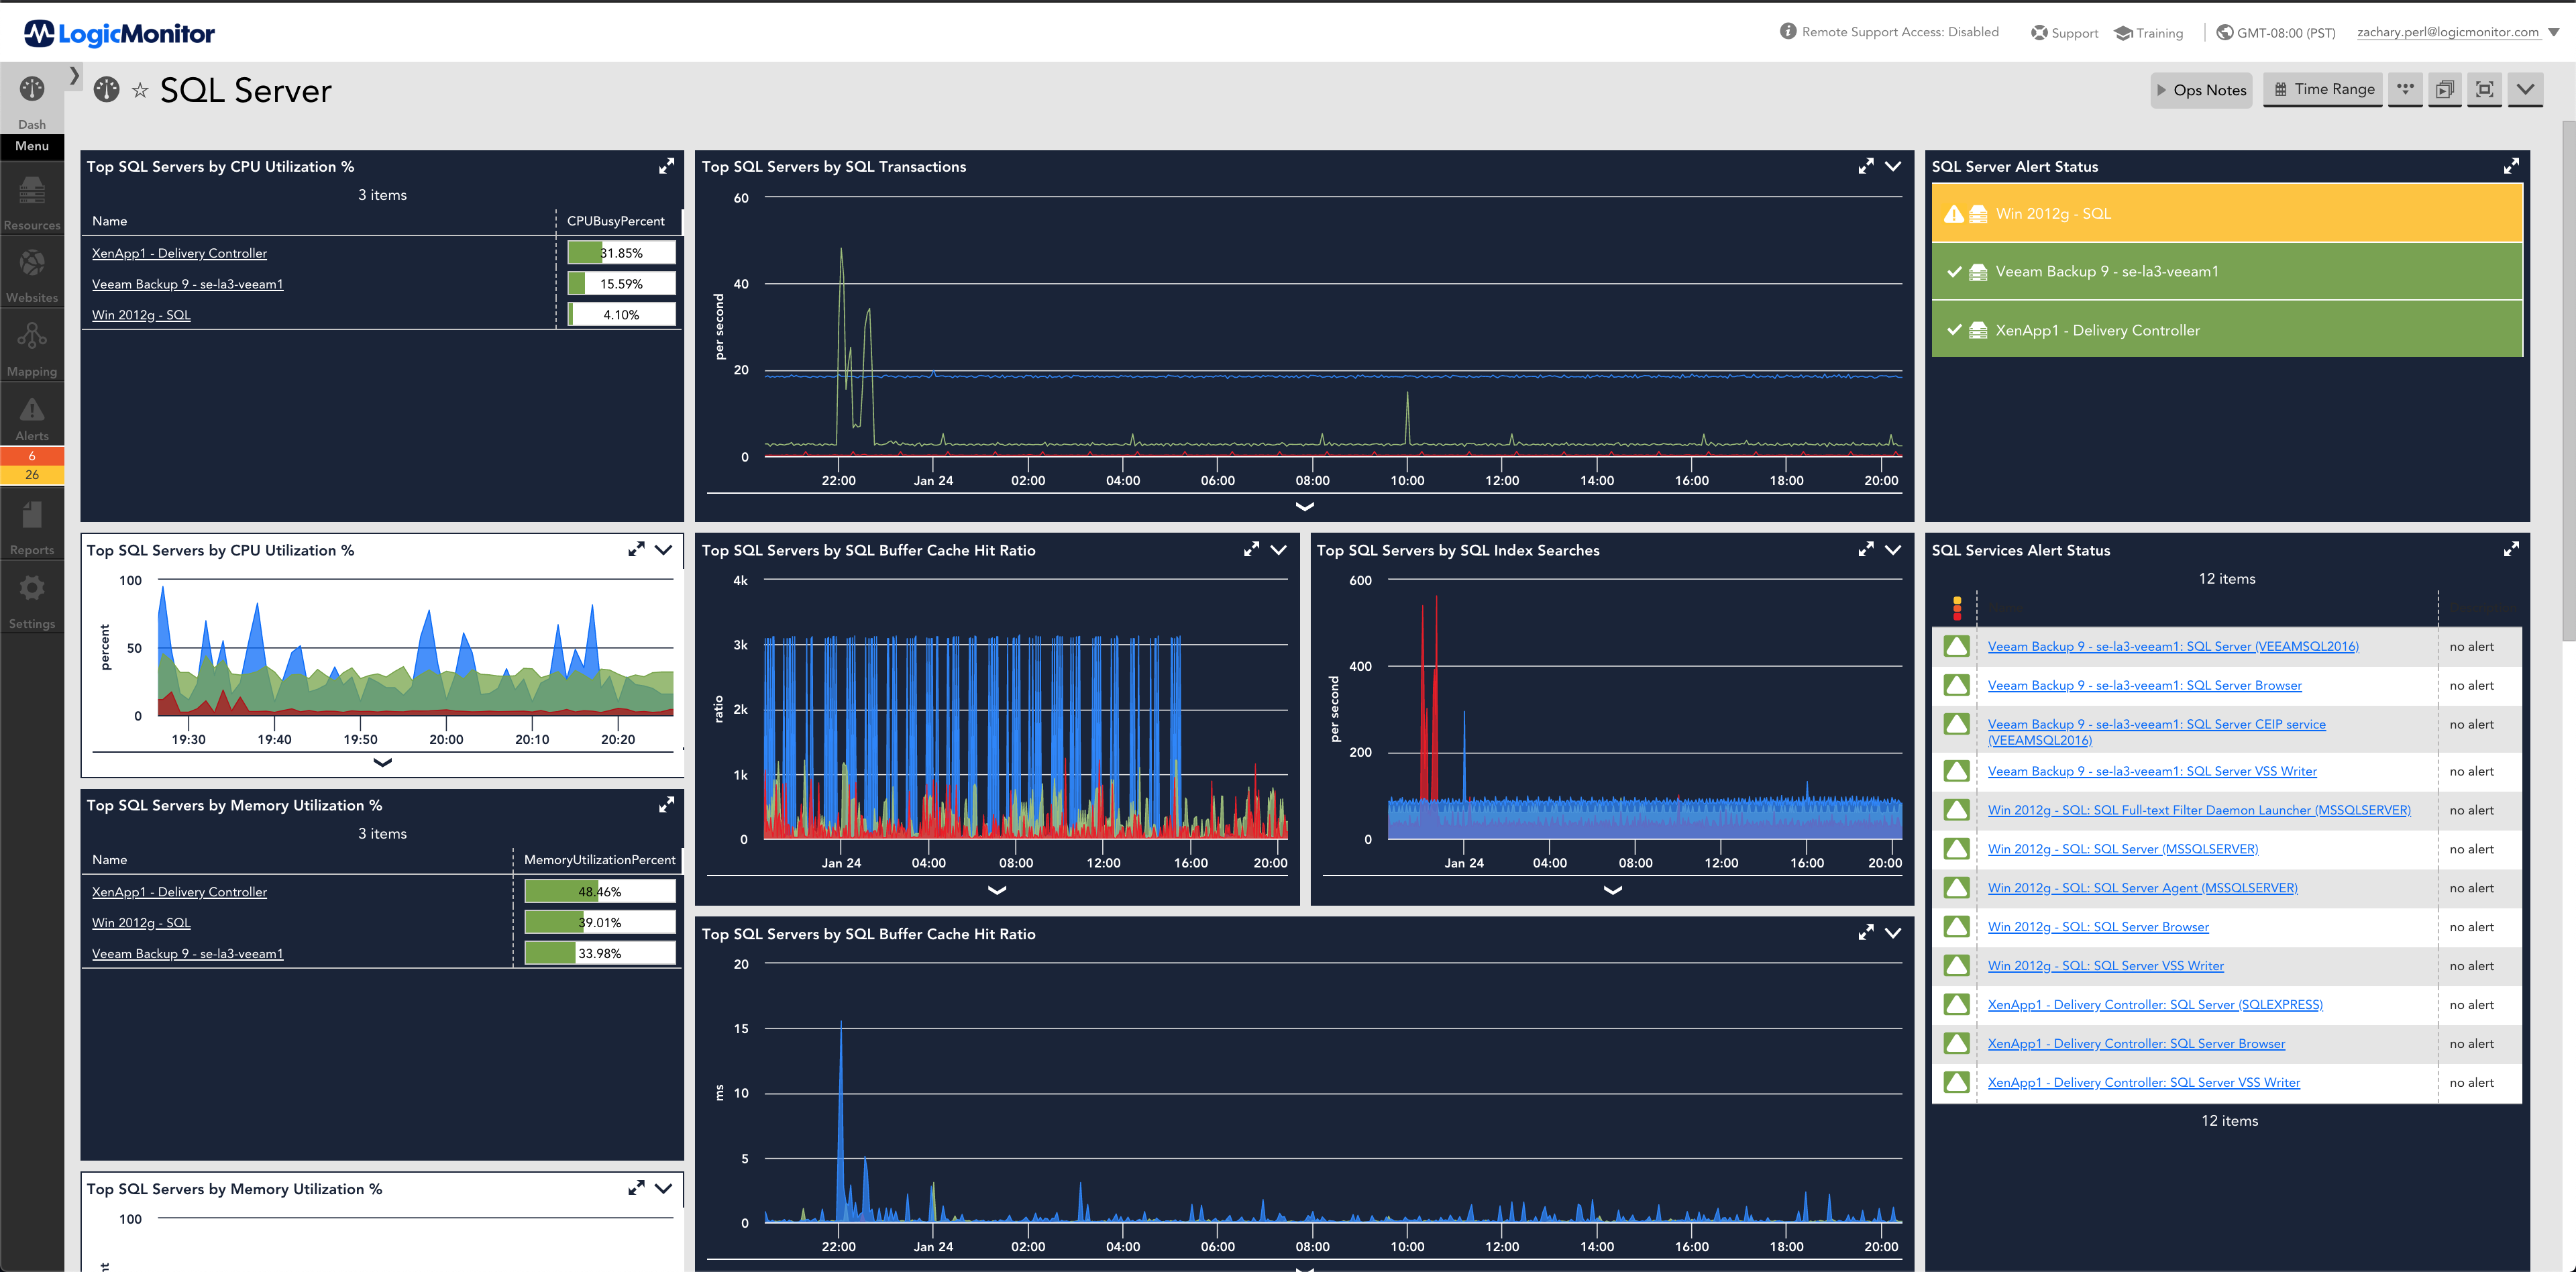
No monitoring system makes it easier to monitor MySQL and the rest of your infrastructure than LogicMonitor. Skip the hours manually configuring and maintaining other MySQL monitoring systems. Simply enter your hostname and you’re done.
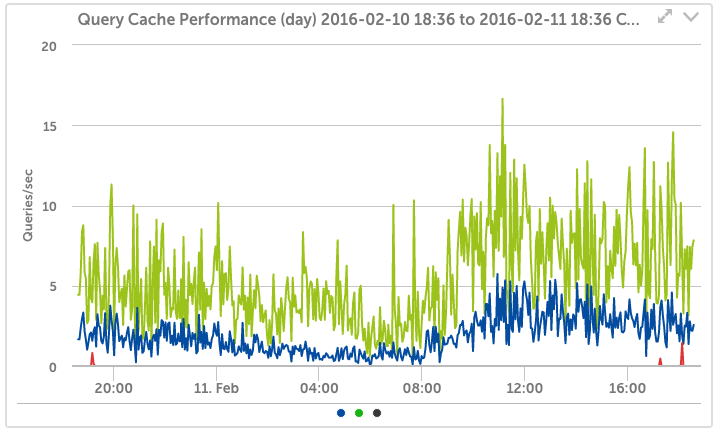
One of the more important elements for database tuning, LogicMonitor tracks your query cache hit ratio, as well as trending the activity. LogicMonitor’s intelligent multi-variable alerts can analyze and recommend different tuning options for the query cache – enlarging it, reducing it, or disabling it, in response to your usage.
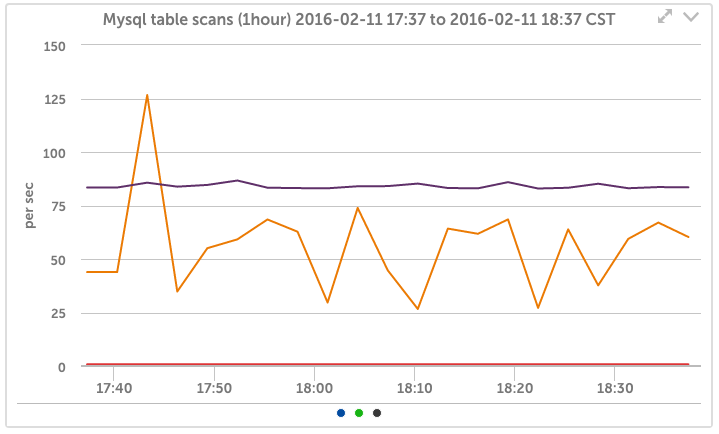
An essential metric to trend over time – watching your table scan rates can tell you whether indexes are being used effectively, or whether the new application your team released is slowing the database due to the spike in table scans.
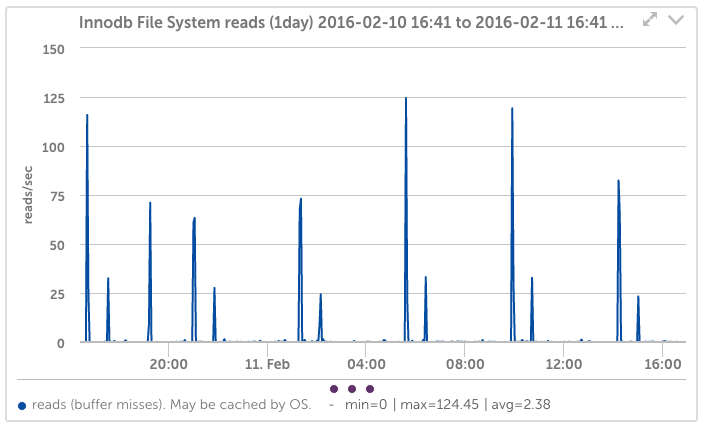
LogicMonitor will detect the storage engines in use and track detailed statistics. Being able to see trends in “InnoDB buffer cache misses over time” is essential for proper MySQL tuning. (LogicMonitor even detects if you are using the Percona builds of InnoDB and adds monitoring for that).
A single platform for ITOps and DevOps eliminates data silos and tracks metrics that matter. Built with hybrid infrastructure in mind, a vendor-neutral approach helps IT teams better understand the user experience and accelerate business transformation.
Log intelligence at scale – instant access to contextualized and correlated logs and metrics in a single, unified cloud-based platform. With tiered retention options, including unlimited retention, and hot storage to optimize data hygiene and internal compliance initiatives.
Never miss an application error, improve code quality, and diagnose and fix issues faster. Gain insight into the performance of the entire app stack, from code to cloud, to ensure a flawless customer experience in agile environments.
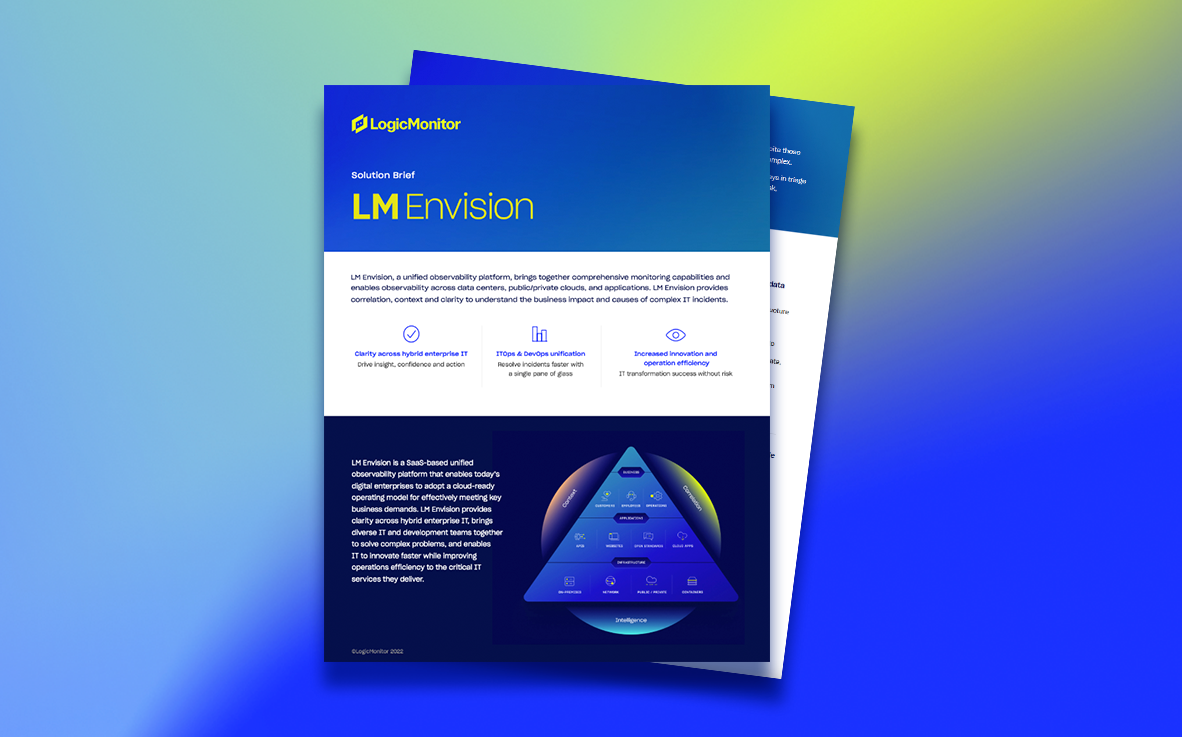
LM Envision, a unified observability platform, brings together comprehensive monitoring capabilities and enables observability across data centers, public/private clouds, and applications. LM Envision provides correlation, context, and clarity to understand the business impact and causes of complex IT incidents.
Challenges
Digital transformation in enterprise IT is creating significant breakthroughs in business opportunities. But despite these developments, operating in hybrid IT while adopting new cloud technologies at scale can impact productivity, and traditional monitoring solutions fail to align with the sophisticated and dynamic ecosystems of modern enterprises.


DIRECTOR
MEDIUM ENTERPRISE FINANCIAL SERVICES COMPANY
LM Envision, a unified observability platform, brings together comprehensive monitoring capabilities and enables observability across data centers, public/private clouds, and applications. LM Envision provides correlation, context and clarity to understand the business impact and causes of complex IT incidents. Read the solution brief to learn more!
Check out this buyer’s guide to learn more about today’s IT landscape, what to look for while evaluating a monitoring vendor, and how to modernize your monitoring.
Check out this webinar to learn about the causes of tool sprawl, why Ops teams struggle with it, and how to solve these challenges within your organization.

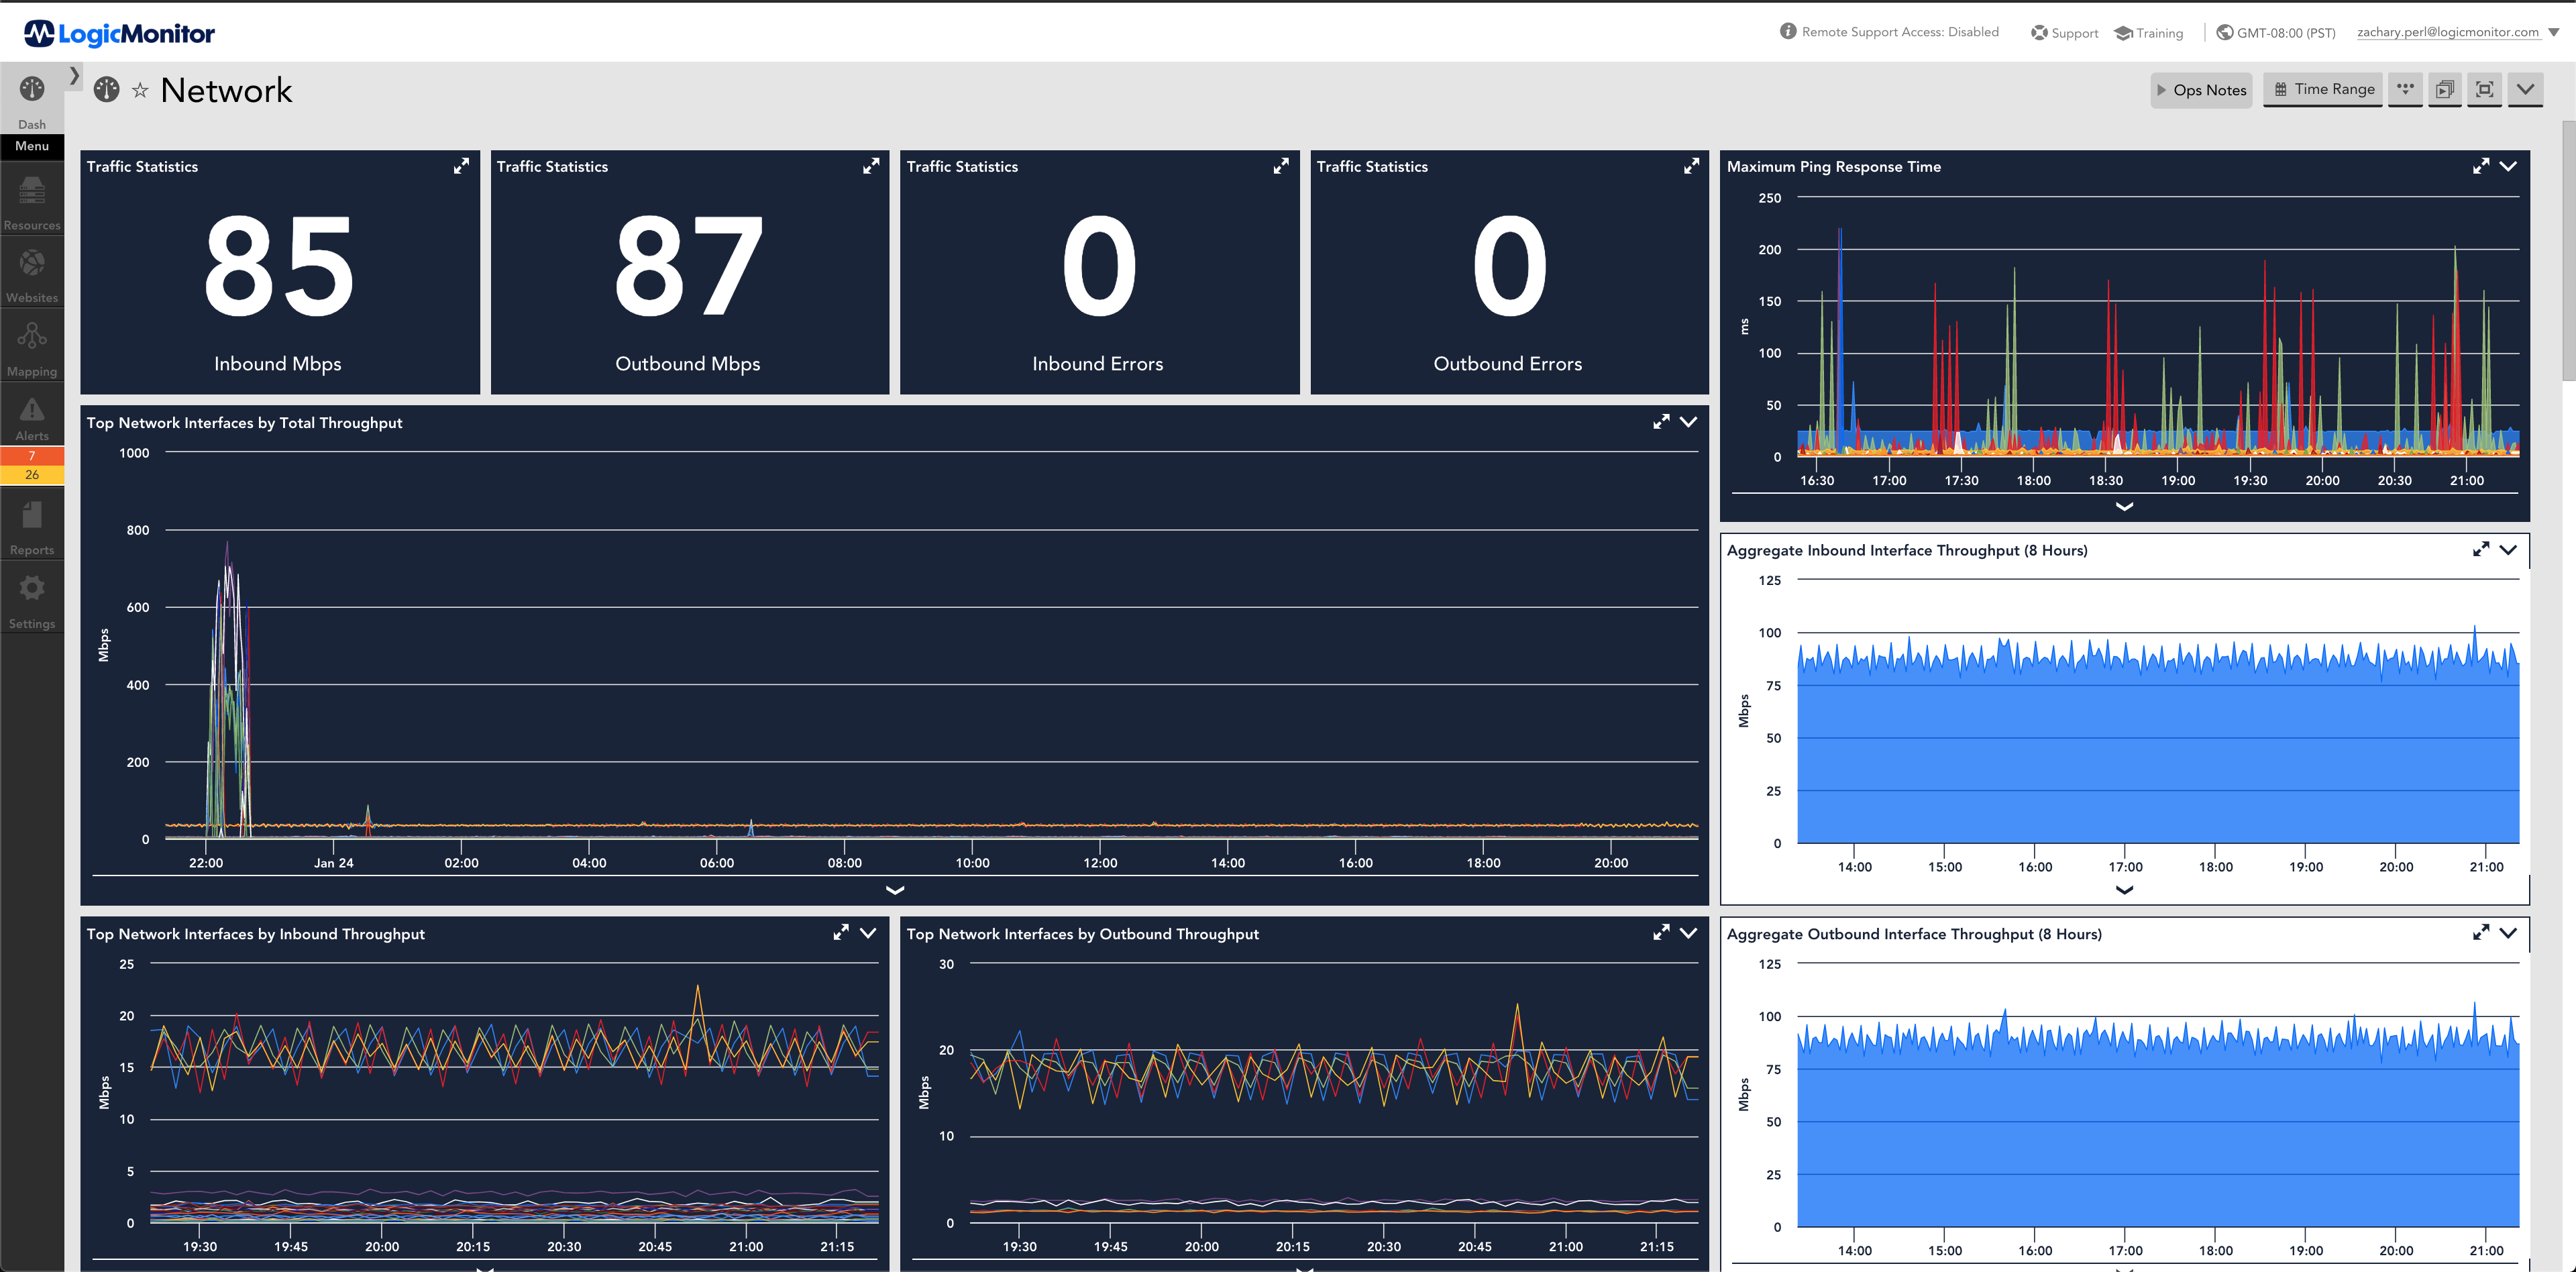
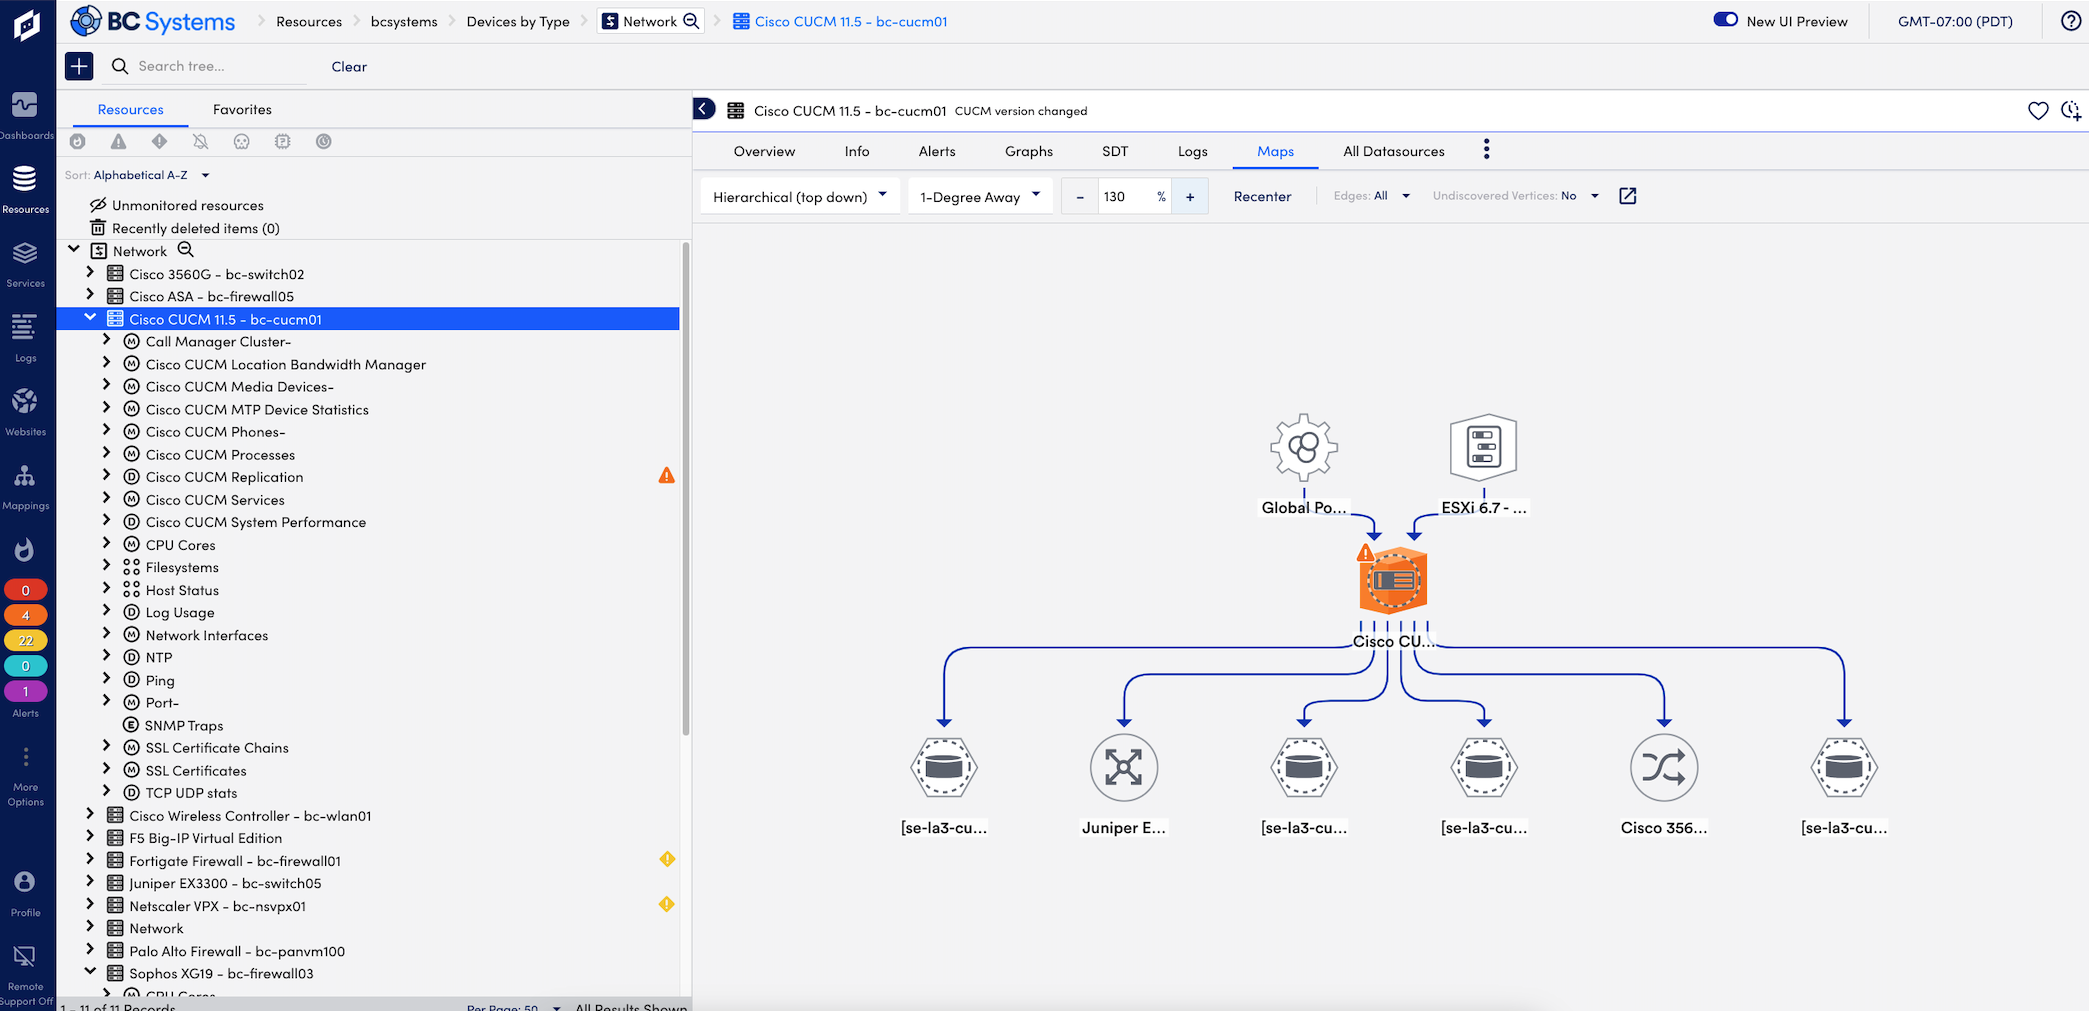
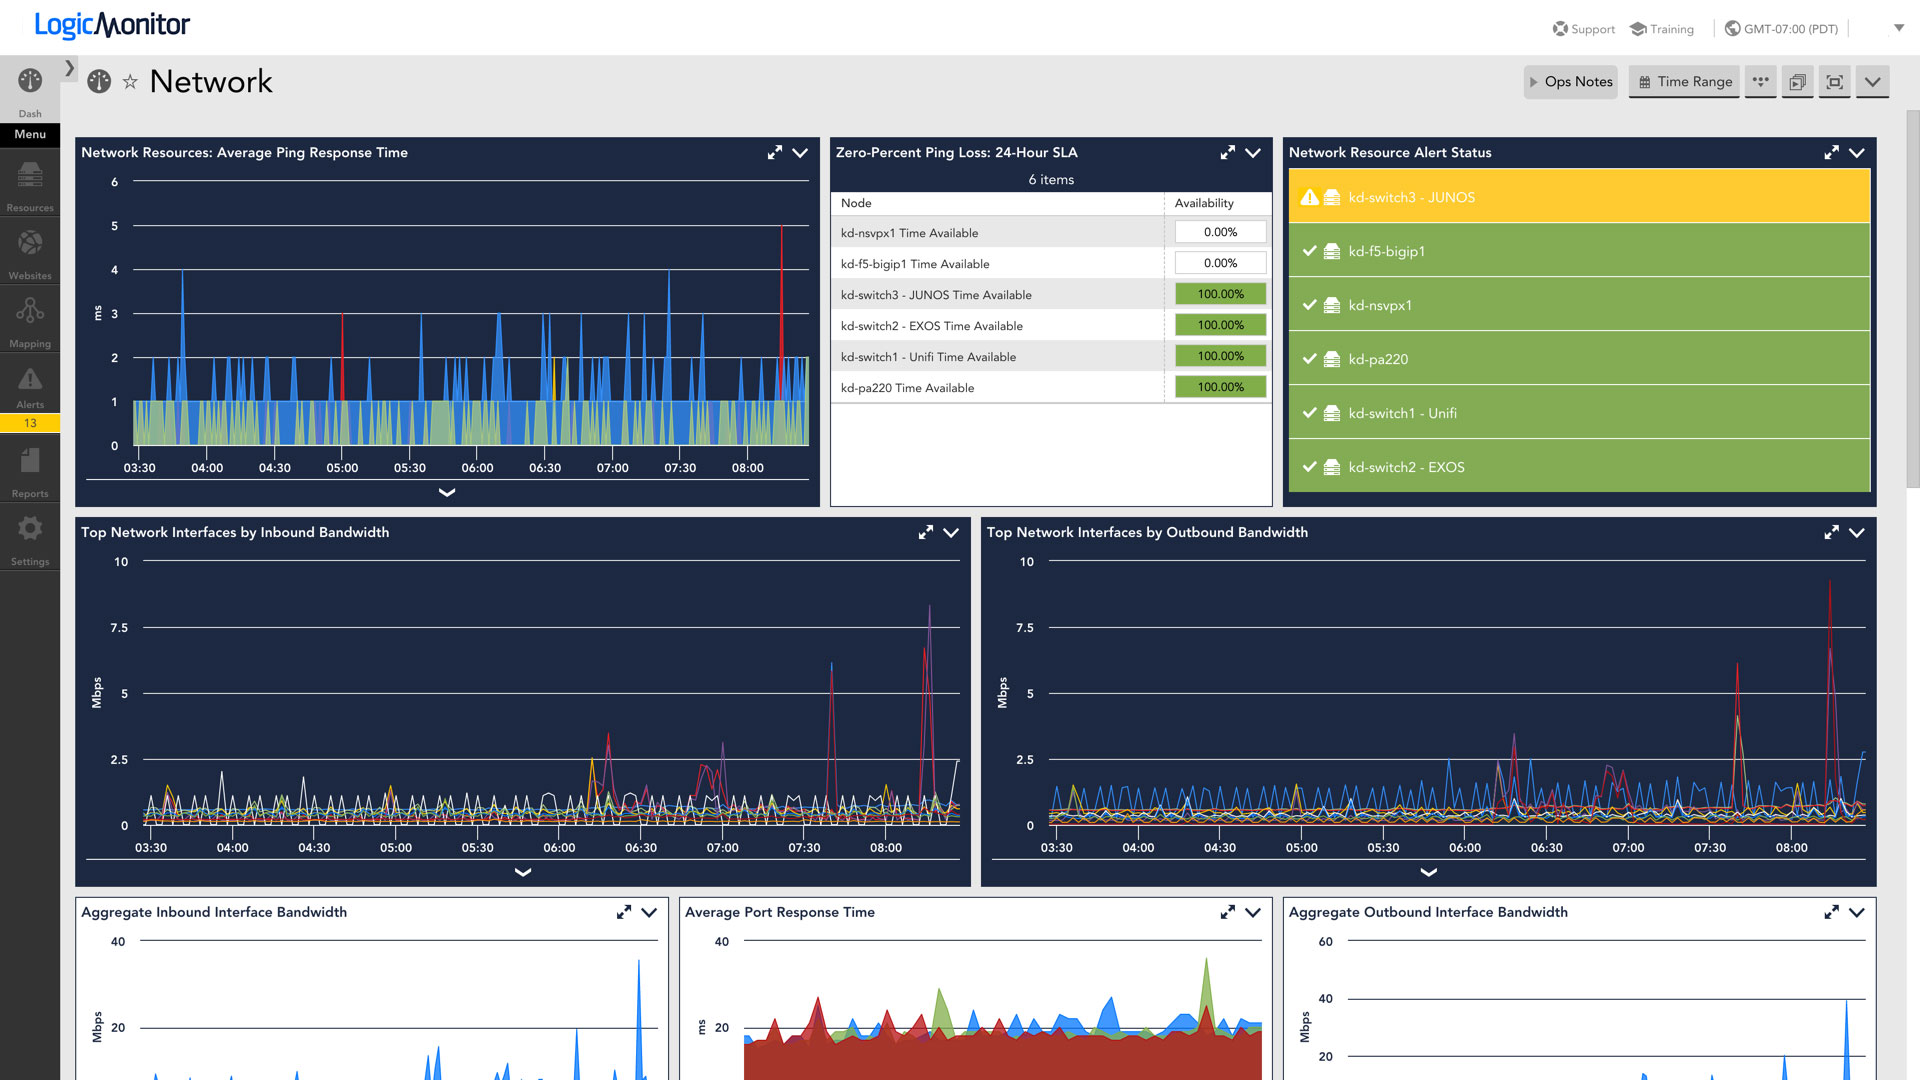
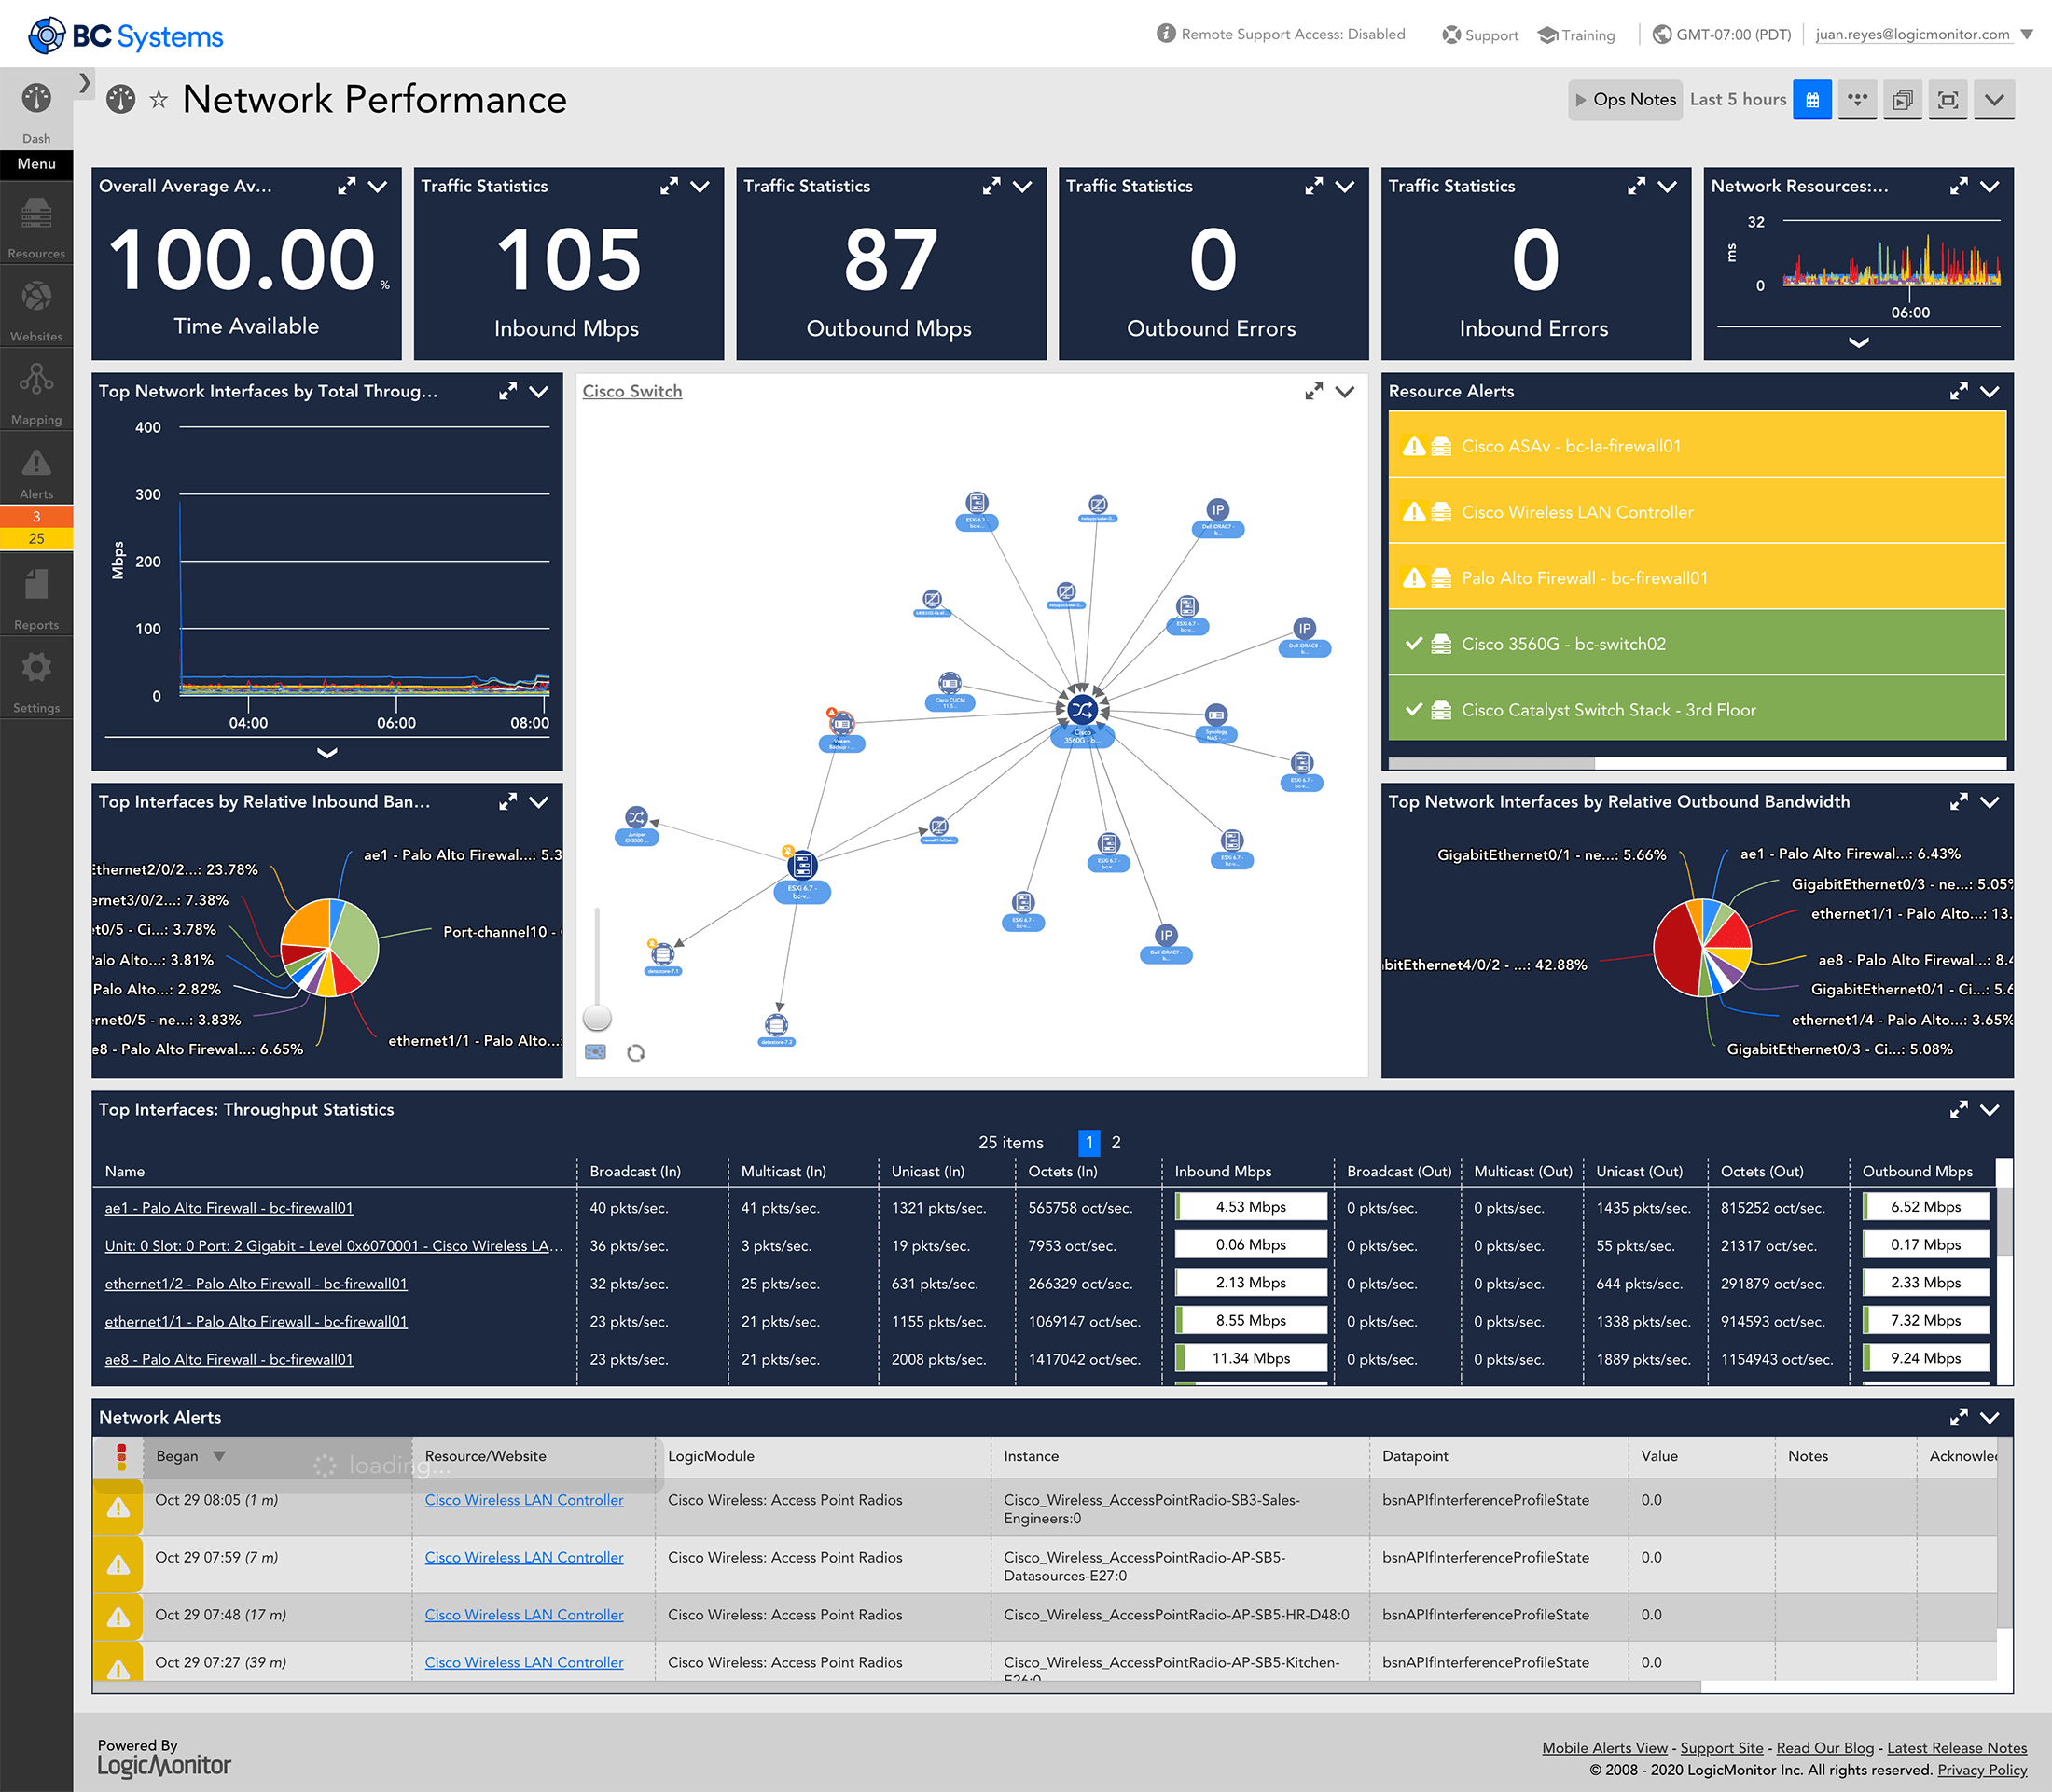
Monitor the health and performance of your entire network infrastructure in one secure platform. Achieve unified observability in minutes with our agentless collector, automated resource discovery, and built-in AIOps functionality!

LogicMonitor provides a complete view of your network so you can quickly identify and troubleshoot network issues. With powerful visualizations and custom dashboards, you can rapidly understand how your systems are connected and what issues are impacting performance.
Get the coverage you need for any network
Harness the power of AIOps
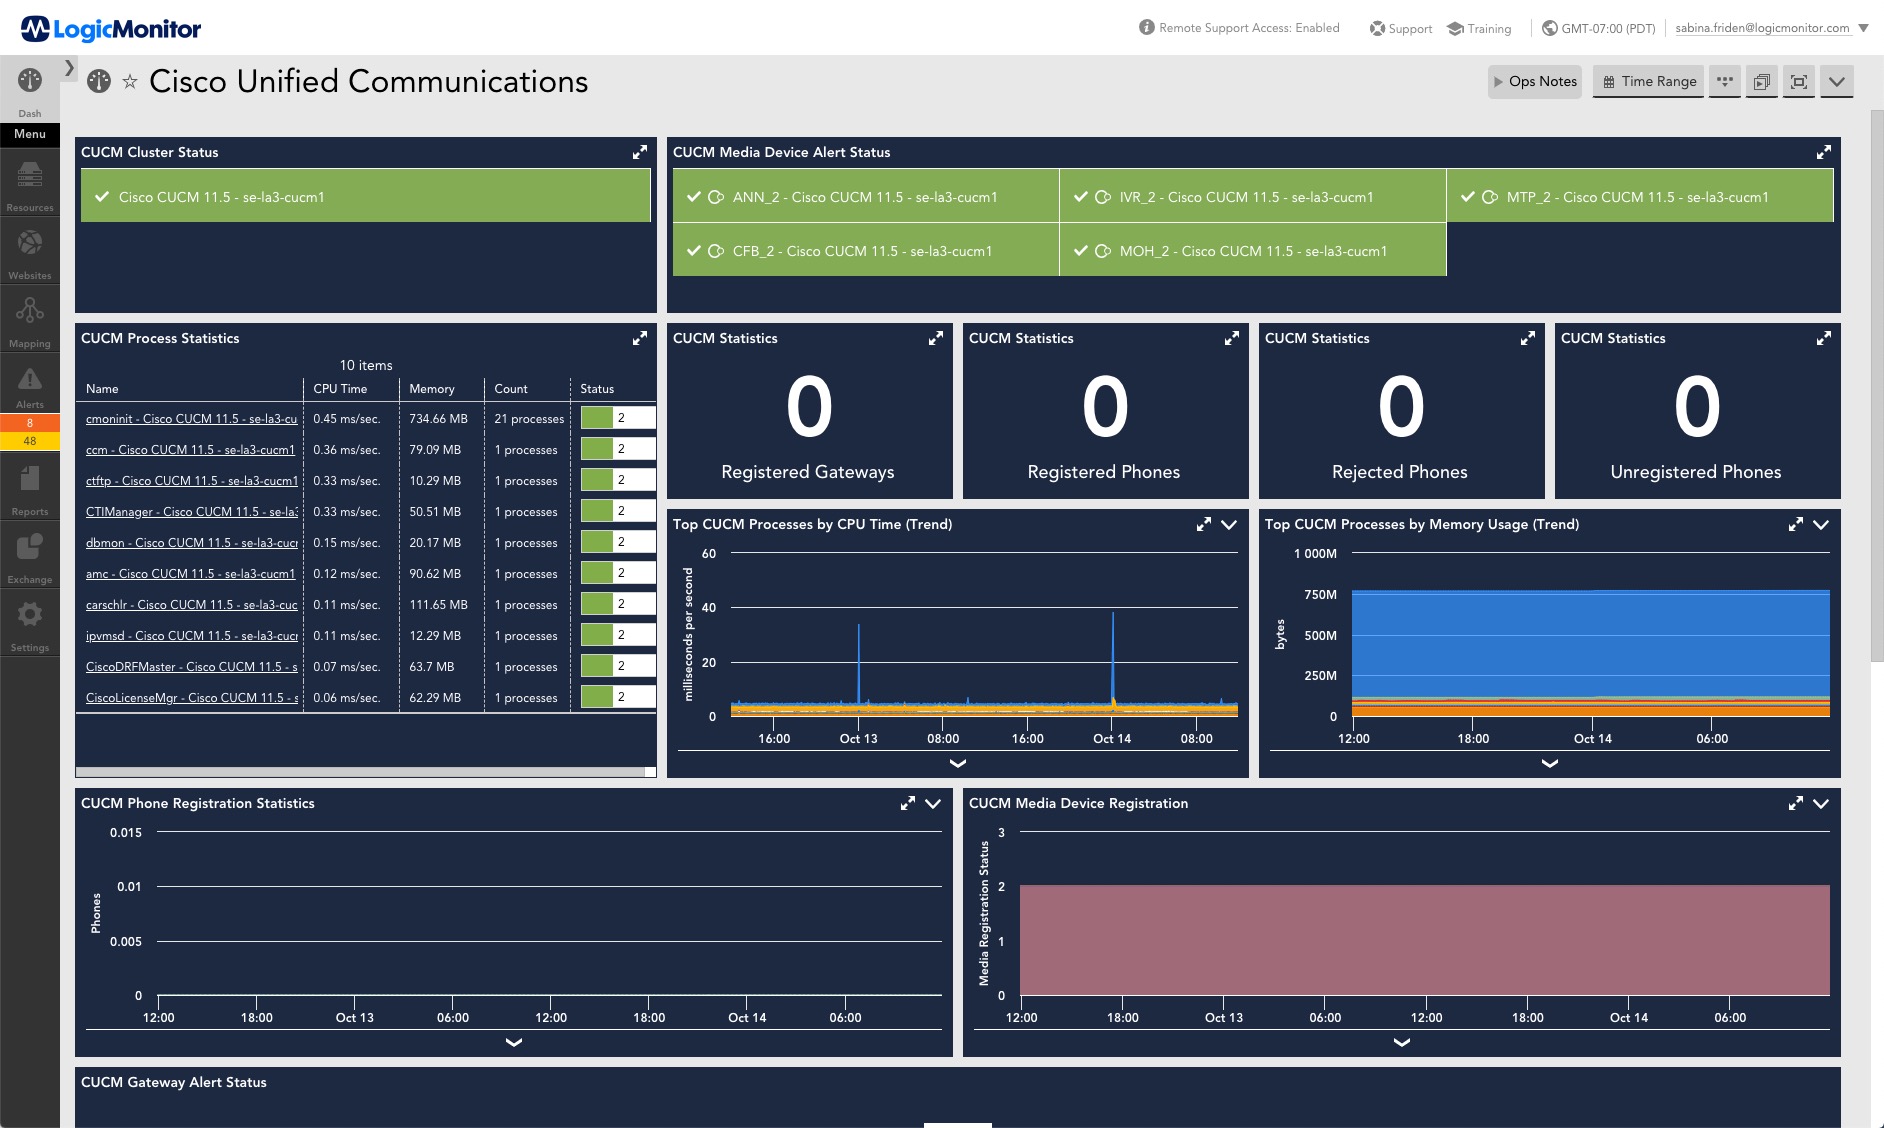
Monitor your entire stack in one place
TYLER C
SERVER AND CLOUD ENGINEER
Automated discovery
LogicMonitor utilizes a lightweight, agentless collector to discover everything you need to know about your network automatically. Just enter a hostname or an IP address, and within minutes you’ll have the monitoring, alerting, and graphing you need to maintain and optimize network infrastructure. Get the coverage you need for the most complex networks – whether resources are on-premises, spread across multiple data centers, or in the cloud.
Network topology
With auto-generated topology mapping, LogicMonitor allows you to discover and map relationships between critical infrastructure resources and their dependencies. Drill down further and generate a topology map based on an alerts to streamline your troubleshooting workflow and quickly discover the root cause of performance impacting issues.
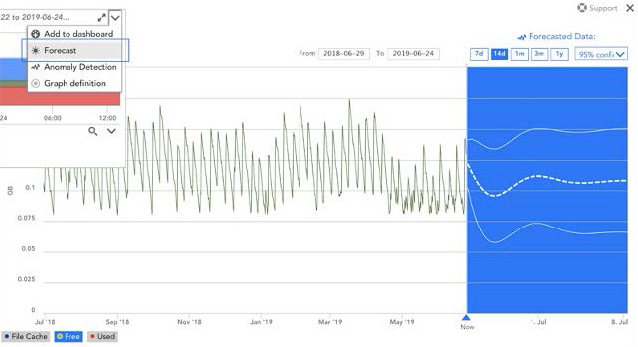
AIOps
Machine learning based dynamic thresholds and root cause analysis cuts through alert noise and identifies network issues at lightning speed. Anomaly detection and forecasting capabilities elevate visibility into network performance and help to prevent downtime by identifying future bandwidth issues and performance bottlenecks.
Third-party research
See how LogicMonitor, Datadog, SolarWinds, PRTG and other top vendors stack up in this comprehensive report by G2, the world’s largest B2B software review platform.
A single platform for ITOps and DevOps eliminates data silos and tracks metrics that matter. Built with hybrid infrastructure in mind, a vendor-neutral approach helps IT teams better understand the user experience and accelerate business transformation.
Log intelligence at scale – instant access to contextualized and correlated logs and metrics in a single, unified cloud-based platform. With tiered retention options, including unlimited retention, and hot storage to optimize data hygiene and internal compliance initiatives.
Never miss an application error, improve code quality, and diagnose and fix issues faster. Gain insight into the performance of the entire app stack, from code to cloud, to ensure a flawless customer experience in agile environments.
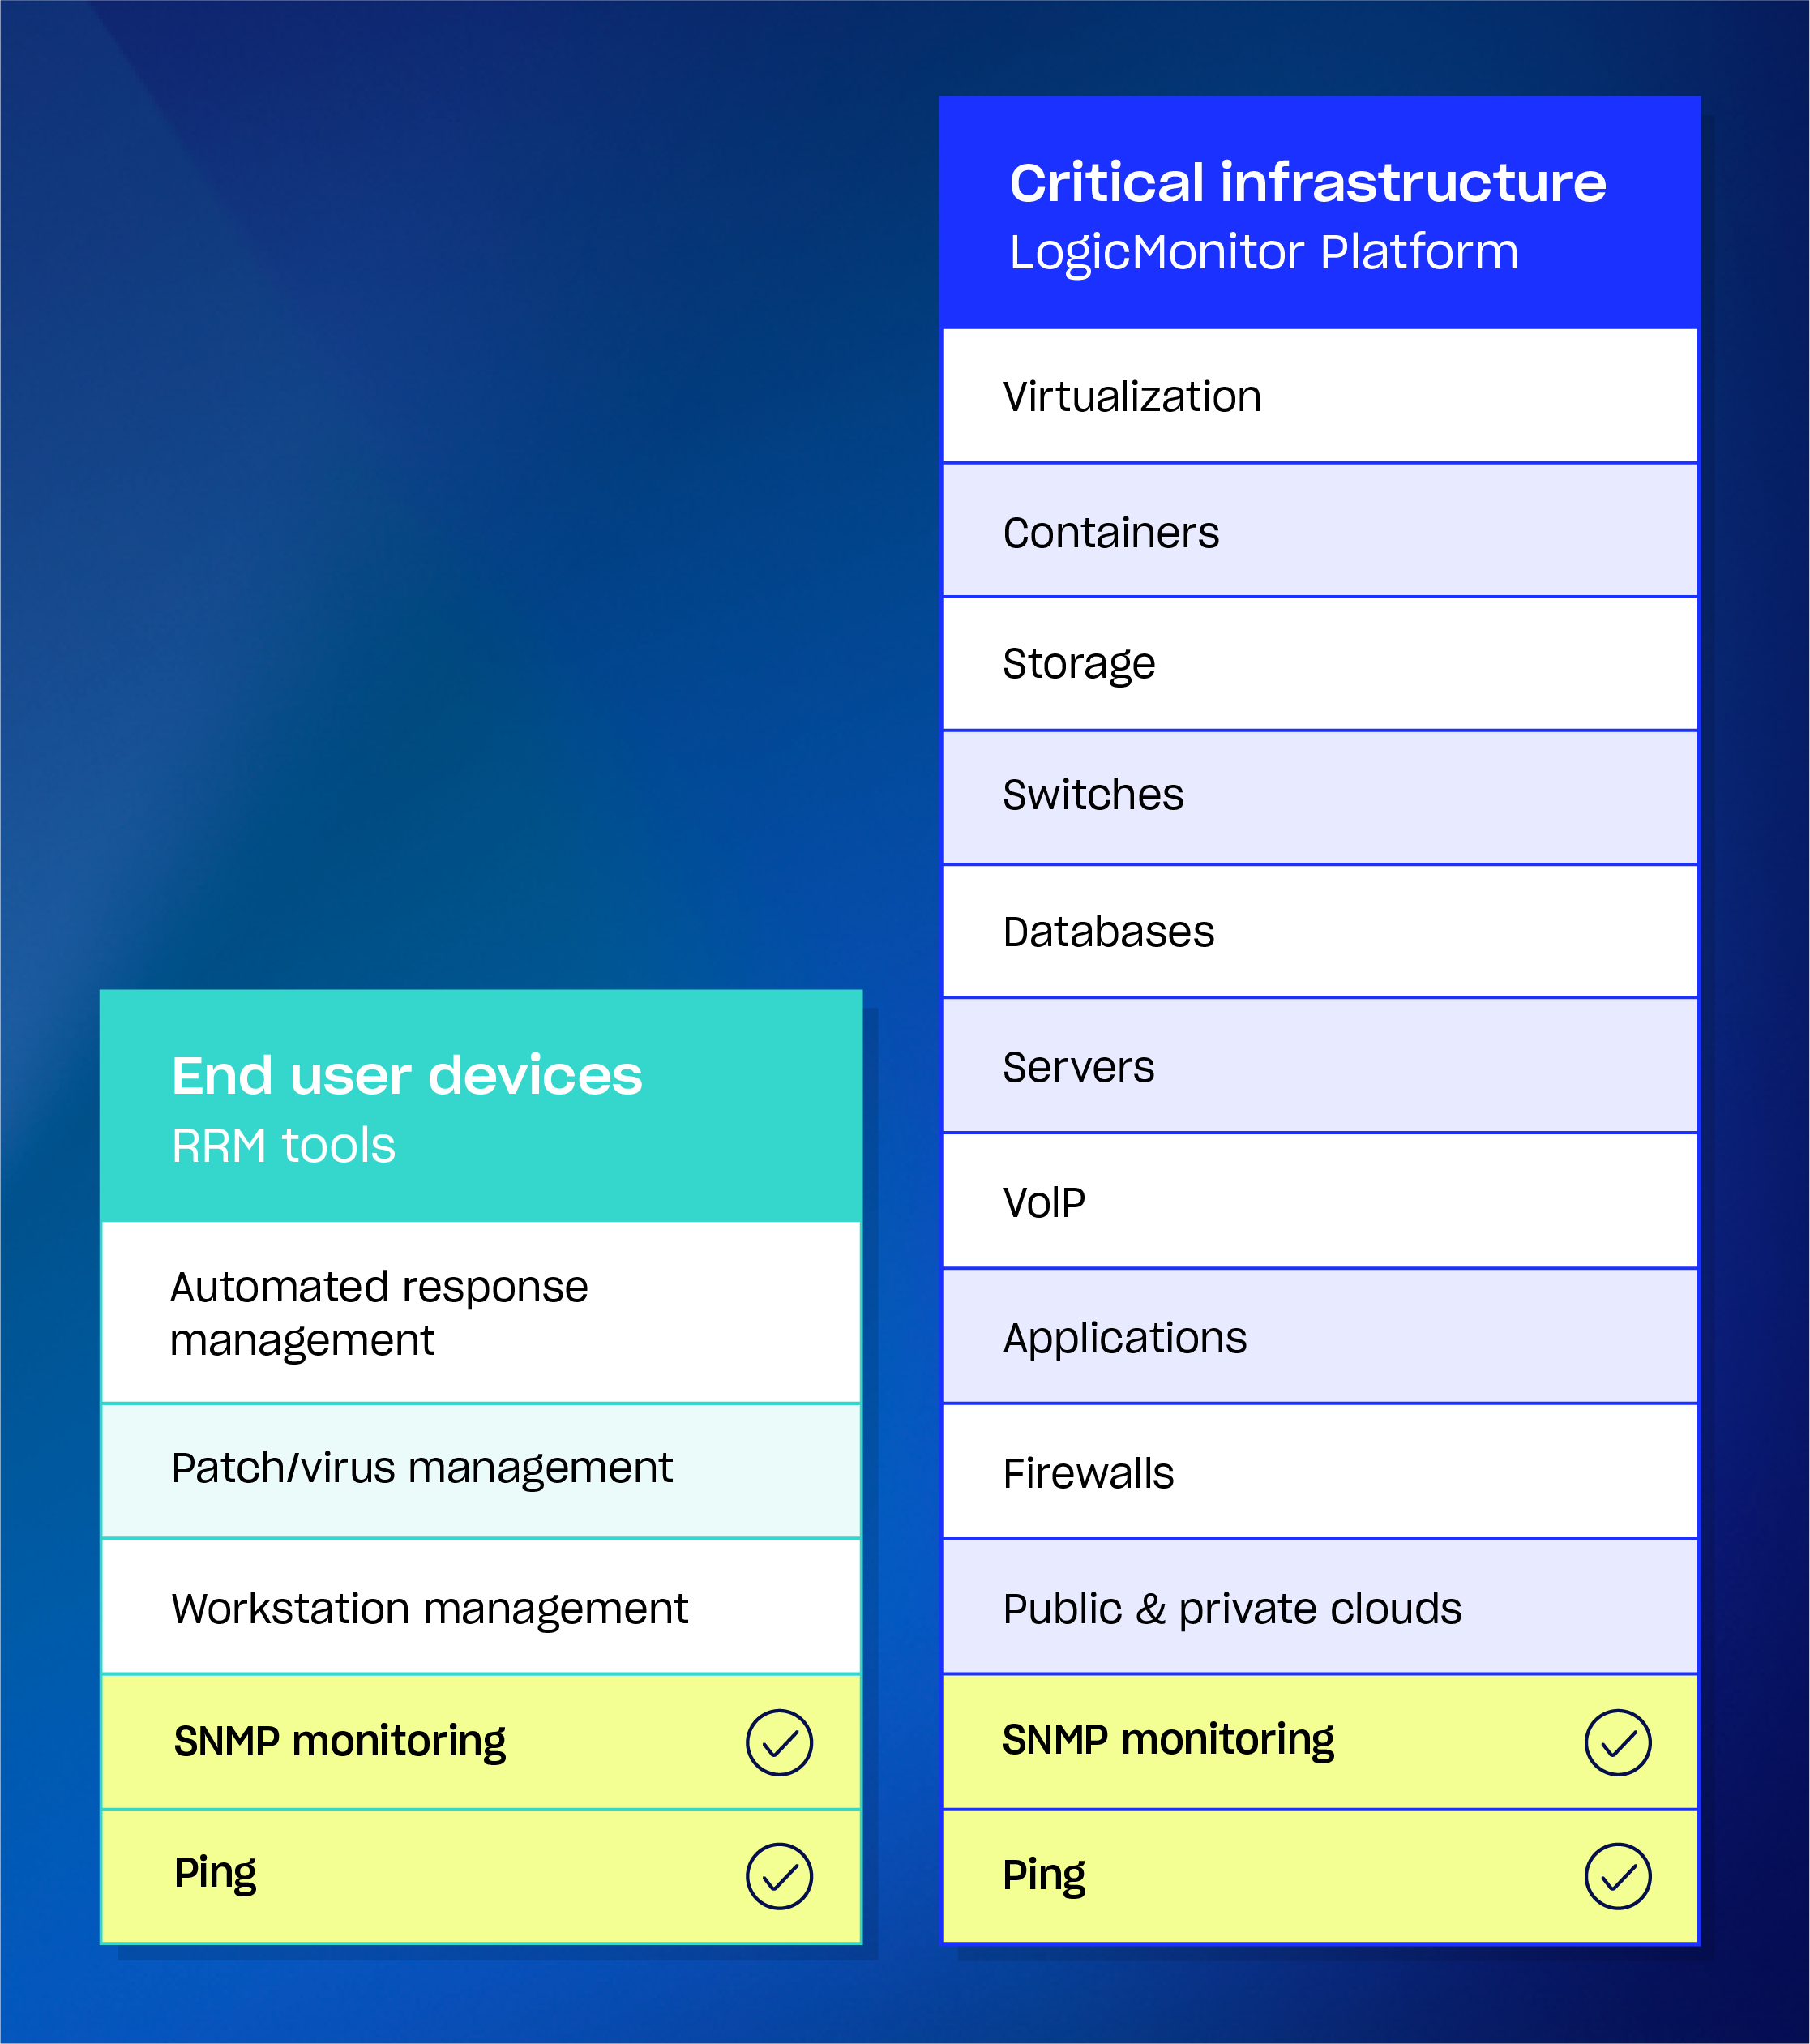
LogicMonitor makes it possible for MSPs to move beyond break-fix services and offer enterprise-level solutions that match the growing needs of their customers. Partnering with LogicMonitor enables you to harness the speed and flexibility of cloud-based monitoring without the need for expensive hardware or armies of technical resources. Instead, supercharge your managed services offering with AIOps that allows you to predict and prevent outages before they happen.
Why are leading MSPs adopting LogicMonitor when they already have an RMM tool? While it’s important to apply patches and manage endpoints, next-gen service providers need to maintain a competitive edge in an IT landscape undergoing constant change. Leverage the breadth of coverage and flexibility LogicMonitor provides to boost revenue, keep costs down, and stay ready for what’s next.


SCOTT MAYERS
Instead of notifying customers when something breaks, leverage the power of AIOps to forecast future events (like running out of disk space, drive degradation, and resource utilization) and prevent downtime before it occurs. As a result, MSPs that utilize LogicMonitor can reduce their number of tickets, slash MTTR, and provide predictive services that boost customer satisfaction and retention.
Comprehensive monitoring helps Service Providers proactively manage IT environments by reducing overall downtime and improving IT performance. In addition, expanded coverage for cloud services positions your MSP as a true digital transformation partner, increasing customer loyalty, adding value, and creating a healthier bottom line.
While some monitoring vendors focus solely on providing point solutions, LogicMonitor works as a dedicated growth partner to enable your long-term success in the managed services industry. Move beyond RMM into value-added services that create customer stickiness and prepare you for the future of cloud-based initiatives and strategies.
Our story starts with our customers. Rated #1 in support on TrustRadius and #1 in Customer Satisfaction on G2, we provide 24×7 live support with real technical engineers in your region. These engineers work as an extension of your team, enabling rapid results and business-driven outcomes for your team. Our 24×7 support, dedicated customer success teams, and advanced features are why LogicMonitor is consistently voted #1 in customer satisfaction by your peers.

E-BOOK
As Managed Service Providers look to move beyond break-fix RMM services and onboard more customers, AIOps has become a key priority in improving the customer experience and future-proofing their business. And with rapidly evolving requirements and the need to discover unforeseen issues before they impact the customer, AIOps plays a crucial role in improving SLAs and empowering next-gen MSPs.