Enterprise generative artificial intelligence (GenAI) projects are gaining traction as organizations seek ways to stay competitive and deliver benefits for their customers. According to McKinsey, scaling these initiatives is challenging due to the required workflow changes. With AI adoption on the rise across industries, the need for robust monitoring and observability solutions has never been greater.
Why hybrid cloud observability matters
Hybrid cloud observability is a foundational partner as it provides comprehensive visibility over AI deployments across on-premises and cloud environments. LogicMonitor helps customers adopt and scale their GenAI investments with monitoring coverage of Amazon Bedrock. Visibility into Amazon Bedrock performance alongside other AWS services, on-prem infrastructure, and more lets users confidently experiment with their GenAI projects and quickly isolate the source of issues.
LogicMonitor’s hybrid cloud monitoring helps teams deliver AI with confidence
Hybrid cloud monitoring oversees IT infrastructure, networks, applications, and services across on-premises and cloud environments. With LogicMonitor’s hybrid cloud monitoring capabilities, customers gain a unified view of their entire IT landscape in one place. Visualizing resources in a single view helps customers quickly locate the root cause of problems and act on them to reduce project delays. For AI initiatives, this comprehensive hybrid cloud monitoring coverage gives teams:
- Unified visibility: A single pane of glass lets teams observe the performance, health, and usage of AI workloads regardless of their deployment location. This ensures that teams can easily monitor AI models, data pipelines, and compute resources across distributed environments.
- Proactive issue resolution: Real-time monitoring and alerting lets teams detect and address issues before they impact AI operations. Quickly identifying anomalies, resource constraints, or performance bottlenecks allows organizations to maintain the reliability and efficiency of their AI initiatives.
- Optimized resource utilization: Hybrid cloud monitoring helps organizations balance performance with resource utilization and costs. Dynamically offering insights and recommendations into resource consumption, usage, and workload performance is crucial for AI workloads, which usually increase in resource consumption as they scale.
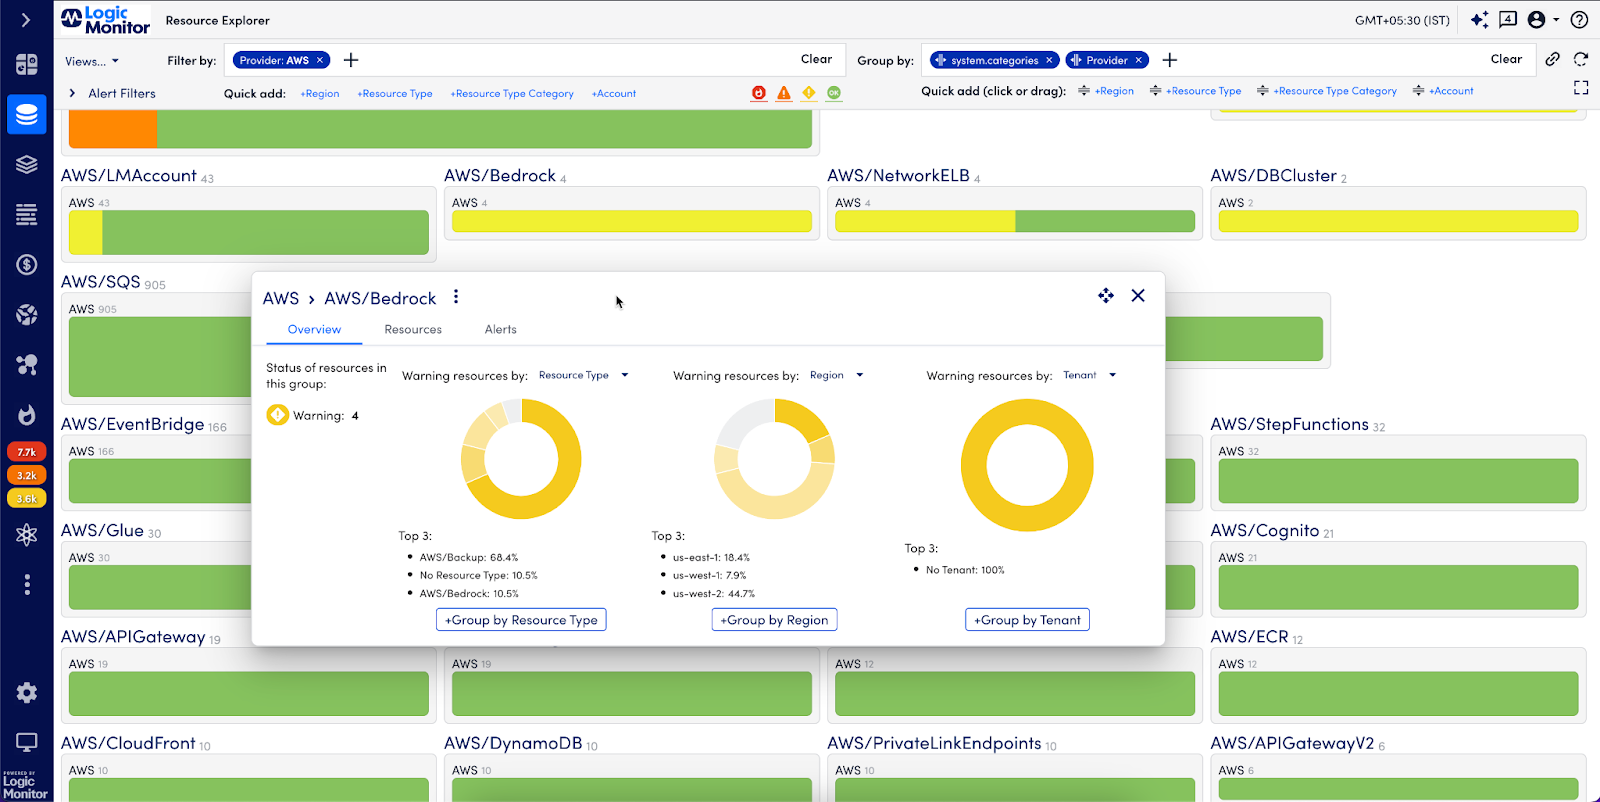
Unified view of AWS Bedrock services alongside other AWS services. LogicMonitor’s Resource Explorer easily groups and filters resources to provide actionable insights. Here we see active alerts for Bedrock and the top resource types and regions affected.
Accelerating AI with LogicMonitor and Amazon Bedrock
Amazon Bedrock, a managed service from Amazon Web Services (AWS), allows teams to experiment with foundational models to build and deploy GenAI solutions easily. Amazon Bedrock lets teams accelerate their AI initiatives and drive innovation with pre-trained models, a wide range of compute options, and integration with hybrid cloud monitoring that enhances observability over AI models.
LogicMonitor helps our customers unlock their GenAI adoption with monitoring coverage of Amazon Bedrock. The partnership between LogicMonitor and AWS ensures that customers can confidently deep dive into their GenAI projects, backed by the assurance of always-on monitoring across AWS resources to optimize functionality and quickly address issues that arise.
Benefits of combining LogicMonitor and Amazon Bedrock
For organizations adopting GenAI strategies, the combination of LogicMonitor Cloud Monitoring and Amazon Bedrock can modernize and scale AI projects with:
- Streamlined deployment and monitoring to ensure that AI models deliver consistent and reliable results
- Performance optimization over GenAI models so teams can improve resource utilization and fine-tune model parameters for better AI outcomes
- Proactive alerting so teams can detect anomalies or performance degradation in their GenAI models and maintain high performance and reliability
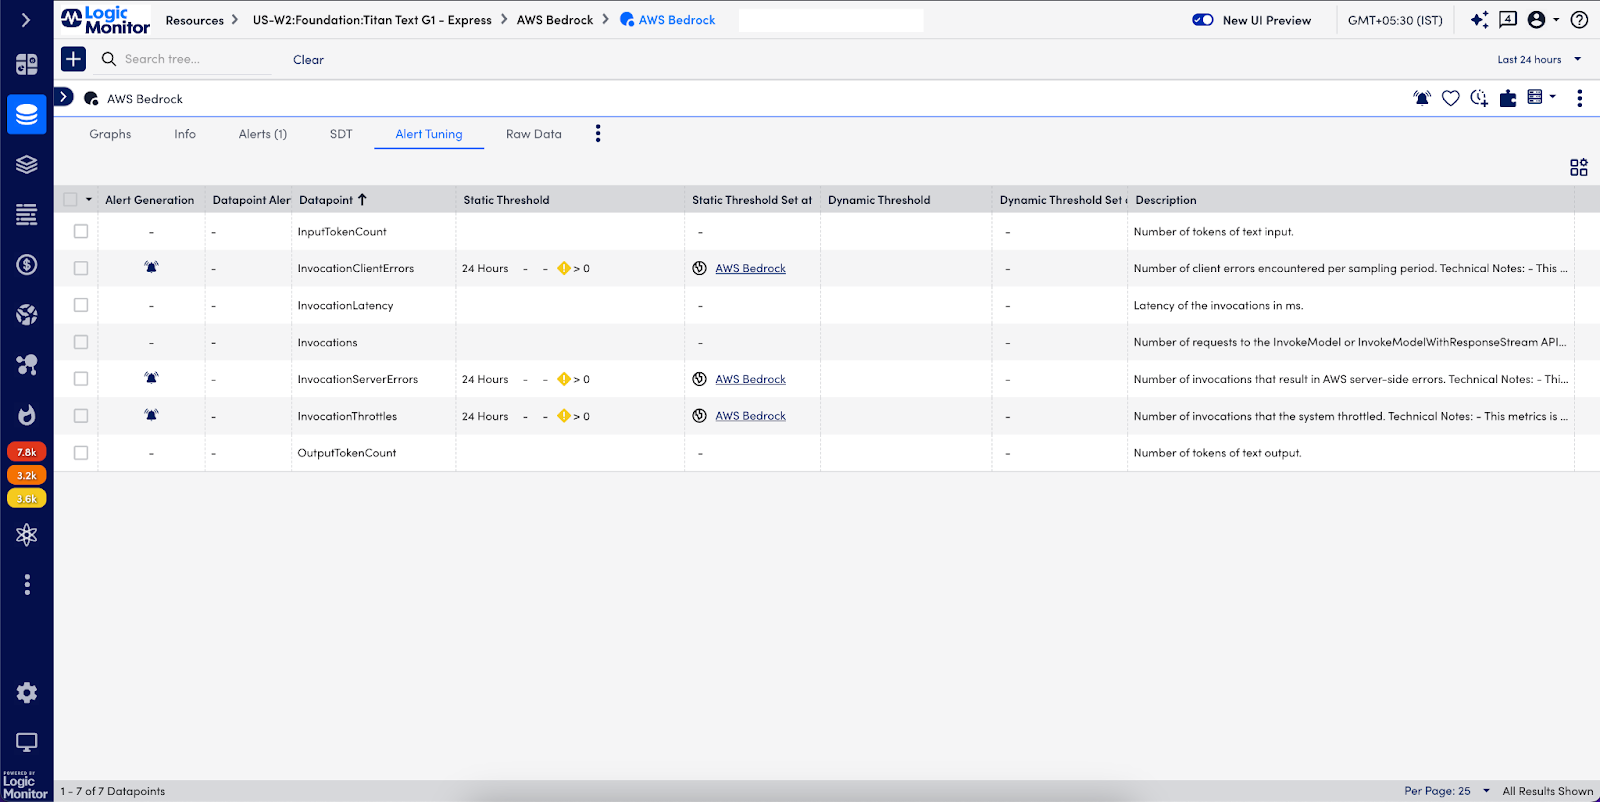
Out-of-the-box alerting for AWS Bedrock Services
LogicMonitor and AWS: Better together
The alliance between LogicMonitor and AWS continues to thrive, with monitoring coverage for a wide array of commonly used and growing AWS services. Whether you are growing your AWS usage, maintaining business-critical on-premises infrastructure, or embracing cloud-native development, LogicMonitor is a strategic partner on your journey to help you visualize and optimize your growing AWS estate alongside your on-prem resources. LogicMonitor is available on AWS Marketplace.
Contact us to learn more on how LogicMonitor adds value to your AWS investments.
Written by: Ismath Mohideen, Product Marketing Lead for Cloud Observability at LogicMonitor
IT operations are a constant juggling act. Too many tools, too much data, and not enough time to proactively avoid outages. But what if AI could not only streamline your tools but help you make sense of the chaos? That’s the power of AIOps.
What is AIOps?
To understand AIOps and its evolving landscape, one needs to grasp its basics and current trends.
AIOps stands for Artificial Intelligence (AI) for IT Operations. It is a set of AI-driven technologies designed to improve the efficiency and automation of IT operations.
AIOps vs. Generative AI
AIOps is different from generative AI. Generative AI (GenAI) can generate text, images, or other media using generative models. Its applications range from chatbots to complex creations like art and music. Large Language Models (LLMs) are vital to GenAI. They, use massive datasets to understand, summarize, create, and predict new content.
Current trends in AIOps
Current AIOps trends show a shift to easier data accumulation. Both on-premise systems and cloud providers offer accessible REST APIs and open telemetry. This change lets enterprise IT teams get real-time insights from huge data lakes and IT tools. They leverage technologies like machine learning (ML), AI, natural language processing (NLP), and GenAI.
The challenge: DIY vs. off-the-shelf AIOps
Choosing between custom DIY and off-the-shelf options has its own challenges. While open-source options are available, they may require longer periods (18-24 months) to show value, necessitating ongoing security and technology updates.
The AIOps hype cycle is in full swing. It reflects the growing focus on leveraging AI to improve IT operations and observability. To turn hype into reality, IT leaders need to address common pain points.
Solving IT alert fatigue and data overload with AIOps
Addressing pain points in AIOps involves understanding the many challenges faced by IT teams and executives. IT teams are overwhelmed. Alert fatigue, constant context switching, and an overwhelming amount of data without actionable insights impact day-to-day operations and decrease efficiency.
For IT executives, the challenge is managing expectations. They have to do more with fewer resources. They must also use automation and efficiency to improve business availability and prevent negative publicity from service downtimes. Outdated manual workflows and tools make this even harder
Even with a tool migration, changing underlying IT processes is a culture shift. It demands extensive teamwork and reorientation, often proving more challenging than anticipated. This slows the path to desired efficiencies and business outcomes in AIOps.
The convergence of AIOps and hybrid observability
The convergence of AIOps and hybrid observability represents a significant shift in addressing modern IT challenges. This convergence is essential because of how applications are built and monitored. It requires addressing streams, traces, and metrics from various sources. This is different from traditional observability tools—highlighting the need for diverse tools to serve both legacy and modern observability stacks.
AIOps tools once focused on alert data from various sources. But convergence changes everything. Think of it as a discovery engine for hybrid infrastructures. It gives full access to rich contexts for AI/ML models. This means being able to ‘see’ the devices, and how they are being deployed for deeper troubleshooting.
For example, understanding all aspects of a switch (model, location, firmware) is key, but so is the broader context. If it’s connected to an Amazon EC2 instance, knowing the application, owner, and environment (production or lab) is vital for management.
The result: Faster problem-solving and IT efficiency
This convergence brings substantial business benefits. It speeds up troubleshooting during critical issues (P1 situations) and allows more efficient models to compress alerts in real-time. This significantly enhances IT operations’ responsiveness and effectiveness.
Developing a winning AIOps strategy
The key to a successful AIOps strategy is aligning it with your business goals. Here’s how to get started:
- Realistic vision: Establish a two-year realistic vision with clear milestones. This allows for a focused strategy that can adapt to rapid technological changes and business needs.
- Prioritize use cases: Identify and prioritize the most important use cases. Understand your exact challenges and opportunities. Address them in order of business impact and need.
- Tool/skills gap analysis: Evaluate your existing tools and skills, and identify any gaps. Assess your current abilities for your chosen uses. Make any needed changes..
- Align with business goals: A winning AIOps strategy isn’t just about technology. It’s about ensuring it delivers tangible business value. Have regular touchpoints with the management team. This is to ensure that everyone is on the same page, using the same tools, data, and context.
This holistic approach promotes collaboration. It avoids the pitfalls of siloed operations, leading to a more cohesive and effective IT environment.
LogicMonitor: Your hybrid observability solution powered by AI
LogicMonitor integrates AIOps strategies into its platform. This transforms IT environment monitoring and management. Its agentless, lightweight technology aggregates diverse telemetry into a unified system. This streamlines administration and enhances operational efficiency.
The platform uses AIOps to offer deep insights, showing a comprehensive, anomaly-focused resource view for proactive management. This allows for the early detection of potential issues and furnishes predictive insights, leading to timely resolutions.
LogicMonitor’s innovative alert system provides contextual information, fostering team efficiency and a collective understanding of deployment scenarios. These advancements reduce outage risks, expedite incident responses, and shift focus from reactive to strategic, innovative IT operations.

Discover how LogicMonitor can help. Download the “AIOps for Monitoring” eBook, or email [email protected] to get started with a free demo.
Not everyone on your team lives in LogicMonitor — some might never go into the platform! But that’s okay because LogicMonitor’s Alert Integrations are designed with extensibility in mind. LogicMonitor’s flexible approach to alerts ensures that you receive alerts in the place you work, alerts are routed to the right team member, and you are not overwhelmed by alert storms or alert fatigue. With 10 out-of-the box Alert Integrations, Custom HTTP Integrations, and traditional communication methods like SMS and email, we ensure that the data LogicMonitor gathers is sent to the external platforms your business uses where it can immediately be actionable by members of your IT org.
There are three types of Alert Integrations maintained by LogicMonitor:
- Our Communication Integrations with Microsoft Teams and Slack provide a seamless bi-directional experience whereby alerts are sent directly to your company’s preferred communication channel so you can monitor alerts, acknowledge them, and schedule downtime (SDT) within that channel.
- Workflow Integrations allow IT teams to create, open, update, and close tickets in ServiceNow, PagerDuty, AutoTask, Connectwise, or Jira Service Management.
- And our Automation Integrations send alerts to Stackstorm where they are processed by their rules-based engine and auto remediation is triggered from there.
But what if your system isn’t captured in one of our out-of-the-box offerings? No problem. At LogicMonitor, we pride ourselves on the extensibility of the platform. We offer flexibility to make the platform work for your company’s specific needs and to plug and play with systems that already exist. We accomplish this with Custom HTTP Integrations (i.e. Webhooks) by allowing you to send alert data to any API endpoint.
Custom HTTP Alert Delivery Methods (i.e. Webhooks) allow you to send alert notification data to an external system via HTTP GET or POST requests. Similar to Custom Email Alert Delivery, this can be helpful if you’re sending alert notifications to a ticketing system. Custom HTTP alert delivery enables you to define the precise format of the alert notification data using tokens (variables), so that it can be easily parsed by the recipient system.
Typically, custom HTTP delivery methods make an HTTP POST and deliver alert notification data in a request payload. However, in some cases an HTTP GET request is sufficient because the request itself has form data appended to the URL (e.g. https://www.example.com/api?param1=abc&m2=def), and no payload needs to be posted.
Simply defining a custom alert delivery method will not result in notifications being routed via the custom delivery method. The custom delivery method must be included as the contact method for a recipient in an escalation chain, and that escalation chain must be referenced by an alert rule.
Our customers and partners have created a number of Custom HTTP Integrations for delivering alert payloads to ITSM solutions and other tools, which can be viewed on GitHub. These can be building blocks for your own custom integration. One example is this step by step guide from ONEiO. For more information, check out our Custom HTTP Support page!
Reacting to alerts can be a pain, however, there are ways to be proactive and decrease frustration concerning IT Alerting. Developing an alerting strategy saves IT Operations and Development teams time, money, and eliminates notifications from low priority alerts. Keep reading for more information on routing and escalation chains, fielding alerts, and how to communicate an alerting strategy to management.
Alert levels of severity
Most alerts have three levels of severity: warning, error, and critical, with warning alerts usually being the least severe. Severity levels vary from organization to organization, but most internal alerting has a variation of these three levels.
Warning: Warnings indicate that there is something to be aware of, that may or may not be a problem now, but can definitely become an error in the near future. Often, with proper proactive measurements in place, warnings can be fixed before they escalate further.
Error: Errors indicate that something is wrong, or isn’t behaving properly. These may need to be fixed quickly, and should be investigated.
Critical: Critical issues typically mean something has broken in a way that needs attention immediately and actions should be taken to remedy any critical issues ASAP.
Read more: What do different alert severities mean
Routing and escalation chains
Routing and escalation chains serve the purpose of capturing which alerts should be routed to which teams. They also determine the severity of those alerts and the corresponding levels of notifications for them.
The most simple escalation chain is sending warning-level alerts to emails or web-only systems. Too many warning-level alerts sent via text or phone can lead to alert fatigue and feeling overwhelmed by your alerts. The goal is to ensure that the problem is remediated, but you don’t want to take unnecessary action, such as waking someone up in the middle of the night for a system that can tolerate a short outage.
Error or critical alerts necessitate SMS or other live push-based notification systems. They can be escalated amongst multiple members of the team. This is dependent on who acknowledges the alert, which would then stop the escalation. Escalation chains can be used to stagger how people get notified. Other options are a “hail-mary” approach where you spam the entire team depending upon the severity of the alert.
Fielding alerts
Upon being notified of an alert, the person on-call to troubleshoot the issue should be able to quickly assess the severity of the alert based on its customer impact. Customer impact examines both customer and employee. If employees are being distracted by alerts with no customer impact, that alert’s settings might need some adjustments. There should be a consistent process in place to field alerts and resolve the issue.
Acknowledging an alert is critical to either stop the escalation of that alert or immediately escalate it to the next team who can provide support. It’s important to continue diagnosing the issue, even after it’s resolved. A critical step is to go back and evaluate whether the alert could be tuned in any way to improve its effectiveness. A good question to ask would be, “Is the alert customer-facing?” If the answer is yes, then respond immediately. If not, examine how urgent the alert truly is.

How to communicate alerting strategy to management
With a more efficient alerting system, companies are able to save money and reallocate it to other areas of their business. IT teams are also able to free up more of their time by avoiding alert fatigue and unnecessary distractions from priority work. Identifying the time and money saved, along with any other relevant data, is the best way to communicate an alerting strategy to management. Numbers go a long way and show the strategic value of making a change. Remember to include your team members in these discussions, because if you are making their job easier you will likely have their full support.
When taking a close look at your team’s current alerting practices, note that no system is perfect. However, working to improve IT Alerting escalation policies with LogicMonitor’s guidance is a step to bettering the function of IT Infrastructure.
Originally published July 14, 2020. Updated November 2022
In the world of DevOps, every second counts. Problems need to be fixed fast, but with the intention that it’s done with a legitimate purpose for when something’s wrong. Continuous monitoring helps with automation and setting up the right kinds of alerts. If the system is going haywire, every moment not acting can make things worse. That’s why intelligent alerting is critical for enabling observability and continuous effective monitoring.
Out-of-the-box intelligent alerting is a game changer
One of the most significant needs concerning practical, intelligent alerting is automation. To ensure systematic safety, everything should be monitored to check the health and dissect the complexities within those systems. Suppose a system is constantly monitored, built on the idea that fast action is possible. In that case, it makes for a stronger relationship with customers because they can trust you’re working around the clock for their best interests, no matter what product or service you’re selling.
Easy-to-read dashboards let DevOps teams know what’s happening and when, just the same as prescriptive workflows, guide users from the high to the low level without needing lots of training/education – a workflow that keeps IT informed thanks to escalation chains around evolving thresholds leads to strengthened application resiliency is one that makes ITOps job easier.
Adding severity levels to alerting
Setting severity levels can lead to more streamlined performance monitoring that shows how serious a problem is and how fast it needs to be addressed, and if it’s something that the system can monitor or if a human needs to get involved. What matters is a repository where this data lives and can be acted upon for future data collection.
Bringing down investigation time provides information and context to an incident. Collecting the data that shows what happened within a single incident offers a quick view of severity. When these incidents happen, it’s critical to know what services or service instances were running and what the recovery protocol will be.
Why Alerting is Important
Companies monitoring their system health don’t want constant alerts, which can happen due to structural and competing forces, such as:
- Overly sensitive systems that constantly alert with false positives
- When too many non-issues are alerted, and when one that matters happens, no one takes it seriously
- Keeping up with the pace of new tech can create knowledge gaps
- Siloed information due to using multiple systems that don’t talk to one another
Everything isn’t forever
Resources aren’t finite in any circumstance. Tracking resource metrics can be hard when resources appear and disappear. Teams need to be alerted throughout the stack, giving constant data check-ins on what’s moving through the system, whether hosts are shifting from five to fifteen in a matter of hours or if someone is attacking the system.
Critical Components to Smart Alerting
Data monitoring should give users a snapshot into metrics and information, which collect and calculate service maps and dependencies, as well as correlate issues:
- Cluster nodes and infrastructure
- Service Instances
- Built frameworks
- Distributed Traces across the landscape
- Process and Runtime Environments
- Service Dependencies
And even further offer the capability to:
- Log anomalies
- To trace (Metric Alerts -> traces -> to logs for a service)
- Synthetic Alerts based on dynamic thresholds -> to traces
- Be a hub for metric alerts to see metrics in context to identify troubleshooting
Because there’s a chance for real context, it will slash time down. Because the information is detailed, this should create a best-case scenario for the resolution process for the DevOps team who is then armed with information across distributed systems and applications.
Customization isn’t just for t-shirts at the mall
Software should be able to help teams do all of this and create customizable environments. (We can help with this.)
Developers should know what’s going on but also stay within a data repository so the information can be examined later down the road; it helps to create a playbook for future issue resolution. This methodology also helps create visibility into any bottlenecks and what to benchmark against.
What’s in a strategy?
Depending on the business need, systems can be set up for objective usage and, more importantly, customized, so they’re alerting based on a true issue at hand.
Common business goals often include seeking out bottlenecks where alerting should be targeted, prioritizing high functionality, identifying what’s important, and creating alerts that help DevOps teams achieve uptime while nailing business impact. Remember, we’re all serving customers, and that’s always the goal – to keep systems running as smoothly as possible.
Companies should set alerts for mobile crashes, Javascript errors, APIs, service alerting, page load time, and service latency. For the teams using Kubernetes, you could set alerts for uptime, pod health, containers, and network routing. If you don’t have a list of metrics, you could also use service level objectives (SLOs) to create metrics and KPIs reflecting team priorities.
This is about customers, not how deep a DevOps team can get lost within the processes. Serving your customers should always be the priority. Uptime is critical for success, and keeping processes streamlined for effectiveness separates the good from the bad in business.
Alerting is only helpful if teams pay attention. Set alerts that people will respond to correctly – if signs go unnoticed, what’s the point? Alerting serves your team. Balance severity and create guidelines to protect your teams as part of your culture.
Alerting is a method to keep customers’ businesses moving, so customer impact and business outcomes should be a priority. Customers don’t care about internal processes – they care how successful your services are.
After an incident, look at what worked and what didn’t. Craft alerts so they’re impactful and keep the DevOps teams informed and ready vs. labeling something just as an “informational warning.”
What happens after the alert flag goes in the air?
Setting up processes matter, especially ones that are transparent and effective. We suggest following this simple system to see results that aren’t lost within convoluted processes:
- Configure
Set up monitoring + AIOps which access, audit, and seek out anomaly detection, event correlation, automation, and coverage.
- Detect
If the flag is alerted, send it to a collaboration tool like Slack.
- Combine & Refine
Create a single, actionable incident to diagnose and troubleshoot the issue to get to the root cause.
- Triage & assign
Prioritize different root causes to determine resolution and route incidents to teams equipped to respond.
- Remediate & Retro
Execute the resolution: scheduling, routing, escalation, development, testing, and collaboration. Then review to prevent future problems with analytics, post-mortems, and processes.
Let’s talk if you’re interested in learning more about why alerting is crucial for long-term systematic health and managing growth. We’re always looking for the best ways to keep customers thriving, innovating, and focused on what matters the most.
EventSources, the sister LogicModule to DataSources, are a useful framework for triggering event-based, contextual alerts from your applications and infrastructure. While DataSources poll your applications and infrastructure for time-series datapoints, EventSources poll (or listen) for interesting events from your log files, SNMP traps, syslogs, Windows Event Logs, and much more. LogicMonitor provides over a dozen EventSources out-of-the-box for common use cases, but building your own Script EventSource can enable alerting for interesting events from a much wider range of sources.
What Are Interesting Events?
If you’re looking to monitor traditional, time-series datapoints like CPU utilization, memory utilization, or latency, DataSources are for you. LogicMonitor provides thousands of DataSources out-of-the-box for common IT vendors and products, each of them rich with interesting datapoints and pre-set alert thresholds.
What if your monitored application exposes interesting events, such as all severe alarms occurring recently, or a specific ID/string in events that you need to know about? What if these events occur infrequently but contain important, contextual information describing what is happening? This is where EventSources come in, triggering alerts in LogicMonitor when an interesting event occurs.
In this article, we’ll walk through how to build customized Scripted EventSources to monitor and alert interesting events exposed from a simple HTTP URL and a REST API.
Script EventSources
Script EventSources are capable of running any script on your Collector, either as embedded Groovy or as any other external script (Python, Ruby, PowerShell, etc.) that’s supported by your Collector’s operating system.


The EventSource is configured to execute the script on a Schedule, as frequently as one minute to as infrequently as one day.

With a Script EventSource, you can generate contextual alerts from countless sources, such as your application’s REST API or from a simple HTTP GET Response. Generally, your script will need to do the following, regardless of the language you write it in:
- Authenticate with the source
- Query for any new, interesting events since the most recent / last poll
- Output the events (after iterating through them) to standard output using the following JSON format:
{
  "events": [
    {
      "severity": "warn",
      "happenedOn": "Thu Jun 01 09:50:41 2017",
      "message": "this is the first message",
    },
    {
      "severity": "warn",
      "happenedOn": "Thu Jun 01 09:50:41 2017",
      "message": "this is the second message"
    }
  ]
}
Your script will need to output three important attributes for each event that it identifies:
- LogicMonitor alert severity (warning, error, or critical)
- A timestamp of the event (numerous formats supported)
- The unique message of the event
The Collector will then process the newly-output events JSON and trigger an alert for each event within your LogicMonitor portal.
Now let’s look at how to configure a few practical, real-world use cases.
Use Case 1: Slack Events
If you manage Slack at your company and have ever browsed Slack’s Status page, you may have seen the occasional incident. With the out-of-the-box Slack Events EventSource, you can easily add Slack to your LogicMonitor portal and begin triggering alerts for when the next incident occurs.
- Import the Slack Events EventSource to your portal from core (if not already in yours) – this LogicModule is considered core to our product and provided out-of-the-box.
- Add a Slack Device to your Resources tab, using any hostname you’d like. For this example, you can use system.hostname = “status.slack.com”
- Append “SlackService” to system.categories property of the Device. This tells LogicMonitor to apply the Slack Events EventSource to this Device.
- Review the embedded Groovy Script and you’ll notice what is happening:
- Authenticate – this information is exposed with a very simple HTTP GET call to Slack’s API. No authentication required!
- Query – the call is made to https://status.slack.com/api/v2.0.0/current using Groovy’s URL class:
def endpoint = "https://status.slack.com/api/v2.0.0/current"

def slackStatus = new JsonSlurper().parse(new URL(endpoint))
The response is raw JSON containing the current incidents, which shows there are currently none (click the API URL above in your browser see it live):
{"status":"ok","date_created":"2020-05-07T21:55:17-07:00","date_updated":"2020-05-07T21:55:17-07:00","active_incidents":[]}- Output – to output each incident, we do the following:
- Iterate through all of them with slackStatus.active_incidents.each to create a Groovy map (outMap) with each event appended
def outMap = ["events": []]- Generate a current timestamp on the Collector with the now.format() method
def outMap = ["events": []]- Generate a current timestamp on the Collector with the now.format() method
def now = new Date()
def tz = TimeZone.getTimeZone('PST')
def dateFormat = "yyyy-MM-dd'T'HH:mm:ss"
def nowPST = now.format(dateFormat, tz)- Print the incidents to standard output by converting outMap to JSON and printing to standard output:
def jsonOut = JsonOutput.toJson(outMap)
println JsonOutput.prettyPrint(jsonOut)- Finally, you can now customize other Alert Settings of the EventSource such as:
- Default Alert Level – the script will automatically categorize the Slack incidents to Warning, Error, and Critical, but Warning is used here regardless.
- Clear After – because these are event-based alerts, you’ll need to specify how long the alert will last in LogicMonitor before cleared. The default is 60 minutes.
- Alert Subject and Message – customize the subject of and message of alert notifications, if necessary.

In summary, this EventSource will query Slack’s status page every three minutes looking for incidents and subsequently triggering an alert once one is found.
Use Case 2: LogicMonitor Audit Logs
Have you ever wanted to trigger an alert on an interesting activity in your LogicMonitor Audit Logs, such as when a LogicModule is updated or a specific user is active in your portal? By using a Script EventSource, the LogicMonitor REST API, and unique search strings inside Resource Properties, you can setup LogicMonitor to trigger alerts when specific events occur in your portal.
In this example, we will create the Script EventSource to query for new Audit Logs occurring within the past 60 seconds, polled every minute. We will then generate Error alerts whenever the username (bborofka) has activity within the portal.
1. Add a Device representing your LogicMonitor portal, with a hostname “<portal>.logicmonitor.com”. Your Collector will monitor the portal’s REST API using this hostname.
2. Configure a User account with (at least) access to Settings – Access Logs, which can be an API-only service account. Create an API Token for this User and save it somewhere secure.
3. In the Resources tab, under your Device’s Info tab, add the API token details as lm.access.id and lm.access.key properties.
4. Here you will also want to add a property for the search string to trigger alerts for. In this example, we will use the property lm.auditlogs.error with the value bborofka, which will trigger Errors for any time “bborofka” is found anywhere within a new Audit Log:

This property will be used as a search string across all Audit Log information/columns (User, IP and Description):

5. Now, let’s create a new Script EventSource. You can add the LogicMonitor_Audit_Logs EventSource to your portal from our Community post here. This EventSource is provided as a public, Community LogicModule and not part of the core LogicMonitor platform.

6. In the EventSource’s Groovy script, we start by retrieving all of the Resource properties you applied previously to use as variables:
// *** Get LM Device Properties
def accessKey = hostProps.get("lm.access.key")
def accessID = hostProps.get("lm.access.id")
def eventWarn = hostProps.get("lm.auditlogs.warn")
def eventError = hostProps.get("lm.auditlogs.error")
def eventCritical = hostProps.get("lm.auditlogs.critical")
def hostname = hostProps.get("system.hostname")
7. Because this EventSource will be configured for a one minute schedule, you will only query for Audit Logs within the past 60 seconds. To do this, you will need to generate epoch timestamps on the Collector for both current time and 60 seconds ago. Epoch timestamp is also used for setting up authentication to the LogicMonitor REST API:
// *** Get current time (now - 60s)
def epochCurrentSeconds = System.currentTimeSeconds()
def epochPreviousSeconds = epochCurrentSeconds - 60
def epochCurrentMillis = System.currentTimeMillis()
8. Now you will generate the REST API base URL, endpoint, and query parameters. Using the two epoch timestamps above, these will both be used in the Audit Logs API query parameters to retrieve only Audit Logs within the time window (using the happenedOn>: property). Many other application REST APIs also support restricting time windows using timestamps or epoch, refer to documentation to find if your application allows this:
// *** Setup URL
def baseUrl = "https://" + hostname + "/santaba/rest"
def endpoint = "/setting/accesslogs"
// "happenedOn>:" set filter to only grab Audit Logs after a designated epoch timestamp
// Query parameters already URL-encoded in this string
def queryParams = "?filter=happenedOn%3E%3A" + epochPreviousSeconds + "&size=1000"
def apiUrl = baseUrl + endpoint + queryParams
9. Next you will setup your LogicMonitor REST API authentication and make the query using HTTP GET to retrieve all Audit Logs within the past 60 seconds (note that the CloseableHttpClient section, and onwards, are encapsulated in a try / catch block in the actual EventSource in order to allow for more graceful error handling and exiting). The LogicMonitor_Audit_Logs EventSource borrows from our Support Center Examples for using HTTP GET with our REST API.
10. Now is the fun part. You will use Groovy’s JsonSlurper class to parse the HTTP response body, convert it to JSON and create a Groovy map to append events to.
// *** Parse LM Audit Logs JSON
def jsonSlurper = new JsonSlurper()
def auditLogs = jsonSlurper.parseText(httpResponseBody)

// *** Create a map for standard output
def outMap = ["events": []]
11. Iterate through the retrieved Audit Logs (if there are any). Use the search strings (eventWarn, eventWarn, eventCritical) brought in earlier from Resource properties to find if there is a match within any of each Audit Log’s three fields: description, username, and ip. If there is a match, you will append the Audit Log to outMap:
// Search Audit Log for matching pattern for Warning property, lm.auditlogs.warn
        if (description =~ eventWarn || username =~ eventWarn || ip =~ eventWarn) {
            def event = ["happenedOn": auditLog?.happenedOnLocal,
                            "severity": "warn"]
            def message = "username: " + username + ", ip: " + ip + ", description: " + description
            event.put("message", message)
            outMap.events += event
        }
12. Then you will print the alerting Audit Logs by converting outMap to JSON and printing to standard output:
// Convert the map to JSON and print to standard output
def jsonOut = JsonOutput.toJson(outMap)
println JsonOutput.prettyPrint(jsonOut)
return 0
13. Finally, set the EventSource Schedule to one minute and Save.

That’s it! Now when a user account “bborofka” takes any action within the LogicMonitor portal, Errors will be triggered with contextual information about the alert within the Alert Value field:

Custom Monitoring With LogicMonitor
These use cases cover just a couple examples of how to use Script EventSources to creatively fetch and alert interesting events from applications’ HTTP URLs and REST APIs. If your application has a documented REST API, you may find useful event information that is exposed and retrievable by authenticating, querying, and outputting the event to trigger alerts by a custom EventSource.
LogicMonitor Professional Services delivers custom LogicModules (such as EventSources) for customers that are tailored to their requirements. If you have a complex or custom monitoring need that you need our help in building, contact your Customer Success Manager for more information about scoping and pricing.
As discussed in a previous blog, here at LogicMonitor, we are in the process of rolling out a new user interface (UI) which is designed to streamline workflows, reduce clicks, and include powerful new features.
So what’s new in the alerts page?
Alerts Page Updates

One of the highlights of the new alerts page is the ability for users to create a set of filters, save them, give them a name that resonates with their team and quickly and easily access them at a later time. In addition, the ability to filter the alerts table based on the time at which an alert began is also new. Out-of-the-box, a number of saved filters have already been preconfigured to help get you started, however, what we are most interested in seeing are the unique combinations you create that increase efficiency and make the most sense to you and your team.
As a daily user, the first thing I may do is come into the alerts page and access my “active alerts only” saved filter, which is showing only alerts that are not in SDT, have not yet been acknowledged, and have not cleared. What used to take 15 clicks to hide these 3 fields from my view, now only takes 2. So if this is something you have to do multiple times a day, this definitely saves you some clicks throughout your work week.
Or perhaps you work within a large enterprise environment with multiple teams that deal with different types of alerts. Now you can create a saved filter based on an escalation chain that only shows alerts that are delivered to your server team… or if your company organizes your infrastructure based on grouped locations, you can create a set of saved filters that shows only alerts originating from the Western hemisphere.
Along the subheader of the new alerts page, a count has been added to show the total number of active alerts, as well as their breakdown by alert severity, SDT status, and acknowledgment state. When clicked, these numbers act as quick filters and by clicking on the total number of alerts the table will sort with the most recent and most severe alerts first.

Bulk Scheduled Downtime
Another net-new feature on the alerts page is the ability to perform a bulk scheduled downtime (SDT).
Upon completion of this action, you will see a confirmation dialog reassuring you that this operation has been successful. A list will also be provided that allows you to see and drill-down into all of the resources that were successfully placed into SDT.

This particular improvement aligns with our UX principles, which is to offer more guidance across the product. This is a common UI element you will find in multiple places across the new UI including the new on-boarding workflow and all the ‘add resource’ wizards and at the end of every singular and bulk-action.
Another goal of the UI refresh initiative was to remove all the contrast, inconsistencies, and friction points across the product and really gut the experience to clean it up from the inside out. You’ll notice this across the platform and we believe it’s the small things that really add up to form the larger overall experience of how someone walks away and remembers using a product.
Sorting the Alerts Table
Users will also have the ability to sort the alerts table by multiple columns (using shift + click) on the table column headers, select between an expanded or condensed and light or bold preference for the alert severity icons … and much, much more.

Moving forward, one of the goals outlined in our product vision is to build a truly world class user interface and user experience. The combination of the two tools outlined above (React and Material Design) allows us to build a solid foundation for us to create, deliver, iterate on feedback and repeat. This really is just the first step in a brand new direction and you will continue to see the UI evolve over time.
Want to know more? Join us for a platform demo.

A Well Designed User Interface Reduces Friction and Lead Time to Resolution

After joining the product management team at LogicMonitor – I was instantly drawn toward pushing improvements to our user interface (UI). After years of growth and agile development LogicMonitor’s UI had taken a toll, a common challenge across rapidly growing software companies. But where do we start and how do we make improvements that streamline workflows and increase productivity for our users?
LogicMonitor was able to conduct extensive research on the user experience and found two major improvements to focus on: reducing clicks and making core platform functionalities easier to access. And with that we are excited to introduce LogicMonitor’s improved user interface. The new interface will make completing tasks in LogicMonitor faster by requiring less clicks and making navigation more intuitive.
Along with extensive research driving improvements, LogicMonitor is also leveraging React and Material Design to guide and implement improvements.
Faster Development with React

React is a JavaScript library that offers a variety of benefits including faster agile development and a more responsive user interface. React also allows for easier implementation of functionality that would’ve otherwise been more cumbersome to accomplish on the front-end, such as dark mode. This means updates and improvements can be pushed out faster to the broader UI.
Consistency with Material Design
Material Design is a visual language created by Google that synthesizes the classical principles of good design with the innovation and possibilities of technology and science. Material Design is simple, intuitive, and present in everyday apps you may already be familiar with like Gmail, Google Calendar, and Google Maps. It is extremely comprehensive, gets updated on a regular basis and essentially, is a product in itself. And most importantly it allows for a single underlying system that unifies the user experience across platforms and devices.
In ITOps when alerts are firing or an outage is imminent and you’re on call, every second and click counts. LogicMonitor kept this at the forefront of design efforts and understands that consistency across interfaces increases familiarity and reduces lead time to resolution. The combination of the two tools outlined above (React and Material Design) allows us to build a solid foundation for us to create, deliver, iterate on feedback and repeat. As we continue to grow there are more plans to insure that we are offering a product that not only offers the best monitoring coverage across your infrastructure but is also easy to use.
The new UI will be rolled out on a page-by-page basis and will be available within the product as soon as they are ready to go live. In the meantime, if you are interested in learning more about how LogicMonitor can help streamline your workflow reach out for a free trial or attend one of our weekly demos.
Audit logs might seem like a simple way to track user actions, but they are actually a powerful tool for troubleshooting and accessing historical data within a system.
For instance, let’s say you notice that the alerting for a particular device group has been unexpectedly disabled. You don’t know how long it’s been in that state or whether it was left off intentionally, and you need to determine when and why that change was made as soon as possible.
Another example is that you need to get all the historical information for a dashboard, including when it was created and whether it was cloned or created from scratch. How would you get either of these pieces of information?
With audit logs.
What is audit logging?
Audit logging is like keeping a diary for your IT systems. It records every important action—who did what, when, and where—within your environment. From logging in to modifying critical configurations, audit logs provide a clear, timestamped trail of events. These logs are essential for understanding system activity, troubleshooting issues, ensuring compliance, and bolstering security. Whether you’re tracing the cause of an outage or investigating a potential breach, audit logs act as your trusted source of truth, giving you the visibility needed to keep your operations running smoothly.
Benefits of audit logging
From identifying unusual activity to streamlining compliance, here’s how audit logging can transform the way you manage your systems.
1. Enhanced security: Spotting the unusual
Audit logs help you detect unusual activity before it becomes a big problem. Imagine someone trying to access sensitive files they shouldn’t. With audit logs, you can trace the attempt back to the exact user, time, and system involved, stopping potential breaches in their tracks.
2. Compliance made easy
Regulations like GDPR, HIPAA, or PCI DSS require proof that your systems are following the rules. Audit logs act as your compliance time machine, providing a clear record of what actions were taken and when. No more scrambling to pull data for audits—it’s all there, neatly organized.
3. Faster troubleshooting
When systems go haywire, audit logs are your go-to tool. Say a dashboard suddenly stops displaying data. Audit logs can reveal if someone accidentally deleted a key component or if it was caused by a system glitch. It’s like having a play-by-play record of every event in your system.
4. Accountability and transparency
With audit logs, there’s no more finger-pointing. If changes are made to critical systems or configurations, the logs tell you exactly who made the change and when. This transparency keeps everyone on the same page and reduces the risk of human error going unnoticed.
5. Investigating security breaches
When something goes wrong—like unauthorized changes or suspicious logins—audit logs help you piece together what happened. Picture this: a user reports that their account was tampered with. By reviewing the audit trail, you can find out who accessed the account, what changes were made, and how to prevent it in the future.
6. Legal and forensic support
Audit logs are your legal allies. Whether it’s proving a document was signed electronically or showing a timeline of events during litigation, these logs provide reliable evidence when it matters most.
7. Proactive security enhancements
By analyzing patterns in your logs, you can identify recurring issues or weak spots in your system. This insight helps you recommend new security procedures or improve your audit processes, staying ahead of potential threats.
Best practices for audit logging
Audit logging is like keeping a detailed journal of everything happening in your IT environment—but not all journals are created equal. To get the most out of your logs, you need to ensure they’re accurate, secure, and actionable. Here’s how to do it right:
1. Log the right data
Not every piece of information is worth logging. Focus on high-value events like user logins, permission changes, data modifications, and access to sensitive resources. Think of it as decluttering: keep what’s essential, and skip the noise that makes analysis harder.
2. Standardize your logging format
A standardized log format is like a universal language for your data. It ensures consistency, making it easier to analyze and correlate logs from multiple systems. For example, include key details like timestamps, event types, user IDs, and system information in every log.
3. Protect log integrity
Your logs are only as useful as they are trustworthy. Use tamper-proof storage solutions and implement access controls to prevent unauthorized changes. Consider hashing or digitally signing logs to ensure they haven’t been altered.
4. Retain logs for the right amount of time
Compliance regulations or internal policies often dictate how long logs need to be stored. Strike a balance: too short, and you might lose critical data; too long, and you risk unnecessary storage costs. Automate log retention policies to simplify management.
5. Monitor and analyze logs regularly
Logs aren’t just for emergencies. Schedule regular reviews or use automated tools to monitor them for unusual patterns or anomalies. Think of it like checking your car’s dashboard—spotting issues early can prevent bigger problems down the road.
6. Use automation and centralized storage
Manually parsing logs is like searching for a needle in a haystack. Leverage automated tools and centralized storage solutions to aggregate logs from all systems. This way, you can correlate events across your entire IT ecosystem for faster insights.
7. Secure your logs
Logs can contain sensitive data, so they deserve the same level of protection as your most critical systems. Encrypt logs both in transit and at rest, and restrict access to authorized personnel only. It’s like putting a lock on your diary—only trusted readers should have access.
8. Audit your audit logs
Yes, even audit logs need oversight. Regularly review your logging configurations to ensure you’re capturing what’s needed and meeting compliance requirements. Periodically test your log storage and access policies to confirm they’re up to standard.
9. Plan for incident response
When an incident happens, your logs are often your first line of defense. Make sure your team knows where to find logs, how to analyze them quickly, and what steps to take next. Preparing ahead of time can save critical minutes during a crisis.
10. Align logging with compliance requirements
Different industries have different rules about logging. Ensure your audit logs meet the requirements for frameworks like GDPR, HIPAA, or PCI DSS. This alignment not only keeps you compliant but also reduces headaches during audits.
Common audit logging challenges and solutions
Even with all their benefits, audit logs come with their own set of challenges. Understanding these hurdles and how to overcome them ensures you’re getting the most out of your logging system.
Here are some common issues and practical solutions:
1. Overwhelming log volumes
- Problem: With modern IT systems generating vast amounts of data, identifying critical insights can feel like finding a needle in a haystack.
- Solution: Use centralized log management tools and set up filters to prioritize high-value events. Automation tools can also parse logs in real time to surface anomalies or trends.
2. Retention limits
- Problem: Storage space or policy restrictions might limit how long logs are retained, leading to the loss of valuable historical data.
- Solution: Implement retention policies that balance compliance needs with storage capacity. Offload older logs to cost-effective cloud storage for long-term log retention.
3. Ensuring log integrity
- Problem: Logs can be tampered with or deleted, compromising their reliability and security value.
- Solution: Use tamper-proof storage solutions and employ encryption for logs in transit and at rest. Digital signatures or hash functions can also verify the authenticity of logs.
4. Logging blind spots
- Problem: Some systems or actions might not be included in your audit logs, creating gaps in visibility.
- Solution: Regularly review logging configurations to ensure all critical systems and activities are being monitored. Invest in tools that can integrate across hybrid and multi-cloud environments.
5. Difficulty in log analysis
- Problem: Manually analyzing logs is time-consuming and error-prone, especially in high-pressure situations like incident response.
- Solution: Leverage AI-powered analytics tools to identify patterns, detect anomalies, and provide actionable insights faster.
By addressing these challenges head-on with the right strategies and tools, you can transform audit logs from a raw data repository into a powerful resource for improving your IT operations.
LogicMonitor for Audit Logs
First off, Audit Logs can be queried from the LogicMonitor API. These results can be further refined for post-processing and analysis. From within the portal, there are two main ways to access Audit Logs, from the Audit Logs page and with Audit Log Reports.

From here, you can search on any object within the portal from the past several months. I know what you’re thinking; what if I need to search further than one or two months into the past? Never fear, the Audit Log Report has you covered. More on that in a bit.
The Audit Log page has a built-in user filter as well, so you can select individual users to narrow results. Maybe you’ve had trouble finding the results you’re looking for, but you know only one of three users has the permissions necessary to take that action. You can filter on those three users specifically to help find the log entry desired. After finding the desired information, you can download to a CSV file of your results or create an Audit Log Report out of your search.

Powering Up Audit Logs with Reports
The Audit Log Report is where Audit Logs get magical. You can access the Audit Logs Report through the Reports page or by selecting ‘Create Report’ on the Audit Logs page. Instead of being limited to the past several months, this report can search as far back as your LogicMonitor package alert history storage specifies. Need to look back at the history of that Service you created last year? Here’s where you can find those logs. The Audit Log Report contains the same search capability and user filter as the Audit Log page, but also allows you to generate in PDF and HTML formats as well as enabling you to sort returned results by User instead of Date.

Scheduling an Audit Log Report
Most importantly, the Audit Log Report can be set to run on a schedule. This serves several purposes. If your portal has a Resource, Dashboard, Group, User, etc that has had a lot of action recently, and you want to keep tabs on it, you can build a report and set it to update you on a regular basis with a log of all actions related to that object. Also, if you have Audit Log data that’s in danger of being removed from the system because of your alert history storage limits, you can generate and export an Audit Log Report on a regular basis to back up this data on your system.

All in all, Audit Logs are a powerful and underutilized tool within LogicMonitor. Take advantage of them to make managing and investigating your LogicMonitor platform even easier.
While LogicMonitor has a robust built-in alert delivery, escalation, and reporting system, you may be using other tools in parallel to access and store IT information. We’ve talked before about integrating LogicMonitor and Jira – including how to monitor tickets created in Jira with LogicMonitor, and how to use Jira queries to trigger and escalate alerts in LogicMonitor. (This enables anyone to use LogicMonitor’s escalations to page on-call engineers by creating a specific type of ticket in Jira. It also enables LogicMonitor to automatically escalate Jira issues if they are not being resolved within the required SLA.)
This time we want to talk about the other direction: how to use LogicMonitor to create and resolve Jira issues that occur in response to LogicMonitor alerts. At LogicMonitor, our TechOps team works with alerts directly in the LogicMonitor platform, but our Account Management team prefers to use Jira to see the same type of information – so we put the data in both systems using LogicMonitor’s integrations capabilities.
While LogicMonitor has a variety of pre-built integrations, Jira is not officially one of them given Jira’s vast array of configuration variations. However, LogicMonitor’s custom HTTP delivery integration can be used to create an integration with many tools and services, including Jira (especially given Jira’s robust REST API).
To create your own Jira/LogicMonitor integration, follow these steps:
- From Settings -> Integrations, click Add – “Custom HTTP Delivery”
- Give your new integration a name and description, and select “Use different URLs or data formats to notify on various alert activity”. (This allows LogicMonitor to take different actions in Jira, depending on whether the alert is being created, escalated, or cleared.)
- You’ll need to first specify what to do with new alerts: For Jira, you should be POSTing to the API endpoint of your server that will create alerts (jira.example.com/rest/api/2/issue), and providing username and password values. The Alert Data should be set to Raw JSON, and the payload should look something like the following:

- Change the Project key and IssueType fields to ones that exist in your Jira workflows.
- If you want LogicMonitor to update the status of your Jira tickets when the alert changes state or clears, you’ll need to capture Jira’s identifier for the ticket that is created by the above POST.
- To do so, check the box that says “Include an ID provided in HTTP response when updating alert status” and complete the form that displays:

- This says to LogicMonitor, “When you create a Jira issue, capture the response Jira replies with and look for a JSON object called ‘key’, and remember that object.” When you do create a ticket, Jira will reply like this:

By telling LogicMonitor to grab the “key” field, LogicMonitor will get the ticket ID from Jira’s point of view (“TST-24” in the above example). LogicMonitor can refer to that in future actions on that ticket, with the ##EXTERNALTICKETID## token.
- To do so, check the box that says “Include an ID provided in HTTP response when updating alert status” and complete the form that displays:
- Now we can tell LogicMonitor what to do with cleared alerts; in this case, we want to close them in Jira (which is a “transition” in Jira language). To do so, add an alert status handler for cleared alerts that looks like the following (note that it references the ##EXTERNALTICKETID## token, to pass in the ticket we want to transition):

- Set the payload to the following:

- Ensure that you set the transition ID to the appropriate value for the transition from “Open” to “Closed” in your Jira system.
Save your method, and add your newly created delivery method to an escalation chain that is called by an alert routing rule – and you should have Jira issues being created by alerts, and automatically closed when they clear, as illustrated by the below:

This example was for Jira, but the same process can be used to build an integration with any tool that accepts HTTP calls with LogicMonitor. You can also be more creative by triggering different flows when alerts increase or decrease in severity, not just clear. So, if your boss wants to see alerts in his custom Visual Basic workflow tool he wrote himself 15 years ago in .ASP, you can say “Yes, sir!” (LogicMonitor does have Professional Services that can help with custom integrations – but they’d probably prefer not to be involved in that case.)
Want to see more? Follow us here:
On Facebook
On Twitter
On LinkedIn
Or, e-mail us @ [email protected]