Use this guide to write a golang application emitting traces using the OpenTelemetry Protocol (OTLP) Specification. All you need is a basic understanding of developing applications in golang.
Init the Project
To get started, create a new directory structure by using the following code snippet and run the command go mod init github.com/<Username>/simple-go-service in the same directory. Replace the “Username” with your github username. This will create a go.mod file, which is used by Go to manage imports. Then, create a new file named main.go where we will place our Go code.
mkdir -p cmd/simple-service
go mod init github.com/USERNAME/simple-go-service
touch cmd/simple-service/main.go
Create Resource Detectors
The resource describes the object that generated the telemetry signals. Essentially, it must be the name of the service or application. OpenTelemetry has defined the standards to describe the service execution env, viz. hostname, hostType (cloud, container, serverless), namespace, cloud-resource-id, etc. These attributes are defined under Semantic Conventions or semcon. OpenTelemetry semantic conventions are agreed upon standardized naming patterns and the golang semantic conventions package can be found here.
In this example, we are defining the resource with a few env var settings of the application. Users can extend this detectResource method to detect resource attributes as per the underlying resource-providing infra (K8s-apiserver, cloud-api, any other discovery).
func detectResource(ctx context.Context) (*resource.Resource, error) {
    res, err := resource.New(ctx,
        resource.WithAttributes(
            semconv.ServiceNameKey.String("product-service"),
            semconv.ServiceNamespaceKey.String("US-West-1"),
            semconv.HostNameKey.String("prodsvc.us-west-1.example.com"),
            semconv.HostTypeKey.String("system"),
        ),
    )
    return res, err
}
Init Span Exporter
The exporter is the component in SDK responsible for exporting the telemetry signal (trace) out of the application to a remote backend, log to a file, stream to stdout. etc.
In this example, we are creating a gRPC exporter to send out traces to an OpenTelemetry receiver backend running on localhost:55680. Possibly an OpenTelemetry Collector. Users can extend it to support any application authentication mechanism using either mTLS or Application Auth token in gRPC headers.
func spanExporter(ctx context.Context) (*otlptrace.Exporter, error) {
    return otlptracegrpc.New(ctx, otlptracegrpc.WithInsecure(),
        otlptracegrpc.WithEndpoint("localhost:55680"),
        otlptracegrpc.WithDialOption(grpc.WithBlock()),
    )
}
Init Span Processors
Span processors are responsible for CRUD operations, batching of the requests for better QoS, Sampling the span data based on certain conditions. Here we are creating a batch Span Processor for batching the spans before flushing out to network via exporters.
bsp := sdktrace.NewBatchSpanProcessor(traceExporter)Construct TracerProvider
The sdk/trace Package contains support for OpenTelemetry distributed tracing. The NewTracerProvider returns a new and configured TracerProvider.
By default the returned TracerProvider is configured with:
- a ParentBased(AlwaysSample) Sampler
- A random number IDGenerator
- The resource.Default() Resource
- The default SpanLimits
The passed opts are used to override these default values and configure the returned TracerProvider appropriately.
tp := sdktrace.NewTracerProvider(sdktrace.WithSpanProcessor(bsp),
    sdktrace.WithResource(res),
    sdktrace.WithSampler(sdktrace.AlwaysSample()),
)
defer func() { _ = tp.Shutdown(ctx) }()
Init Propagators
OpenTelemetry propagators are used to extract and inject context data from and into messages exchanged by applications. The default propagator supported by OTEL is the W3C Trace Context encoding and W3C Baggage.
propagator := propagation.NewCompositeTextMapPropagator(propagation.Baggage{}, propagation.TraceContext{})Create Tracer
Package OTel provides global access to the OpenTelemetry API. The subpackages of the OTel package provide an implementation of the OpenTelemetry API.
The provided API is used to instrument code and measure data about that code’s performance and operation. The measured data, by default, is not processed or transmitted anywhere.
An implementation of the OpenTelemetry SDK, like the default SDK implementation, and associated exporters are used to process and transport this data – as we discussed in the exporters section.
In the example below, we are creating a tracer from the provider factory, configuring the context propagation for spans across multiple services. Finally, creating the tracer object. The tracer object is responsible for managing and creating spans.
The otel.Tracer creates a named tracer that implements the tracer interface. If the name is an empty string, then the provider uses the default name.
otel.SetTracerProvider(tp)
otel.SetTextMapPropagator(propagator)
tracer := otel.Tracer("example.com/basictracer")
Define Span Attributes
The span is a single execution of an operation. It is identified by a set of attributes, which are sometimes referred to as span tags. Application owners are free to choose the attributes which can capture required information for the spans. There is no limit to the number of span attributes per span.
In this example, we are defining two span attributes for our sample applications.
priority := attribute.Key("business.priority")
appEnv := attribute.Key("prod.env")
Create Span
Here we are asking the tracer to start a span and end it once the execution goes out of scope.
var span trace.Span
ctx, span = tracer.Start(ctx, "HTTP GET /products/{id}")
defer span.End()
Add Events/Logs to Spans
Spans can be enriched with some execution logs/events that happened during the execution of the span. This information will help provide contextual logs tied up with the respective span.
span.AddEvent("Authentication", trace.WithAttributes(attribute.String("Username", "TestUser")))
span.AddEvent("Products", trace.WithAttributes(attribute.Int("ID", 100)))
Add Span Attributes to Span
Here we are setting the values to the span attributes that we identified earlier.
span.SetAttributes(appEnv.String("UAT"))
span.SetAttributes(priority.String("CRITICAL"))
Putting It Together
package main

import (
    "context"
    "log"

    "go.opentelemetry.io/otel"
    "go.opentelemetry.io/otel/attribute"
    "go.opentelemetry.io/otel/exporters/otlp/otlptrace"
    "go.opentelemetry.io/otel/exporters/otlp/otlptrace/otlptracegrpc"
    "go.opentelemetry.io/otel/propagation"
    "go.opentelemetry.io/otel/sdk/resource"
    sdktrace "go.opentelemetry.io/otel/sdk/trace"
    semconv "go.opentelemetry.io/otel/semconv/v1.4.0"
    "go.opentelemetry.io/otel/trace"
    "google.golang.org/grpc"
)

func detectResource(ctx context.Context) (*resource.Resource, error) {
    res, err := resource.New(ctx,
        resource.WithAttributes(
            semconv.ServiceNameKey.String("product-service"),
            semconv.ServiceNamespaceKey.String("US-West-1"),
            semconv.HostNameKey.String("prodsvc.us-west-1.example.com"),
            semconv.HostTypeKey.String("system"),
        ),
    )
    return res, err
}

func spanExporter(ctx context.Context) (*otlptrace.Exporter, error) {
    return otlptracegrpc.New(ctx, otlptracegrpc.WithInsecure(),
        otlptracegrpc.WithEndpoint("localhost:55680"),
        otlptracegrpc.WithDialOption(grpc.WithBlock()),
    )
}

func main() {

    ctx := context.Background()
    traceExporter, err := spanExporter(ctx)
    if err != nil {
        log.Fatalf("failed to initialize stdouttrace export pipeline: %v", err)
    }

    res, err := detectResource(ctx)
    bsp := sdktrace.NewBatchSpanProcessor(traceExporter)
    tp := sdktrace.NewTracerProvider(sdktrace.WithSpanProcessor(bsp),
        sdktrace.WithResource(res),
        sdktrace.WithSampler(sdktrace.AlwaysSample()),
    )
    defer func() { _ = tp.Shutdown(ctx) }()
    otel.SetTracerProvider(tp)
    propagator := propagation.NewCompositeTextMapPropagator(propagation.Baggage{}, propagation.TraceContext{})
    otel.SetTextMapPropagator(propagator)

    tracer := otel.Tracer("example.com/basictracer")
    priority := attribute.Key("business.priority")
    appEnv := attribute.Key("prod.env")

    func(ctx context.Context) {
        var span trace.Span
        ctx, span = tracer.Start(ctx, "HTTP GET /products/{id}")
        defer span.End()
        span.AddEvent("Authentication", trace.WithAttributes(attribute.String("Username", "TestUser")))
        span.AddEvent("Products", trace.WithAttributes(attribute.Int("ID", 100)))
        span.SetAttributes(appEnv.String("UAT"))

        func(ctx context.Context) {
            var span trace.Span
            ctx, span = tracer.Start(ctx, "SELECT * from Products where pID={id}")
            defer span.End()
            span.SetAttributes(priority.String("CRITICAL"))
            span.AddEvent("Datababse", trace.WithAttributes(attribute.Int("Count", 20)))
        }(ctx)
    }(ctx)
}
Run the Application
Finally, we run this instrumented application to get traces in the LogicMonitor platform.
go run main.goTraces received at LogicMonitor platform.

Detailed view of the span.

Constructed Trace
Resource labels:
    -> host.name: STRING(prodsvc.us-west-1.example.com)
    -> host.type: STRING(system)
    -> service.name: STRING(product-service)
    -> service.namespace: STRING(US-West-1)
InstrumentationLibrarySpans #0
InstrumentationLibrary example.com/basictracer
Span #0
    Trace ID   : aadf3c506b66cdbb3bdca3042f531353
    Parent ID  : eaf64b7cf9d4bdb8
    ID         : 45d9025bf40903d3
    Name       : SELECT * from Products where pID={id}
    Kind       : SPAN_KIND_INTERNAL
    Start time : 2021-07-20 09:55:42.609895 +0530 IST
    End time   : 2021-07-20 09:55:42.609896037 +0530 IST
    Status code : STATUS_CODE_OK
    Status message :
Attributes:
    -> business.priority: STRING(CRITICAL)
Events:
SpanEvent #0
    -> Name: Datababse
    -> Timestamp: 1626755142609896000
    -> DroppedAttributesCount: 0
    -> Attributes:
        -> Count: INT(20)
Span #1
    Trace ID   : aadf3c506b66cdbb3bdca3042f531353
    Parent ID  :
    ID         : eaf64b7cf9d4bdb8
    Name       : HTTP GET /products/{id}
    Kind       : SPAN_KIND_INTERNAL
    Start time : 2021-07-20 09:55:42.609884 +0530 IST
    End time   : 2021-07-20 09:55:42.609900603 +0530 IST
    Status code : STATUS_CODE_OK
    Status message :
Attributes:
    -> prod.env: STRING(UAT)
Events:
SpanEvent #0
    -> Name: Authentication
    -> Timestamp: 1626755142609891000
    -> DroppedAttributesCount: 0
    -> Attributes:
        -> Username: STRING(TestUser)
SpanEvent #1
    -> Name: Products
    -> Timestamp: 1626755142609893000
    -> DroppedAttributesCount: 0
    -> Attributes:
        -> ID: INT(100)
Conclusion
Congratulations, you’ve just written a golang application emitting traces using the OpenTelemetry Protocol (OTLP) Specification. You can use this code as a reference when you get started with instrumenting your business application with OTLP specifications. LogicMonitor APM specification is 100% OTLP compliant with no vendor lock-in. To receive and visualize traces of multiple services for troubleshooting with LogicMonitor platform sign up for a free trial account here. Check back for more blogs covering application instrumentation steps for distributed tracing with OpenTelemetry standards across multiple languages.
Monitoring solutions can either pull monitoring information from devices by querying those devices, or the devices themselves can use code to push data using an API into the monitoring system. Both work equally as well but have separate use cases. It is not always possible to query a device remotely, which means asking the device itself to send the data out to the monitoring platform is easier. Keep reading to learn more about push metrics and when it makes the most sense to use it.
In this blog we will cover:
- Use Cases for Push Metrics
- Detailed Use Cases for Push Metrics
- Benefits of Using Push Metrics Instead of Pull
- Limitations of Push Metrics
- LogicMonitor’s Approach to Push Metrics
- Customer Feedback
Use Cases for Push Metrics
As computing architecture evolves into more ephemeral, transient, and stateless instances, the ability to bypass collectors and push data directly to a monitoring platform for ingestion is vital. A few prominent broad use cases for push metrics include:
Serverless Computing Services Monitoring
Serverless computing services such as AWS Lambda are well suited for the push model of data ingestion.
Custom Metric Monitoring
The push metrics REST API provides the ability to report the data from within the app itself, without the need to define or configure external entities. This is helpful for monitoring health metrics in a DevOps environment (for example, CI/CD pipeline metrics, autoscaling application metrics, and so on) and business metrics such as the number of new orders.
Transient Resource Monitoring
Many of today’s computing instances are transient in nature (for example, containers, batch jobs, services running as a cluster, scripts, cron jobs, and so on). Their locations, time to live (TTL), and other attributes are completely transactional. Typically, these instances are also stateless and do not have any historical information about themselves. Pulling data from these transient resources using traditional resource monitoring methods is a complex undertaking; pushing the data, on the other hand, is a very efficient monitoring model.
Detailed Use Cases for Push Metrics
| Use Case/Description | Metrics |
|---|---|
| Applications running on transient compute Container/VM supporting autoscaling | Number of API calls served by an application running within the container -From within the application running within a container, intercept the API calls and report periodically Resource utilization by application -From within the application running within a container, intercept the API calls and report periodically |
| Custom business metrics Push business metrics for business service (running on multiple hosts/containers). Agnostic to the language of the business application. | Number of new orders Number of orders shipped Purchase rate |
| IoT devices | Temperature Production count Device availability |
| Serverless computing services AWS Lambda | Number of times Lambda functions are invoked per minute -From within the function that has been invoked, send the data on each invocation Processing time/lifetime of Lambda instance -Compute the time taken to serve the request and send it before terminating the called function |
| Synthetic monitoring | Availability Response Errors |
| Ticket management systems Using Jira as an example, as tickets are created by various stakeholders, JIRA REST APIs can be used to collect custom data about the tickets which can then be sent to LogicMonitor. | Number of new tickets Number of tickets closed Number of tickets created for priority stakeholders |
| Transient systems Lambda functions are invoked on events performed by AWS services such as S3, DynamoDB, Kinesis, SNS, and CloudWatch. Invocation is purely random and the code executed is stateless on each invocation; hence only instant data can be reported. | Cron job -Number of tasks processed Script -Status of the script execution launched for either sending events, remote action, or creating tickets -Parse logs and send metrics Script for OS monitoring of CPU usage, memory usage, disk I/O, network usage -Infrastructure in use by each container and overall across all containers -Use a PowerShell script or executable to collect the data and send it periodically to LogicMonitor -Exporter plug-in for OpenTelemetry, Nagios, or other technology could also be used |
What Are Some Benefits of Using Push Metrics Instead of Pull?
If your device only connects periodically to the internet and has a dynamic IP address, using traditional pull mechanisms to extract monitoring data is not going to work. Push metrics here would be the only way to access monitoring data.
What Are Some Limitations of Push Metrics?
The push model employed by push metrics could theoretically make it difficult to control the volume of data the monitoring system is receiving in a larger IoT environment. If you are leveraging push metrics for a large sensor network this could theoretically overwhelm the monitoring platform. Also, security for pushing metrics is harder to configure as you need to apply local TLS certificates to every device communicating with the platform.
LogicMonitor’s Approach to Push Metrics
LogicMonitor’s push metrics feature allows you to send metrics directly to the LogicMonitor platform via a dedicated API, removing the need to route the data through a LogicMonitor Collector. Once ingested, these metrics are presented alongside all other metrics gathered via LogicMonitor, providing a single pane of glass for metric monitoring and alerting.
The push model employed by push metrics, as opposed to the pull model that is traditionally employed by our DataSources, is beneficial across many use cases where the installation of a collector is cumbersome or not feasible.
Enabling Observability With Push Metrics
We asked our customer, Nuno Rosa, Enterprise Architect and Monitoring Specialist at Infosys his thoughts on our new push metrics capabilities. Here’s what he had to say:
“LogicMonitor’s push metrics API provides endpoints that enable integrators to push raw data from an external source. Bi-directionality between LogicMonitor and other applications, we’ll gain new momentum with the ability to push metrics (i.e. ServiceNow incident information attached to alerting and the ability to see incident progress and interactions from the LogicMonitor console). The ability to push metrics will also allow us to send business-centric data into LogicMonitor, enabling additional observability into operational intelligence and diversifying the user audience to include non-technical personas.
Serverless computing is becoming a trend within major corporations and becoming a key accelerator for green policies by optimizing power usage (PuE). Push metrics will become a must-have to adapt to new monitoring capability requirements.”
People around the world depend on Managed Service Providers (MSPs) to keep their businesses running like clockwork, even as their IT infrastructure evolves. Keeping workflows efficient leads to higher profits, but this can be a challenge due to a mix of on-premises infrastructures, public and private cloud, and other complex customer environments. The shift to remote work in 2020 due to the COVID-19 pandemic has only made this more challenging for MSPs. In order to adapt, more and more MSPs are investing in IT infrastructure monitoring and artificial intelligence (AI).
Keep reading for an overview of the LogicMonitor AIOps Early Warning System and how dynamic thresholds can mitigate these common challenges and add value for MSPs.
The AIOps Early Warning System
The AIOps Early Warning System intelligently detects signals from noise. This helps you identify where to efficiently allocate your engineers’ time. Quickly identifying these signals also helps you resolve issues faster. The Early Warning System consists of four main components: anomaly detection, dynamic thresholds, topology, and root cause analysis.
Anomaly Detection
Anomaly detection lets you visualize expected performance and compare it to historical offsets. Within the LogicMonitor platform, you can pop out an anomaly detection view to see whether what you’re seeing is normal performance or an anomaly. This saves engineers time in the troubleshooting process by allowing them to eliminate metrics or indicators that aren’t relevant.
Dynamic Thresholds
Dynamic thresholds expand on the visual anomaly detection that we offer in our metrics. Dynamic thresholds limit alert notifications based on normal behavior, such as knowing that the CPU on a server is always hot during a certain time of day. Since it detects and alerts on deviations from normal behavior, dynamic thresholds will allow you to catch deviations like a server CPU going to 0% when it is supposed to be busy.
Topology
Topology automatically discovers relationships for monitored resources. It is a key part of the next component, root cause analysis.
Root Cause Analysis
Root cause analysis leverages topology to limit alert notifications. It identifies what the root incident is and group alerts due to dependencies. For example, if a firewall goes down, LogicMonitor knows what other things depend on the firewall and will only send one alert instead of many.

How Dynamic Thresholds Add Value For MSPs
Combined with other features from LogicMonitor’s Early Warning System, dynamic thresholds can help MSPs more proactively prevent problems that result in business impact. Let’s dive a little deeper into why dynamic thresholds are a key component in issue detection.
#1- Increase Productivity
The biggest benefit of dynamic thresholds is the fact that it saves engineers time. By detecting a resource’s expected range based on past performance, dynamic thresholds reduce alert noise and only send alerts when an anomaly occurs. This means that the alerts that engineers receive are meaningful. They spend less time looking at alerts and can help more customers.
#2- Resolve Issues Faster
Dynamic thresholds don’t make you wait for the static amounts to be hit, which could take hours or days. It quickly detects deviations and determines whether the alert is a warning, error, or critical. As soon as an anomaly is detected, an alert is sent to get human eyes on it. Being able to hone in on the exact cause of the alert provides engineers with more context so issues can be resolved faster.
#3- Reduce Costs
Along with saving time and resolving issues quicker, dynamic thresholds also allow MSPs to reduce costs. Experienced engineers, which are expensive, no longer need to handle monitoring and can focus on other areas of the business. Dynamic thresholds make the task of chasing thresholds easier, and less experienced engineers are empowered to do monitoring and really understand what’s going on and where their attention needs to be focused. Less experienced engineers using less time to figure out issues means more money in your pocket.

The intelligence of dynamic thresholds combined with LogicMonitor’s comprehensive monitoring coverage ensures that MSPs have the visibility they need to succeed even in the most complex of environments. To learn more about how LogicMonitor can reduce costs and accelerate workflows for MSPs, check out this on-demand webinar.
Microsoft Azure and Microsoft, in general, has a history of being seen as designed for big enterprises only. Those days are in the past. Azure is working its way to the front of the pack for cloud services. It is easy to transition your workflows to Azure because it connects well with other Microsoft tools you use. Even though it is a smoother transition, it is just as complex and complicated as other large cloud providers. Keep reading to learn more about Microsoft Azure and how to better monitor your cloud infrastructure to provide business value and get the most out of what you pay for.
Microsoft Azure
Microsoft Azure offers everything from Infrastructure-as-a-Service (IaaS) through Platform-as-a-Service (PaaS) cloud services. Azure also provides many ways to connect through existing Microsoft applications and SaaS services. This continues to blur the line between infrastructure and services, but it also allows you to easily integrate other Microsoft offerings with your Azure cloud.
Azure offers replacements for the on-premise infrastructure and Infrastructure-as-a-Service (IaaS) that allows traditional IT infrastructure professionals to take advantage of the knowledge they already have. From simple Virtual Machines (VM) that have the ability to auto-scale and provide compute power when needed, to SQL and file storage options called SQL Database Service and Storage Service respectively. One thing to know about Azure is their naming tends to be straightforward.
As we continue down the stack to Platform-as-a-Service (PaaS), Azure provides options for application hosting (App Services) and Kubernetes hosting (Kubernetes Service also marked as AKS). These are just a few examples of stretching the legs of Azure as a full-service cloud platform. With Azure Monitor, you are able to monitor all of your services within Azure. This provides some visibility, but understanding the impact beyond these simple metrics requires a little bit of time or some help. Sometimes both.
Monitor your Azure
You need to fully understand your cloud infrastructure and know how it is performing to ensure you are able to provide business value and get the most out of what you pay for. Focusing on just Azure will require you to understand each service and what metrics provided by the service matter the most to performance and utilization. This ranges from simple understandings, like CPU utilization and storage or memory usage, to complexities that come with auto-scaling and serverless functions (helpfully called Functions in Azure). Aside from the complexities, you also need to understand what thresholds should be considered. Luckily, LogicMonitor has monitoring coverage for over 50 Azure services with more than 130 default alerting statistics.
To top it off, monitoring your cloud infrastructure with LogicMonitor allows you to leverage all of your infrastructures to monitor your critical business performance. LM grows with you, allowing you to have a single pane view of all the critical on-premises, cloud, and log monitoring to allow you to respond quickly to your infrastructure needs. With features like Dynamic Thresholds and Service Insights, you can modify LogicMonitor to provide clear insights on your Azure infrastructure and so much more.
To learn more about how LogicMonitor can help you monitor and understand your Microsoft Azure usage and infrastructure or to see it in action, sign up for a free trial.
Google Cloud Platform (GCP) is a crowd favorite of both developers and large enterprise consumers. While some smaller GCP services occasionally shut down with little warning, the main GCP services continue to grow in both adoption and functionality. Monitoring and understanding GCP usage across an organization becomes more complex as the organization grows and functionality increases. Keep reading to learn more about GCP and how to better monitor your GCP infrastructure to reduce business-critical outages.
Google Cloud Platform
Google Cloud Platform offers everything from Infrastructure-as-a-Service (IaaS) through Platform-as-a-Service (PaaS) cloud services. For GCP, they seem to build services they use and wish to use, then provide them to their clients.
Traditional on-premise infrastructure groups are starting to move their infrastructure to a hybrid cloud or exclusively cloud layout. GCP offers services like Compute Engine and App Engine that provide virtual infrastructure to run servers that are managed by the customer and allow the same flexibility of function as running your own servers. GCP also offers a variety of storage services including Cloud Storage and any number of database services. These clients will also likely utilize Cloud DNS and Virtual Private Cloud (VPC) for networking between these services.
However, GCP also targets the world of cloud-native organizations. These organizations will likely leverage cloud services like Cloud Functions, GCP’s serverless on-demand computing power. They may also leverage Kubernetes (k8s) and other container-based services. GCP is also known for its features related to “Big Data” including machine learning services.
There are any number of combinations of GCP services geared to all sectors of the market. You do not need to be a high tech company to leverage GCP. Their goal is to bring cloud computing optimizations to all of their customers, wherever they are, meet them at the level they need, and help them serve their business needs.
Monitor Your GCP Infastructure
Now that you are adopting your GCP cloud strategy, you will need to be able to monitor and interact with these services to make sure your infrastructure is holding up its end of the bargain. Being able to hold a high-level understanding of your infrastructure while also trusting that it is operating correctly requires the right tooling. An understanding of each service’s business metrics can be difficult, and knowing what to alert on is even more challenging. The interactions of all your GCP services become quite intricate. LogicMonitor offers a solution called Service Insights that allows you to logically group your monitored services to business-level functionality.
GCP can and should be leveraged to make sure your business runs at top performance. Let LogicMonitor help you understand and optimize your GCP cloud services so that you can focus on the important aspects of running your business. LogicMonitor can be the tool to help you gain confidence in the functionality of your GCP infrastructure and grow your responses to cloud infrastructure needs before they become business-critical outages. Knowing what to alert on and what metrics to watch for each cloud service can be very complex. With more than 65 Out-of-the-Box alerts for metrics across the monitored GCP services, you can trust LogicMonitor to help you monitor your infrastructure.
To learn more about how LogicMonitor can help you monitor and understand your GCP usage and infrastructure or to see it in action, sign up for a free trial.
Gaming is a vast industry that is continuing to grow. Multi-player cloud-based games especially are becoming more popular and taking the market by storm. With everything going on in the world, it’s no wonder people are looking for a bit of downtime and a way to escape the tribulations of everyday life.
Game developers face many challenges in order to get their games on the screens of as many global players as possible. An Infrastructure Performance Monitoring (IPM) platform can help meet these challenges head-on. Keep reading to learn more about IPM platforms and how they can solve common issues that game developers face.
Game Development Challenges
Online gaming has morphed into a multi-headed beast. Running backend services like chat, authentication, customer support, and matchmaking is essential for any multiplayer game. The challenge here is having the necessary microservices running on the infrastructure to make all this function correctly.
When the goal is to scale games globally, the challenges become even greater. One of the main concerns is decreasing latency and lag time. The infrastructure needs to be running flawlessly to make this happen. Developers must be proactive, not reactive to problems. An IPM platform identifies and alerts users to issues before they become real problems.
When people all over the world are playing a game, often on shaky connections to the server, lag time is a big concern. Having a robust infrastructure is key to a good user experience, otherwise, frustrated players will go elsewhere to pass the time.
Possible Infrastructure Issues
It’s essential to monitor and manage the infrastructure without disrupting operations. Doing this well can be tricky for several reasons:
- Scaling operations to match increased or decreased demand is a balancing act of providing responsive gameplay and infrastructure costs. When not done correctly, users can be aggravated or money can be lost.
- Increased users require more data to be processed, and if the infrastructure isn’t capable, gameplay can become worse. This can cause user churn or even infrastructure collapse from the load.
- Monitoring data and looking for trends can be time-consuming. By the time a problem is identified or changing demand for services is noticed, it may be too late to make the necessary changes.
Infrastructure Solutions
One of the biggest mistakes a game developer can make is thinking they can manage all of their infrastructure needs on their own. Finding the right IPM platform is a necessity for a successful game developer.
What Does an IPM Do?
The short answer: makes your life a whole lot easier. The right IPM platform monitors the entire infrastructure so that developers can focus on the essential things, like game development.
An IPM platform monitors the entire infrastructure and gives real-time status updates on everything the infrastructure is running. It will alert developers to anomalies and possible issues before they become critical. An IPM keeps track of many things, but let’s hit the four big ones. An IPM gives information on:
- Latency: The time taken to perform a request. The lower the latency, the less noticeable the lag. Get alerted if your latency times increase.
- Traffic: The number of requests the servers receive.
- Errors: The number of errors occurring concerning requests. Keeping errors low keeps players happy.
- Saturation: The amount of capacity being used at any given time. Too much freed up capacity can be nearly as harmful as not enough through overhead costs. It will keep an eye on usage at all times, and send an alert if it’s ever becoming an issue.
The Bottom Line
Game developers need an IPM platform that can improve user experience and help scale games globally. This will ensure that players are getting the relaxing, lag-free gameplay that keeps them coming back for more. To learn more about other industry topics, check out LogicMonitor’s resource page.
Amazon Web Services (AWS) is almost ubiquitous with the terms “cloud computing” to many. With over 175 services, it is easy to understand why the growth and branding are strong. Here’s a fun game:
Which of these is NOT the name of an AWS Service offering:
- Elastic Compute Cloud (EC2)
- DynamoDB
- CodeStar
- Lumberyard
- Elemental MediaConvert
- QuickSight
They all are. It is likely you may have heard of many of these, but not all. It is less likely you can give a two-sentence brief on each of them or know what they do. Cloud computing often runs into a problem of scale. The scale of the cloud offerings and the scale of what you need from the cloud are very different. AWS is just one example of how cloud growth is continuing and ever-changing.
Amazon Web Services
Amazon Web Services offers everything from Infrastructure-as-a-Service (IaaS) through Platform-as-a-Service (PaaS) cloud services. For AWS, it is a matter of meeting its customers where they are.
Traditional on-premise infrastructure groups are starting to move their infrastructure to a hybrid cloud or exclusively cloud layout. AWS offers services like Elastic Compute Cloud (EC2) that provide virtual infrastructure to run servers that are managed by the customer and allow the same flexibility of function as running your own servers. Many of these customers will also use Simple Storage Service (S3) as a service to hold the information needed for their applications to function. These clients will also likely utilize Virtual Private Cloud (VPC) to provide the networking protection they are used to running on their own servers.
However, AWS also targets the world of cloud-native organizations. These organizations will likely leverage cloud services like Lambda, AWS’s serverless on-demand computing power. They may also leverage Kubernetes (k8s), often using AWS’s Elastic Kubernetes Service (EKS) to provide the implementation of k8s to make their software run.
There are any number of combinations of AWS services geared to all sectors of the market. You do not need to be a high tech company to leverage AWS. Their goal is to bring cloud computing optimizations to all of their customers, wherever they are, meet them at the level they need, and help them serve their business needs.
Monitor Your AWS
Now that you are adopting your AWS cloud strategy, you will need to be able to monitor and interact with these services to make sure your infrastructure is holding up its end of the bargain. It is nearly impossible for one person to hold the entirety of AWS’s offerings in their head, let alone be able to understand which aspects are important to monitor or be concerned about. Some very obvious metrics to look at are simple status checks for the cloud services you are leveraging. These could be as simple as check that an EC2 instance is functioning, however, it is often more important to understand that the EC2 instance you are looking at is connected to the other services that combine to provide business functionality. For this, LogicMonitor offers a solution called Service Insights that allows you to logically group your monitored services to business-level functionality.
Other known metrics to look for are CPU Utilization. For example, looking at your Relation Database Service (RDS) may be important, but at what level do you need to be concerned? LogicMonitor provides suggested Alert Thresholds for this and many other metrics for AWS cloud services so you can have visibility out-of-the-box to some critical infrastructure.
As you branch out to more niche services, the knowledge of what to monitor may become even fuzzier. For example, what metrics should you monitor for AppStream? LogicMonitor provides an out-of-the-box threshold for helping monitor thresholds of this service. When looking at SageMaker, what metrics matter? LogicMonitor provides several thresholds around disk and memory utilization, as well as suggested thresholds for invocation errors.
AWS can be a tangled mess or it can be a business lifeline. Let LogicMonitor help you understand and optimize your AWS cloud services so that you can focus on the important aspects of running your business. LogicMonitor can be the tool to help you gain confidence in the functionality of your AWS infrastructure and grow your responses to cloud infrastructure needs before they become business-critical outages. With more than 200 out-of-the-box alerts for metrics across the monitored AWS services, you can trust LogicMonitor to help you monitor your infrastructure.
To learn more about how LogicMonitor can help you monitor and understand your AWS usage and infrastructure or to see it in action, sign up for a free trial.
At LogicMonitor, we are continuously improving our platform with regards to performance and scalability. One of the key features of the LogicMonitor platform is the capability of post-processing the data returned by monitored systems using data not available in the raw output, i.e. complex datapoints.
As complex datapoints are computed by LogicMonitor itself after raw data collection, it is one of the most computationally intensive parts of LogicMonitor’s metrics processing pipeline. Thus, it is crucial that as we improve our metrics processing pipeline, we benchmark the performance of the computation of complex datapoints, so that we can perform data-driven capacity planning of our infrastructure and architecture as we scale.
LogicMonitor Microservice Technology Stack
LogicMonitor’s Metric Pipeline, where we built out a proof-of-concept of Quarkus in our environment, is deployed on the following technology stack:
- Java 11 (corretto, cuz licenses)
- Kafka (Managed in AWS MSK)
- Kubernetes
- Nginx (ingress controller within Kubernetes)

Why Did We Use JMH?
JMH (Java Microbenchmark Harness) is a library for writing benchmarks on the JVM, and it was developed as part of the OpenJDK project. It is a Java harness for building, running, and analyzing benchmarks of performance and throughput in many units, written in Java and other languages targeting the JVM. We chose JMH because it provides the following capabilities (this is not an exhaustive list):
- We can configure the code being benchmarked to run a specified number of “warmup” iterations first before any measurement actually begins. This allows the JVM optimizations to take place before we are actually going to benchmark it.
- We can configure the number of iterations the code will be run for benchmarking.
- We can configure what we want to measure. Options available include throughput, average time, sample time, and single execution time.
- We can configure JMH to allow garbage collection to take place during benchmark execution.
- We can configure JMH to pass JVM runtime arguments during benchmark execution e.g. we can specify all different JVM memory options.
- We can configure JMH to persist the report of the benchmark to file.
How Did We Benchmark the Computationally Intensive Code?
The first step for benchmarking computationally intensive code is to isolate the code so that it can be run by the benchmarking harness without the other dependencies factoring into the benchmarking results. To this end, we first refactored our code that does the computation of complex datapoints into its own method, such that it can be invoked in isolation without requiring any other components. This also had the additional benefit of modularizing our code and increasing its maintainability.
In order to run the benchmark, we used an integration of JMH version 1.23 with JUnit. First, we wrote a method that will invoke our complex datapoint computation with some test data. Then, we annotated this method with the @Benchmark annotation to let JMH know that we’d like this method to be benchmarked. Then, we actually configured the JMH benchmark runner with the configurations we wanted the benchmark to run with. This included:
- How many warm-up iterations we wanted to use.
- How many measurement iterations we wanted to use.
- What do we actually want to measure? For our purpose, we set this to throughput.
We also had the option of specifying JVM memory arguments, but in this case, the code we were benchmarking was computationally intensive and not memory intensive, so we chose to forego that.
Finally, we annotated the JMH benchmark runner method with @Test, so that we could leverage the JUnit test runner to run and execute the JMH benchmark.
This is how our JMH benchmark runner method looks:
| @Test public void executeJmhRunner() throws Exception { Options jmhRunnerOptions = new OptionsBuilder() .include(“\\.” + this.getClass().getSimpleName() + “\\.”) .warmupIterations(5) .measurementIterations(10) .forks(0) .threads(1) .mode(Mode.AverageTime) .shouldDoGC(true) .shouldFailOnError(true) .resultFormat(ResultFormatType.JSON) .result(“/dev/null”) .shouldFailOnError(true) .jvmArgs(“-server”) .build(); new Runner(jmhRunnerOptions).run(); } |
What Did We Find?
We ran the benchmark against different sizes of input data and recorded the throughput vs. size of input data. From the result of this, we were able to identify the computational capacity of individual nodes in our system, and from that, we were able to successfully plan for autoscaling our infrastructure for customers with computationally-intensive loads.

| No. of complex datapoints per instance | Average Time (in ms) |
| 10 | 2 |
| 15 | 3 |
| 20 | 5 |
| 25 | 7 |
| 32 | 11 |
Have you ever lost power to a server? Did it ever reboot on its own? Wouldn’t it be nice to prevent power outage to IT devices? If this is something you’ve experienced in the past, there are ways to simplify power monitoring and avoid some of the outages that can be caused by power issues. This article will focus on using power consumption data from a rack power distribution unit (rPDU) and how to simplify the process.
Many things can cause power problems. Have you ever experienced an outage due to a breaker tripping at home? I remember plugging in a fan one hot summer that tripped a breaker, shutting off the lights and my computer. This problem was quickly resolved. I just had to reset the breaker in the electrical panel and use a long extension cable to plug the fan into a socket in another room.
Imagine that happening in your IT infrastructure. It’s a nightmare for many reasons and remediation isn’t as simple as at home. Data centers are much larger, far away, and there are more breakers in every room of data centers.
Monitoring an electrical power system for a data center can be difficult but it doesn’t have to be. Some say it’s part science and part magic. It is hard to explain because physics is involved when discussing electricity. I’ll leave out the physics and logically describe how to gain the benefits of monitoring the power system. There are three main benefits that can be achieved:
- Improved uptime
- Reduced power expense
- Increased efficiency by supporting more IT equipment
I will focus on improving uptime since is the foundation before other benefits can be realized. After all, your on-premise data center houses the most critical application, so everything should be done to prevent outages.
Electrical Power System Overview
To increase uptime for the IT devices, some knowledge of the power system is required. Here is a simplistic, non-redundant overview:

All of the electrical power equipment must function properly in order for the IT devices to perform and deliver the always-connected, available anywhere applications to the digital world. Everything is built-in redundancy so the actual diagram should be much more complicated.

As you can see, IT devices get their power from the rack power distribution unit (rPDU). In the simplest form, they are larger versions of the power strip that you have on your desk. It connects to the power source and provides many outlets for the IT devices. They need to provide power and protect the IT devices. Modern IT devices require multiple power connections as they are power-hungry and also to provide redundancy within the device. As such, there are typically two to four rPDUs that feed power to IT devices. Two rPDUs are used for redundancy, just in case something in one power system fails.
The two main power attributes for our purpose are 1) “current” expressed in amperage (A or amp), and 2) “voltage” expressed using the same term, voltage (V or volt).
Provisioning Recommendations

Now that we have a basic understanding of how IT devices are connected to the power system, we have to discuss a little bit of math. There are three rules to follow when provisioning the rPDUs:
- Only provision to 50% maximum so that one unit can take the full load when its redundant pair fails
- Reserve 20% of its capacity to accommodate usage spike, e.g. during initial power-up (increase in fan noise is a good indicator)
- Never connect to open outlet within the rPDU without knowing the actual power usage load (which is what happened when I plugged in the fan in the introduction)
Amperage
With the rules above, only 40% of rPDU capacity should be provisioned realistically. Power current measured in amperage is the attribute used most when provisioning the power system. For example, with a 30 Amp rPDU, it should be handling less than 12 Amp most of the time.
Many rPDUs further segment within the unit. Each segment is commonly known as Branch Circuit. Typically, there are two to three branch circuits within a unit. Each branch circuit also includes a breaker to protect one circuit from another. These breakers are rated at 16 Amp (which is 80% of 20 Amp). This rating matches the capability of the C-13 and C-19 connectors that many IT devices use.
Recommendation #1 – Monitor Current at the Branch Circuit Level
Branch circuit breakers will engage (trip) under two conditions:
- A power surge in the system caused by any of the connected devices
- Overconsumption when connected IT devices require more than what rPDU can handle
To avoid breakers tripping, I recommend these alert threshold settings power current:
- Warning at greater than 30%
- Error at greater than 35%
- Critical at greater than 38%
When you get the warning alert, you should keep a close eye on it to make sure that the power consumption is not increasing over time. When you get the critical alert, consider re-provisioning or moving some of the IT devices off that branch circuit. Having historical data can assist in identifying where to move it.
Voltage
So far we mainly discussed the power current attribute. Another important attribute is the power voltage measured in voltage (V). Power current and voltage work together but they behave differently. Most IT devices use power supplies that have their own performance requirements, expressed both in the amperage and voltage. When under-delivered, the power supply units cannot provide sufficient power to components within the IT devices which can cause an outage.
NOTE: Many IT devices will report the power consumption. Make sure to look for input (not output) of their power supply to compare to power measurements from the rPDU.
Recommendation #2 – Monitor Voltage
Power voltage does not vary significantly within the rPDU. Monitoring voltage and comparing it to the requirements of the power supply is critical. Most IT device power supplies will have a range of 208V to 240V. Unlike amperage, the voltage should be monitored so it does not go below the minimum requirement.
To avoid issues with the devices power supply, I recommend these alert threshold settings for power voltage:
- Warning at less than minimum voltage requirement (e.g. 210V)
- Error at less than 5V below the minimum voltage requirement (e.g. 205V)
- Critical at less than 10V below the minimum voltage requirement (e.g. 200V)
The power supply and its requirement from the vendor behave differently, let’s call this sensitivity. The sensitivity of the actual voltage that might cause the power supply to fail will vary between units and models but this is a good starting point.
If any of the alerts are triggered, keep an eye on it, and if it occurs regularly, contact an electrician to resolve the issue. Low voltage is commonly a problem with the source where rPDUs get their power. Typically, a floor-standing PDU is a source. It handles higher power so an electrician is needed to investigate the issue.
Simple Network Management Protocol (SNMP)
Many rPDUs with monitoring capabilities support SNMP, which is great news. The bad news is that ObjectID needed to implement my recommendations is not standardized, so it requires a little investigation to determine which OID to use.
Here is a sample SNMP OIDs for some of the vendors:
| Vendor | Branch Circuit Current | Voltage |
| APC (Schneider Electric) | .1.3.6.1.4.1.318.1.1.15.4.2.3.1.5.a a = xPDUBranchBreakerTableIndex | .1.3.6.1.4.1.318.1.1.15.3.1.4.1.2.a a = xPDUMainInputVoltagePhaseIndex |
| Eaton | .1.3.6.1.4.1.534.6.6.7.5.4.1.3.a.b a = strappingIndex b = groupIndex | .1.3.6.1.4.1.534.6.6.7.5.3.1.3.a.b a = strappingIndex b = groupIndex |
| Geist (Vertiv) | .1.3.6.1.4.1.21239.5.2.3.3.1.4.a a = breakerindex | .1.3.6.1.4.1.21239.5.2.3.3.1.8.a a = breakerindex |
| Raritan (Legrand) | .1.3.6.1.4.1.13742.6.5.3.3.1.a.b.1 a = pudid b = breakerid | .1.3.6.1.4.1.13742.6.5.3.3.1.a.b.4 a = pudid b = breakerid |
| Server Technology | .1.3.6.1.4.1.1718.3.2.7.1.7.a.b.c a = towerIndex b = infeedIndex c = branchIndex | .1.3.6.1.4.1.1718.3.2.2.1.11.a.b a = towerIndex b = infeedIndex |
NOTE: refer to vendor specific Management Information Base (MIB) for details
Benefits of Using LogicMonitor
LogicMonitor can simplify monitoring electrical power system. With automations and deeper insights into power consumption data, taking the proper action at the right time can help in avoiding outages related to electrical power issues. Here are some feature highlights that have a direct impact on power monitoring:
- Automatically monitor power consumption
- Active Discovery can automatically detect rPDUs with monitoring capabilities
- PropertySource can automatically identify the type of rPDU and differentiate between all the variants used, e.g. single phase vs 3-phase
- DataSource can automatically collect power consumption and apply alert thresholds
- Take actions based on deeper insight
- Dynamic Threshold will learn each units normal operating consumption and alerts when reading shows outside the benchmarked band (gray bar below) even when consumption within the rPDU’s capability

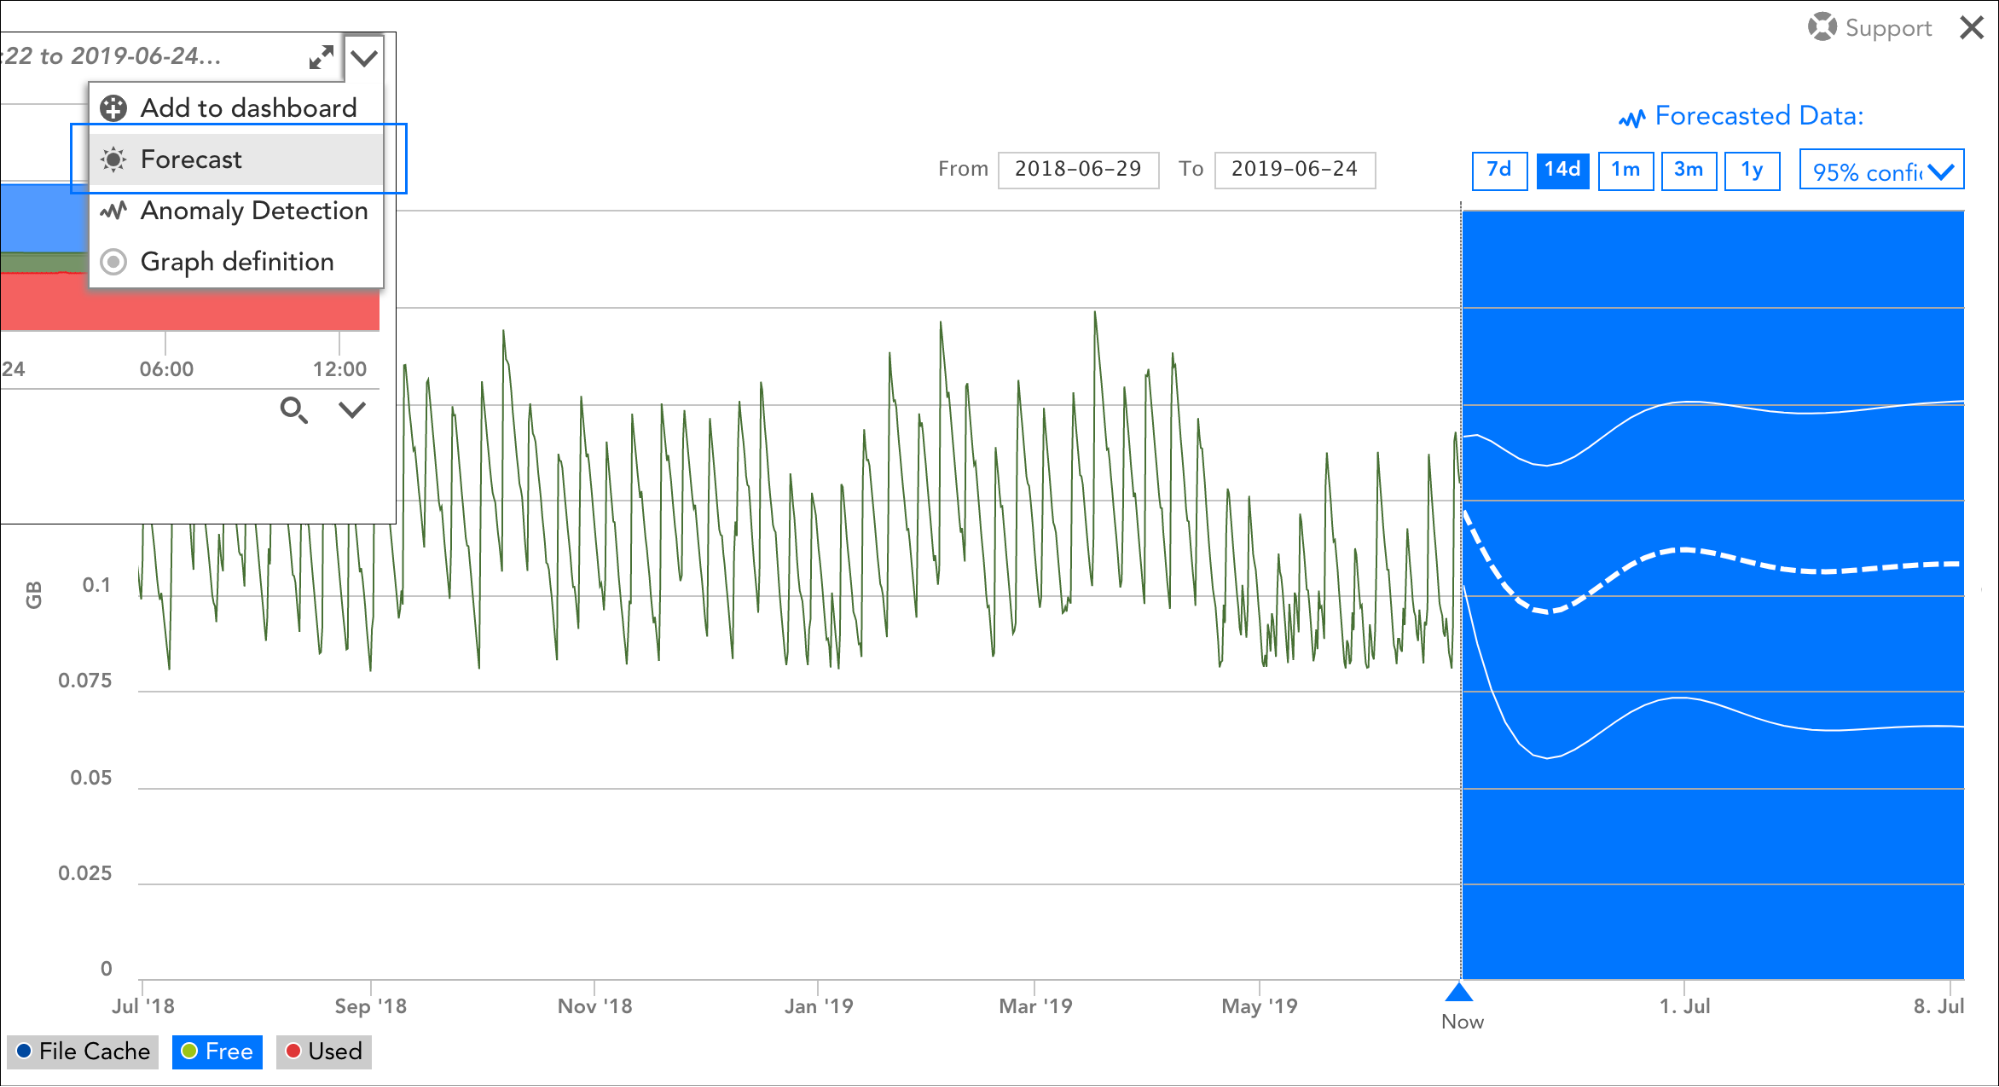
- Forecasting will provide early visibility to a potential risk of reaching the ceiling of the rPDU capacity
As you can see, preventing potential outage caused by the electrical power system can be easily implemented purposefully using LogicMonitor. We make it simple to add rPDUs as a monitored resource and apply alerts and analyze collected data. As the saying goes, you set it and forget it. If you are interested in learning more about LogicMonitor’s capabilities, connect with your customer success manager or attend a weekly demo to see LogicMonitor in action.
A Minimum Viable Product (MVP) in software development is often what we strive for when proving a case for improvement or product. With the movement toward the cloud infrastructure, we should start striving for a Minimum Viable Cloud (MVC). An MVC consists of everything needed to get a cloud environment up and running. The main services of cloud infrastructure are Communication, Application, and Storage. In this blog, we’re going to break down these services in more detail and explain how to make your MVC successful in three of the top cloud providers: Amazon Web Services (AWS), Microsoft Azure, and Google Cloud Platform (GCP).
Communication Layer
The Communication layer of cloud infrastructure services starts with external communication or “Front Door” services. There are also communication services that operate between other cloud infrastructures including queue and publish/subscribe model messaging for within the cloud. Most cloud implementations also include a service for managing your Domain Name System (DNS). Another common communication service that most cloud infrastructures include is load balancing services.
Application Layer
The Application layer of cloud includes virtual machines, serverless computing, container services, and other versions of the Platform as a Service (PaaS). Cloud Virtual Machines (VMs) come in all shapes and sizes for different cloud providers and they are often called Infrastructure as a Service (IaaS). Serverless computing services are offered by cloud providers and are a distinctly cloud-based solution that falls in the Software as a Service (SaaS). Container services range from specific Kubernetes services to more general services that support other containerization like Docker. The more generic versions of the application layer are just Platform as a Service.
Storage Layer
The Storage layer of the cloud includes database, cache, and file storage. For database storage, there is support for SQL, no SQL, and often a cloud-native database. Cache storage includes cloud-related caching services, including support for Redis. There is also the need for file storage in the cloud to allow the serving of code and website data, among other files.
MVC Requirements for AWS, Azure, and GCP
Amazon Web Services (AWS)

When you look at Amazon Web Services (AWS), you see all of these levels of services to make your MVC successful. Support in the communication area includes these AWS services:
API Gateway – a “Front Door” for publishing APIs to external and internal consumers.
Simple Notification Service (SNS) – a publish/subscribe push implementation often coupled with SQS.
Simple Queue Service (SQS) – a publish/subscribe implementation queue implementation often coupled with SNS.
Route 53 – a service allows you to manage your cloud DNS records.
Elastic Load Balancing (ELB) – a service for allowing load balancing implementations.
The services for supporting the application and container layer of your MVC in AWS are:
Elastic Cloud Computing (EC2) – IaaS service which is used for handling VMs.
Lambda – SaaS for serverless applications.
Amazon Container Service (ECS) – a service for handling Docker containers for microservices.
Elastic Kubernetes Service (EKS) – a service for fully managed Kubernetes.
Elastic Beanstalk – PaaS for managed web applications and services.
The service options in AWS for supporting your database and storage needs include:
DynamoDB – a service for supporting your NoSQL databases.
Relational Database Service (RDS) – a relational database management system service.
Simple Storage Services (S3) – a service that stores files and everything else needed for web applications.
ElastiCache – a service for distributed caching including Redis caching.
Microsoft Azure

A Microsoft Azure MVC will include a selection of these services also. For handling the communication layers in Azure you can use a collection of these services:
API Management – Azure’s version of a “Front Door” service.
Service Bus – a message based publish/subscribe service.
Event Grid – an event-based publish/subscribe service.
Azure DNS – a service for managing your DNS in the cloud.
Load Balancer – a service for load balancing traffic on your TCP and UDP connections.
For the application and container layer in Azure you can look to these services:
Virtual Machine – IaaS service which is used for handling VMs.
Functions – SaaS serverless applications.
Container Instances – a service for managing Docker containers for microservices.
Kubernetes Service (AKS) – the service Azure has for managing Kubernetes.
App Service – PaaS for managed hosting for deploying and scaling your applications.
Azure’s services for the database and storage layer include:
Cosmos DB – a service used for NoSQL databases.
SQL DB – Azure has split coverage of SQL and MySQL relational databases.
MySQL DB – Azure has split coverage of SQL and MySQL relational databases.
Blob Storage – a service for managing the other files and objects you may need for your MVC.
Cache for Redis – it says it on the tin: a service for managing cache for Redis.
Google Cloud Platform (GCP)

Google Cloud Platform also offers an array of services needed for making your cloud MVC. In the communication layer some of the services available are:
Apigee – the service for GCP’s “Front Door”.
Cloud Pub/Sub – a publish/subscribe service.
Cloud DNS – a service for managing cloud DNS.
Network Load Balancing – a service for … you guessed it network load balancing.
In the application and container layer the services in GCP are:
Compute Engine – IaaS for managing your VMs.
Cloud Functions – SaaS serverless applications.
Cloud Run – for managing Docker containers for microservices
Kubernetes Engine (GKE) – the fun part here is that Google manages Kubernetes so the GKE is a really cool service for managing K8s.
App Engine – PaaS for managed hosting for deploying and scaling your applications.
GCP is much more advanced than just your Google Drive shared storage. The services in GCP include:
BigTable – a service for NoSQL databases and management.
Cloud SQL – GCP also separates SQL and other relational databases.
Cloud MemoryStore – a service for other relational databases.
Cloud Storage – a service for most of your other object storage.
Memorystore For Redis – a Redis cache management service.
Monitor Your MVC Infrastructure
All of this discussion about MVC may leave you wondering what you need next for your cloud infrastructure. The answer is a way to monitor and keep track of your MVC infrastructure’s performance. You will also want some amount of customizable alerting to keep you informed of any changes and prevent outages. One platform for doing this is LogicMonitor. Of the services discussed above, LogicMonitor covers all except GCP Apigee, and GCP Cloud DNS. Do not worry though because these services are on our roadmap for coverage.
To summarize, a cloud infrastructure MVC across the main cloud providers is not terribly distinct from standing up your own software MVP except that it lives on the cloud. Once you have the cloud MVC stood up, or even multiples across multiple cloud providers, you will likely want to start monitoring them. A simple solution would be to sign up for LogicMonitor and let the agentless cloud collector start doing its job of monitoring your cloud infrastructure. To get started with a demo of LogicMonitor’s insight into the performance of your environment. Try it free, or book a free demo today.